Showing posts with label Chuvash. Show all posts

February 16, 2015

Turkic language family time depth: 204BC

From the paper:
The regular-sound-change tree estimates a mean divergence time between the outgroup Chuvash and other Turkic languages of 204 BCE, with a 95% credible interval of 605 BCE to 81 CE. This compares to proposals from glottochronological analyses that suggest dates of 30 BCE to 0 CE [21] and 500 BCE to 50 CE from historical data [18, 21 and 22]. The sporadic-sound-change model estimates the mean age of the tree to be more than two millennia older (2408 BCE, 95% CI = 3994–1279 BCE), because it wrongly assumes that the many occurrences of regular sound change along the outgroup Chuvash branch are multiple instances of independent phonological change.
Current Biology Volume 25, Issue 1, 5 January 2015, Pages 1–9

Detecting Regular Sound Changes in Linguistics as Events of Concerted Evolution

Daniel J. Hruschka et al.

Summary

Background

Concerted evolution is normally used to describe parallel changes at different sites in a genome, but it is also observed in languages where a specific phoneme changes to the same other phoneme in many words in the lexicon—a phenomenon known as regular sound change. We develop a general statistical model that can detect concerted changes in aligned sequence data and apply it to study regular sound changes in the Turkic language family.

Results

Linguistic evolution, unlike the genetic substitutional process, is dominated by events of concerted evolutionary change. Our model identified more than 70 historical events of regular sound change that occurred throughout the evolution of the Turkic language family, while simultaneously inferring a dated phylogenetic tree. Including regular sound changes yielded an approximately 4-fold improvement in the characterization of linguistic change over a simpler model of sporadic change, improved phylogenetic inference, and returned more reliable and plausible dates for events on the phylogenies. The historical timings of the concerted changes closely follow a Poisson process model, and the sound transition networks derived from our model mirror linguistic expectations.

Conclusions

We demonstrate that a model with no prior knowledge of complex concerted or regular changes can nevertheless infer the historical timings and genealogical placements of events of concerted change from the signals left in contemporary data. Our model can be applied wherever discrete elements—such as genes, words, cultural trends, technologies, or morphological traits—can change in parallel within an organism or other evolving group.

Link

November 03, 2012

Admixture in the Chuvash and the Uygur

I took the Behar et al. (2010) sample of Chuvash, excluding GSM536731 which has atypical ancestry and merged it with the Li et al. HGDP French_Basque and Dai. The latter two populations don't show evidence of admixture according to both the f3-statistic and ALDER (Loh et al. 2012). (I used a --geno 0.03 flag in PLINK and extracted a subset of SNPs including in the Rutgers recombination map for Illumina chips).

The f3-statistic f3(Chuvashs_16; French_Basque, Dai) was equal to -0.011311 (Z=-31.308), indicative of admixture.

I then ran an ALDER analysis:


Test SUCCEEDS (z=4.85, p=1.2e-06) for Chuvashs_16 with {French_Basque, Dai} weights

DATA: success (warning: decay rates inconsistent) 1.2e-06 Chuvashs_16 French_Basque Dai 4.85 3.78 5.18 50% 40.27 +/- 5.80 0.00032377 +/- 0.00006676 28.21 +/- 7.47 0.00004231 +/- 0.00000962 47.08 +/- 4.53 0.00016628 +/- 0.00003212

DATA: test status p-value test pop ref A ref B 2-ref z-score 1-ref z-score A 1-ref z-score B max decay diff % 2-ref decay 2-ref amp_exp 1-ref decay A 1-ref amp_exp A 1-ref decay B 1-ref amp_exp B

This indicates that the Chuvash can be seen as admixed, but with inconsistent decays: the one with the French Basque (=28.21) is younger than the one with the Dai (=47.08). I think this makes fairly good sense, because the Chuvash are descended from people who came to Europe during the 1st millennium AD and must have later mixed with Europeans, perhaps with eastern Slavs as these made their way eastward during the 2nd millennium AD.

I then carried out similar analyses on the HGDP Uygur. As expected f3(Uygur; French_Basque, Dai) = -0.023917 (Z = -60.362), indicative of admixture. The ALDER analysis:


Test SUCCEEDS (z=6.85, p=7.4e-12) for Uygur with {French_Basque, Dai} weights

DATA: success 7.4e-12 Uygur French_Basque Dai 6.85 4.47 7.39 15% 20.56 +/- 3.00 0.00036760 +/- 0.00003660 22.59 +/- 5.06 0.00010920 +/- 0.00002025 19.46 +/- 2.64 0.00007864 +/- 0.00000710

DATA: test status p-value test pop ref A ref B 2-ref z-score 1-ref z-score A 1-ref z-score B max decay diff % 2-ref decay 2-ref amp_exp 1-ref decay A 1-ref amp_exp A 1-ref decay B 1-ref amp_exp B

suggests a very recent admixture on both the European and East Asian side. It seems fairly clear that whatever admixture was taking place in Central Asia, perhaps for thousands of years, the present-day Ugyur were formed, at least in part, by a fairly recent, perhaps post-Mongol admixture event.

January 30, 2012

AAPA 2012 abstracts (part 1)

Here are some interesting abstracts from the 81st Annual Meeting of the American Association of Physical Anthropologists.


Maternal marks of admixture in Cape Coloreds of South Africa.
KRISTINE G. BEATY1, DELISA L. PHILLIPS1, MACIEJ HENNEBERG2 and MICHAEL H. CRAWFORD1.
Previous studies of genetic diversity have suggested that the Cape Coloureds of South Africa are a highly admixed population with genetic roots from indigenous African groups including Khoisans, and the later arrival of Bantu speaking Xhosa farmers. Further genetic contributions came during European colonization of South Africa, which added to the inclusion of largely male European markers to the gene pool. Slaves from Indonesia, Malaysia, Madagascar and India are also thought to have contributed to the genetic makeup of this ethnic group. This study examines the maternal contribution of each of these groups to the genetic diversity of the Cape Coloreds through sequencing of the hypervariable region I of the mitochondrial DNA and through restriction fragment length polymorphism.
A total of 123 individuals were examined for this study. High frequencies of haplogroups L1 and L2 were found at 81.3 percent in this group (100 of the 123 individuals), which indicates that this group has a large African contribution to its mitochondrial makeup. Restrictions of the major European haplogroups identified nine individuals, 7.3 percent of the sample, belonged to haplogroups I and J. Five individuals (4.1 percent of the sample) belonged to the superhaplogroup M, indicating that Asian slaves did contribute to the maternal gene pool. The majority of maternal lineages in this Cape Coloured sample are African in origin, with some European influence and a small contribution from Asian maternal lineages.

Ancient DNA reveals the population origin of the Eastern Xinjiang.
SHIZHU GAO2, HONGJIE LI1, CHUNXIANG LI1 and HUI ZHOU1,3.
Connecting with the Turpan Basin, the Eurasia steppe and the Gansu Corridor, the Eastern region of Xinjiang has played a significant role in the history of human migration, cultural developments, and communications between the East and the West. The population origin, migration and integration of this region have attracted extensive interest among scientists.
In order to research the population origin and movement of the Eastern Xinjiang, genetic polymorphisms studies of the Hami population were conducted. The Hami site is located in the East of Tian-Moutain in Xinjiang, dating back to the Bronze-early Iron Age. Archaeological studies showed that the culture of the Hami site possessed features from both the East and the West. Ancient mtDNA analysis showed that A, C, D, F, G, Z and M7 of the Eastern maternal lines, and W, U2e, U4, and U5aof the Western maternal lines were identified. Tajimas’D test and mismatch distribution analysis show that the Hami population had experienced population expansion in recent time. The demographic analysis of haplogroups suggests that the populations of the Northwest China, Siberia and the Central Asia have contributed to the mtDNA gene pool of the Hami population.
Our study reveals the genetic structure of the early population in Eastern Xinjiang, and its relationships with other Eurasian populations. The results will provide valuable genetic information to further explore the population origin and migration of Xinjiang and Central Asia.


Analysis of Chuvash mtDNA points to Finno-Ugric origin.
ORION M. GRAF1, STEPHEN M. JOHNSON1, JOHN MITCHELL2, STEPHEN WILCOX3, GREGORY LIVSHITS4 and MICHAEL H. CRAWFORD1.
A sample of 92 unrelated individuals from Chuvashia, Russia was sequenced for hypervariable region-I (HVR-I) of the mtDNA molecule. These data have been verified using RFLP analysis of the control region, revealing that the majority exhibit haplogroups H (31%), U (22%), and K (11%), which occur in high frequencies in western and northern Europe, but are virtually absent in Altaic or Mongolian populations. Multidimensional scaling (MDS) was used to examine distances between the Chuvash and reference populations from the literature. Neutrality tests (Tajima’s D (-1.43365) p<0.05, Fu’s FS (-25.50518) p<0.001) and mismatch analysis, which illustrates unimodal distribution, all suggest an expanding population.
The Chuvash speak a Turkic language that is not mutually intelligible to other extant Turkish groups, and their genetics are distinct from Turkic-speaking Altaic groups. Some scholars have suggested that they are remnants of the Golden Horde, while others have advocated that they are the products of admixture between Turkic and Finno-Ugric speakers who came into contact during the 13th century. Earlier genetic research using autosomal DNA markers indicated a Finno-Ugric origin for the Chuvash. This study examines uniparental mitochondrial DNA markers to better elucidate their origins. Results from this study maintain that the Chuvash are not related to Altaic or Mongolian populations along their maternal line, thus supporting the “Elite” hypothesis that their language was imposed by a conquering group —leaving Chuvash mtDNA largely of Eurasian origin. Their maternal markers appear to most closely resemble Finno-Ugric speakers rather than Turkic speakers.


An ancient DNA perspective on the Iron Age “princely burials” from Baden-Wurttemberg, Germany.
ESTHER J. LEE1, CHRISTOPH STEFFEN1, MELANIE HARDER1, BEN KRAUSE-KYORA1, NICOLE VON WURMB-SCHWARK2 and ALMUT NEBEL3.
During the Iron Age in Europe, fundamental social principles such as age, gender, status, and kinship were thought to have played an important role in the social structure of Late Hallstatt and Early Latene societies. In order to address the question of kinship relations represented in the Iron Age “princely burials” that are characterized by their rich material culture, we carried out genetic analysis of individuals associated with the Late Hallstatt culture from Baden-Wurttemberg, Germany. Bone specimens of thirty-eight skeletal remains were collected from five sites including Asperg Grafenbuhl, Muhlacker Heidenwaldle, Hirschlanden, Ludwigsburg, and Schodeingen. Specimens were subjected to DNA extraction and amplification under strict criteria for ancient DNA analysis. We successfully obtained mitochondrial DNA (mtDNA) control region sequences from seventeen individuals that showed different haplotypes, which were assigned to nine haplogroups including haplogroups H, I, K, U5, U7, W, and X2b. Despite the lack of information from nuclear DNA to infer familial relations, information from the mtDNA suggests an intriguing genetic composition of the Late Hallstatt burials. In particular, twelve distinct haplotypes from Asperg Grafenbuhl suggest a heterogeneous composition of maternal lineages represented in the “princely burials”. The results from this study provide clues to the social structure reflected in the burial patterns of the Late Hallstatt culture and implications on the genetic landscape during the Iron Age in Europe.


Genetic snapshot from ancient nomads of Xinjiang.
HONGJIE LI1, SHIZHU GAO2, CHUNXIANG LI1, YE ZHANG1, WEN ZENG3, DONG WEI3 and HUI ZHOU1,3.
Nomads of the Eurasian steppes are known to have played an important role in the transfer commodities and culture among East Asia, Central Asia, and Europe. However, the organization of nomadic societies and initial population genetic composition of nomads were still poorly understood because of few archaeological materials and written history.
In this study, the genetic snapshot of nomads was emerged by examining mitochondrial DNA and Y-chromosome DNA of 30 human remains from Heigouliang (HGL) site in the eastern of Xinjiang, which dated 2000 years ago and associated to the nomadic culture by archaeological studies. Mitochondrial DNA analysis showed that the HGL population included both East Eurasian haplogroups (A, C, D, G, F and Z) and West Eurasian haplogroups (H, K, J, M5 and H). The component of Eastern haplogroups is dominant. The distribution frequency and Fst values of Eastern haplogroups indicated the HGL population presented close genetic affinity to the nearby region modern populations of Gansu and Qinghai, while those of western haplogroups showed similar with Mongolia and Siberia populations. The results implied various maternal lineages were introduced into the HGL population. Regarding the Y chromosomal DNA analysis, nearly all samples belonged to haplogroup Q which is thought to be the mark of the Northern Asian nomads. We identified paternal kinship among three individuals at the same tomb by Y-STR marker.
Combined with archaeological and anthropological investigations, we inferred that the gene flow from the neighboring regions was possibly associated with the expansion of Xiongnu Empire.


Vikings, merchants and pirates at the top of the world: Y-chromosomal signatures of recent and ancient migrations in the Faroe Islands.
ALLISON E. MANN1, EYDFINN MAGNUSSEN2 and CHRISTOPHER R. TILLQUIST1.
The Faroe Islands are a small archipelago in the North Atlantic Ocean. With a current population of approximately 48,000 individuals and evidence of high levels of genetic drift, the Faroese are thought to have remained highly homogeneous since the islands were settled by Vikings around 900CE. Despite their geographic isolation, however, there is historical evidence that the Faroese experienced sporadic contact with other populations since the time of founding. Contact with Barbary pirates in the seventeenth century is documented in the Faroes; there is also the possibility of modern migrations to work in the highly productive fishery. This study set out to distinguish the signal of the original founders from later migrants. Eleven Y-chromosomal STR markers were scored for 139 Faroese males from three geographically dispersed islands. Haplotypes were analyzed using Athey's method to infer haplogroup. Median-joining networks within haplogroups were constructed to determine the phylogenetic relationships within the Faroese and between likely parental populations—Danish, Irish, and Norwegians. Dispersal patterns of individuals around Faroese haplogroups suggest different times of haplotype introduction to the islands. The most common haplogroup, R1a, consists of a large node with a tight network of neighbor haplotypes, such that 68% of individuals are one or two mutational steps away. This pattern may represent the early founder event of R1a in the Faroes. Other distributions, especially of non-Scandinavian haplotypes, document more recent introductions to the islands. The overall pattern is one of a strong founder effect followed by minor instances of later migrations.


Date estimates for major mitochondrial haplogroups in Yemen.
DEVEN N. VYAS1, VIKTOR ČERNÝ2, ALI AL-MEERI3 and CONNIE J. MULLIGAN1.
Yemen occupies a key location as the first stop for anatomically modern humans on a theoretical southern migration route out of Africa. If modern humans did pass through Yemen during the first migrations out of Africa and if they left modern-day descendants, we would expect to see deep divergences in the Yemeni mitochondrial gene tree. Alternatively, if modern humans passed through Yemen but did not leave modern-day descendants or if Yemen was not on the path of these ancient migrations, we would expect more recent dates to be associated with Yemeni mitochondrial haplogroups.
Using 44 previously sequenced mitochondrial genomes as well as 24 newly sequenced mitochondrial genomes from samples collected throughout Yemen, several methods were used to estimate divergence dates of major Yemeni haplogroups including L2, M, R0a and HV. Specifically, phylogenetic trees were generated using MrBayes and maximum likelihood methods. Bayesian and ρ statistic based methods were used to estimate dates of Yemeni haplogroups and these dates were compared with each other, previously published dates for these haplogroups, approximate dates of climatic change that might be expected to correlate with population expansions, and estimates based on archaeological and paleontological evidence for the first migrations out of Africa. These comparisons are intended to cover the range of possible haplogroup divergence dates with respect to the history of early modern humans in southern Arabia.


September 27, 2011

Uzbeks as the nexus, Altai as the source of Turkic expansions

I have often used Uzbeks as a convenient population to assess the extent of Central Asian Turkic admixture in West Eurasia. The recent Yunusbayev et al. (2011) paper has provided some interesting supporting evidence for that use:


I have extended lines from Uzbeks through the four different western Eurasians Turkic populations: Turks, Turkmen, Nogais, and Chuvashs. It is interesting that these lines intersect West Eurasians at different points:
  • The line of Turks (Anatolia) with Armenians and Georgians
  • The line of Turkmen (Iran) with Iranians
  • The line of Nogais (North Caucasus) with Chechens
  • The line of Chuvashs (far eastern Europe) beyond Russians
These are what we expect if ancestral Turkic speakers en route from their ultimate eastern homeland were roughly like modern-day Uzbeks at some stage before their settlement in west Eurasia. The linearity of the Uzbek-Turkic population-Native population triples is striking

The only case where the fit is not almost perfect is that of the Chuvashs, who are the most northern population. It is easy enough to discover the cause of this. Chuvash have ~1.1% South Asian, as opposed to ~8.2% in the Uzbeks. There is a north-south latitudinal cline of the "South Asian" component in middle Eurasia, and the ancestors of the Chuvash moved at the northern end of that cline; of the Uzbeks at the middle.

If we add a line linking Russians with Chuvashs, we can reconstruct the hypothetical Proto-Chuvashs as a population that differed from Uzbeks in being less "South Asian", which confirms the Dodecad admixture data:

The mystery is further resolved once we look at the following PCA plot from my article On the northern/southern Caucasoid contributions to Asia


Notice that Turks, Uzbeks and the pair of Altai and Dolgan fall along one line, while Chuvashs, Russians, and the pair of Altai/Dolgan along another.

So, the data seems consistent with the idea that the primary source of the westward Turkic expansions was something like the Altai (pics) and Dolgan, undergoing transformations and successive admixtures all the way to the Mediterranean and eastern Europe.

November 07, 2010

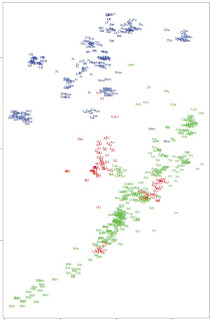
Multidimensional scaling and ADMIXTURE across Northern Eurasia corresponds to geography and language

Here is a multi-dimensional scaling plot of a number of North Eurasian populations. In comparison to my previous post, I have excluded Americans and Greenlanders, and added several other populations from Central Asia and West Eurasia.

Population labels have been printed in the co-ordinates of the population averages; these largely correspond with identifiable blobs of colored points, but note that some populations have several outliers, so labels appear in white space. Most notable in that respect are the Koryak, Chukchi, and the Nganasan, all of whom have some apparently European-admixed individuals.


"Mongol" corresponds to Rasmussen et al. (2010) Mongol sample, while "Mongola" to the HGDP-CEPH one. The population codes on the left may not be clearly visible as they overlap with each other and are CEU, LT, HU (relatively unadmixed Caucasoids), FI/RU (Uralian-admixed northern Caucasoids), IR/TR (Altaic-admixed southern Caucasoids). The West Eurasian part of the plot can be seen blown up on the right.

The correspondence with geography and language is striking. Siberian isolates from the extreme north and east, Koryak and Chuckhi are on top; HapMap Chinese at the bottom. Between them are Uralians (Selkup, Yukagir, Nganassan) and Altaics (Mongol-Tungus-Turkic people).

Below is ADMIXTURE analysis for the same set of populations, for K=7:


Finns and Russians seem to have an excess of the "Nganasan" component over the Altaic, while Turks have the opposite. Below is a table of Fst distances between components:


The close relationship between the two Caucasoid components is apparent (Fst=0.033), but note fairly large Fst divergences between the morphologically Mongoloid groups. I attribute this mostly to the very low population sizes of these groups, which have probably affected them by drift. For the less demographically constrained Altaic and East Asian components, Fst=0.044.

If you are not familiar with these ethnic groups, the Red Book of the Peoples of the Russian Empire and the Ethnologue indexes on Altaic and Uralic are invaluable, as are the portraits of ethnic groups of China. On the right a picture of a Nganasan.

UPDATE: Also, a past post from the blog, collating Y-haplogroup N frequencies with anthropological descriptions. Nganasans apparently belong to haplogroup N at a frequency of 92.1%!

October 17, 2010

ADMIXTURE across Eurasia: from Anatolia to Siberia

(Last Update: Oct 17)

Here is a result of an ADMIXTURE run of a few populations from Eurasia (left to right: Turks, Armenians, Georgians, followed by a mix of Uygur, Mongolians, Yakut, Hezhen in no order), combining the HGDP dataset with that of Behar et al. (2010).

It's more of a test, rather than a final result, as I've just finished integrating the two datasets, but it's a nice comparison of a wide assortment of linguistic families.

Notice Turks and Armenians being quite similar to each other, (green+blue), although Turks are differentiated by the presence of an east Eurasian component (5.5%). On the basis of uniparental markers, five years ago, I estimated this component as 6.2% which seems to be right on the money. In the combined Armenian/Georgian sample this admixture is only 0.14% and as can be seen is limited to a handful of Georgian individuals.

It is interesting that Georgians belong semi-uniquely to the green cluster. Turks' non-Mongoloid ancestors were Indo-European speaking like the Armenians still are. It would be tempting to see in the blue-green contrast an Indo-European/Caucasian one, especially as the Caucasoid component further east seems to be mainly blue, in agreement with the idea that it was Indo-Europeans (in particular mainly Iranic speakers) who brought Caucasoid genes to the heartland of Asia.

UPDATE I (Oct 17):

Moving to the north, we see (left-to-right) Han (red), Hungarian/Belorussian (blue), Chuvash (first red "step"), Uzbek (second red "step"). Unlike the Turks, the Hungarians, who also speak a language that came from the east, seem to lack a noticeable east Eurasian component.

Their linguistic conversion was one of elite dominance, where a handful of Mongoloid and quasi-Mongoloid upper echelons left their language but not their genes:
According to his observations, the “overlords” were characterized by Turanid, Uralian and Pamir race elements and also by certain long-headed components. The “middle layer” or “warriors’ layer”, however, showed an anthropological profile distinctly different from that of the overlords. It was essentially constituted by Mediterraneans, Nordoids (who might also have been tall robust Mediterraneans) and Pamir component while the absence of Turanid and Uralian race characteristics was remarkable. As regards the third layer, the so-called “common folk”, they were dominated, just as the middle layer was, by Mediterranean and Nordoid elements but, in addition, the Cromagnoid ones were also significant.
The Chuvash are Turkic and live in Europe, while the Uzbeks, closer to the Altaic homeland in Asia are also Turkic, and have a predictable higher percentage of east Eurasian genes.

June 09, 2010

Genome-wide structure of Jews (Behar et al. 2010)

(Last Update: Jun 10)
Another comprehensive new study on Jews (after Atzmon et al. 2010). The paper also has freely available supplementary information online.

On the left, PCA from Supplementary Figure 3, shows clearly at least three different Jewish clusters. Note the main Ashkenazi/Sephardi cluster halfway between Tuscans and Near Eastern populations, a Yemeni Jewish cluster coinciding with Bedouins and Saudi Arabians, and a West Asian cluster encompassing Georgian, Iranian, Iraqi, etc. Jews.

Below is ADMIXTURE analysis in the global context.

There is a ton of information in the above figure, for Jews and non-Jews alike. Some observations:


  • Ethiopians and Ethiopian Jews look identical, between Sub-Saharan Africans and West Asians .
  • Sub-Saharan admixture in Egyptians and Yemenites is quite evident; lack of such admixture in Europe and non-Arabs from West Asia.
  • A little Caucasoid admixture in Mongols
  • Split of Mongoloids into two clusters, which appear to be "northern" and "southern"
  • Central Asian Turkic speakers (Uygur, Uzbek) derived from both Mongoloid sub-clusters; their Caucasoid components are mainly West Asian (light green) rather than north European (dark blue)
  • Non-European components in Russians are resolved into Caucasoid light green and "north Mongoloid" (see above)
  • A little of the "north Mongoloid" component in Turks and some populations from the Caucasus, not much elsewhere in West Eurasia
  • South Asian (green) component in Cambodians
  • Russians and Lithuanians lack south European (light blue) component but have some west Asian (light green)
  • Cypriots are split between West Asia and Southern European components, with minority Semitic (Phoenicians or Syrian Christians?) and northern European ones.
  • French Basque and Sardinians lack West Asian component (light green)

The regional ADMIXTURE analysis is also quite enlightening.


UPDATE I (Jun 10):

What does this study actually tell us about the origins of modern Jews? Are they descended from ancient Jews, and to what degree did they admix with non-Jewish populations either in West Asia or elsewhere?

The smoking gun of an ancestral Jewish gene pool is still missing. Note, for example, the emergence of a "purple" Mozabite cluster in the global ADMIXTURE analysis, or of three distinct Palestinian- Druze- and Bedouin- centered clusters in the regional analysis.

If modern Jews are descended from an ancient Jewish population, we would expect the emergence of such a Jewish-centered component in the ADMIXTURE analysis. Such a component would be centered on Jews but might also spill out to some degree to other populations.

Rather, Jews appear to be variable mixtures of three components (in the regional figure): pink, which is shared by them and Arab speakers; very light blue, which is shared by them and non-Arab West Asians and south Europeans; medium blue, which is centered on southern Europe.

The lack of a Jewish-centered cluster could be either due to a lack of a common core of shared ancestry in various Jewish groups, or to a lack of sufficient resolution in the genetic markers used. There is a common thread among Jewish groups (the pink element), but it is not specific to them.

Nonetheless, we can credit the two new studies with shrinking our universe of viable hypotheses: Ashkenazic Jews don't appear to be either Khazar or converted Slavs/Germans; Iraqi Jews don't appear to have any noticeable Arab-specific ancestry; the Jewish origin of Ethiopian Jews is a fable; Ashkenazic and Sephardic Jews appear to be closely related; and so on.

UPDATE II (Jun 10):

Supplementary Table 4 (pdf) has Y chromosome data for a wide assortment of populations. I find quite interesting the lack of E-M35 chromosomes in Georgian Jews (N=62) and Azerbaijani (N=57) Jews.

UPDATE III (Jun 10):

Notice how different Russians look in the global and regional analyses. In the former, they break down into three components (N/E European dark blue, W/C/S Asian light green, north Mongoloid), while in the latter they appear to have some of the S European light blue.

This should be useful as a cautionary tale to what happens when the full range of parental populations are not present: spurious results can appear.

UPDATE IV (Jun 10):

Consider Figure 2 from the paper:

Jews form three major clusters: one between West Asia and Europe (Ashkenazim and Sephardim); one right in the middle of West Asia (Caucasus Jews and Iranian Jews), and one in the middle of Arabs (Yemenite Jews).

The authors write:
This study further uncovers genetic structure that partitions most Jewish samples into Ashkenazi–north African– Sephardi, Caucasus–Middle Eastern, and Yemenite subclusters (Fig. 2). There are several mutually compatible explanations for the observed pattern: a splintering of Jewish populations in the early Diaspora period, an underappreciated level of contact between members of each of these subclusters, and low levels of admixture with Diaspora host populations.
It is difficult to see how splintering of Jewish populations in the early Diaspora period would result in the observed pattern. In such a scenario, we would expect European Jews to form a separate cluster from Yemenite and Middle Eastern Jews, but we would not expect the differences to be in the direction of the host populations.

It is also not clear why there should be "an underappreciated level of contact" between these subclusters: the fact that they are distinct suggests that there was not much contact, otherwise we would see "intermediate individuals" between the various clusters, which is not the case. Whatever the historical intermarriage across Jewish subgroup boundaries, it must've been low: both the distinctiveness of the three clusters, and the absence of individual variation in ancestral proportions within subgroups suggests that each of the three groups did not admix heavily (recently) with either Jews from elsewhere or non-Jewish host populations.

The evidence as it stands is indicative of relative isolation of three distinct subgroups of Jews in Western Eurasia. What the original makeup of these subgroups was (the Jewish-native mix), prior to isolation, is still up for grabs.

UPDATE V (Jun 10):

It would be tempting to see an Arab-Persian distinction in the neat arraying of West Asian populations in the PCA figure of the previous update with Bedouins and Persian-Caucasian populations occupying the different ends of the spectrum. However, that would be erroneous, I think, as it omits the crucial parameter of Sub-Saharan admixture.

Here is a magnification of the West Eurasian portion of the global PCA (Figure 1 from the paper):


"South" is towards Sub-Saharans and "East" is towards East Asians. Just as the ADMIXTURE analysis suggests, Arabs deviate towards the Sub-Saharan direction. Thus, Persian-Arab distinctions are not necessarily an indication only of differences between these two groups, but also of the presence of variable Sub-Saharan admixture in Arabs.

The global ADMIXTURE indicates why this is the case: Iranians have very little "Semitic" pink and no visible Sub-Saharan admixture, while Arabs have a little Sub-Saharan admixture, which, because of the great genetic distance between Sub-Saharan Africans and West Eurasians, pulls them apart substantially from the Caucasoid cluster.

Indeed, Arabians are intermediate between Caucasoids and East Africans, while the latter are intermediate between Arabians and Sub-Saharan Africans.

Nature doi:10.1038/nature09103

The genome-wide structure of the Jewish people

Doron M. Behar et al.

Contemporary Jews comprise an aggregate of ethno-religious communities whose worldwide members identify with each other through various shared religious, historical and cultural traditions1, 2. Historical evidence suggests common origins in the Middle East, followed by migrations leading to the establishment of communities of Jews in Europe, Africa and Asia, in what is termed the Jewish Diaspora3, 4, 5. This complex demographic history imposes special challenges in attempting to address the genetic structure of the Jewish people6. Although many genetic studies have shed light on Jewish origins and on diseases prevalent among Jewish communities, including studies focusing on uniparentally and biparentally inherited markers7, 8, 9,10, 11, 12, 13, 14, 15, 16, genome-wide patterns of variation across the vast geographic span of Jewish Diaspora communities and their respective neighbours have yet to be addressed. Here we use high-density bead arrays to genotype individuals from 14 Jewish Diaspora communities and compare these patterns of genome-wide diversity with those from 69 Old World non-Jewish populations, of which 25 have not previously been reported. These samples were carefully chosen to provide comprehensive comparisons between Jewish and non-Jewish populations in the Diaspora, as well as with non-Jewish populations from the Middle East and north Africa. Principal component and structure-like analyses identify previously unrecognized genetic substructure within the Middle East. Most Jewish samples form a remarkably tight subcluster that overlies Druze and Cypriot samples but not samples from other Levantine populations or paired Diaspora host populations. In contrast, Ethiopian Jews (Beta Israel) and Indian Jews (Bene Israel and Cochini) cluster with neighbouring autochthonous populations in Ethiopia and western India, respectively, despite a clear paternal link between the Bene Israel and the Levant. These results cast light on the variegated genetic architecture of the Middle East, and trace the origins of most Jewish Diaspora communities to the Levant.

Link

March 17, 2010

Abstracts from AAPA 2010

Some abstracts from the upcoming (April 14-17) meeting of the American Association of Physical Anthropologists.

Why are pygmies small? An anthropometrical and anthropogenetical question
NOEMIE BECKER et al.
Pygmy populations from central Africa have the shortest stature worldwide. The name “pygmy” indeed comes from the Greek “pugmaios” that is a measure of length. This reduced stature has been the subject of numerous endocrinological studies and many evolutionary hypotheses have suggested that this phenotype was an adaptation to the rainforest (hot, humid and dense environment), to alimentation or due to life history trade-offs (high mortality). We have anthropometrical data for a sample of more than 1000 individuals from 7 pygmy populations and 3 neighbouring farmer populations from Gabon, Cameroon and Central African Republic. DNA samples are also available for a large number of individuals. The analysis of anthropometrical data shows that all pygmy groups have a male mean stature under 160 cm (this was used in the definition settled by Cavalli-Sforza in1986) and that a high variability exists between various pygmy populations. Verdu et al. (2009) published a genetic analysis based on neutral microsatellites on the same populations and found that pygmies present a variable admixture proportion with nonpygmies. Comparing this data with our anthropometrical data at the individual level we find a strong correlation between level of admixture and stature, thus strongly supporting the existence of a genetic component in pygmy short stature. We developed a candidate-gene approach to search for such genetic factor and will present current results on various genes located in the GH-IGF1 axis.
New evidence on headshaping from the Early Byzantine Maroneia in Thrace, Greece.
PARASKEVI TRITSAROLI

The first case of headshaping from Early Byzantine Greece was identified in 2006 at the cemetery of Maroneia (5th-6th c. A.D.). Biocultural evidence suggested the presence of a female individual culturally linked to Hunic traditions. This paper analyzes the second case of headshaping on a female skeleton uncovered in 2009 and allows for the wider discussion of the presence of a larger group related to the Huns in the city of Maroneia. The skull was examined by combining macroscopic observation and x-ray. Points of pressure are recorded in the frontal, post-coronal and occipital regions resulting in an undulation of diploic bone. Possible bilateral pressure on the frontal bone has produced an artificially narrowed frontal. The skull extends posterosuperiorly. These features suggest the application of bandaging producing circular modification. Both headshaped skulls exhibit the same type of modification. Similarly, both women were buried in a supine position, without offerings, just like the remaining 36 deceased individuals in the cemetery of Maroneia. Headshaping was unknown among Byzantine customs. On the contrary, the Huns who attacked the Balkans twice and who unsuccessfully threatened Maroneia in 411 practiced a pronounced form of circular headshaping. Consequently, biocultural evidence strongly supports the hypothesis that a group linked to the Huns was installed at the city and was assimilated into this Early Byzantine society. Future biogeochemical analysis needs to be undertaken in order to investigate migration patterns. However, headshaping reflects the cosmopolitan character of Maroneia, an important urban center in a province of the Byzantine Empire.


The genetic legacy of indigenous Caribbean peoples: Evidence from autosomal and mitochondrial data.
JADA BENN TORRES et al.

Archeological evidence suggests that autochthonous peoples began to migrate into the eastern island chain in the Caribbean, known as the Lesser Antilles, as early as 7200 years BP. Upon the arrival of Europeans, an estimated 2-4 million people lived on these islands. Within 32 years of contact, the native populations had virtually disappeared from the region due to European-introduced disease, abuse, and genocide. This lead many scholars to conclude that indigenous Caribbean people had become extinct. However, small pockets of indigenous communities have survived and are present today on several Lesser Antillean islands. Furthermore, ethnohistoric data suggests that gene flow occurred between autochthonous peoples and enslaved Africans beginning in the colonial period. In this study, we examine the genetic legacy of autochthonous Caribbean peoples from the Lesser Antilles in contemporary African- Caribbean populations as evidenced from mitochondrial data and novel autosomal data. A total of 516 individuals from eight Caribbean islands were typed for 109 ancestry informative markers and a subset of individuals were also typed for their mitochondrial haplogroup. Mitochondrial haplogroups indicate that 5% of the sample has indigenous ancestry while admixture estimates from autosomal markers show 4% indigenous ancestry. Both lines of data suggest that despite the dramatic postcontact decline in population size, indigenous Caribbean people have made notable genetic contributions to contemporary African-Caribbean populations. Furthermore, these genetic contributions vary according to the genetic system typed and across the islands.
Chuvash origins: Evidence frommtDNA Markers.
ORION M. GRAF et al.

A sample of 96 unrelated individuals from Chuvashia, Russia was sequenced for hypervariable region-I (HVR-I) of the mtDNA molecule. The Chuvash speak a Turkic language that is not mutually intelligible to other extant Turkish groups, and their genetics are distinct from Turkic-speaking Altaic groups. Some scholars have suggested that they are remnants of the Golden Horde, while others have advocated that they are the products of admixture between Turkic and Finno-Ugric speakers who came into contact during the 13th century. Earlier genetic research using autosomal DNA markers suggested a Finno-Ugric origin for the Chuvash. This study examines non-recombining DNA markers to better elucidate their origins. The majority of individuals in this sample exhibit haplogroups H (31%), U (22%), and K (11%), all representative of western and northern Europeans, but absent in Altaic or Mongolian populations. Multidimensional scaling (MDS) was used to examine distances between the Chuvash and 8 reference populations compiled from the literature. Mismatch analysis showed a unimodal distribution. Along with neutrality tests (Tajima’s D (-1.43365) p less than 0.05, Fu’s FS (-25.50518) p less than 0.001), the mismatch distribution is suggestive of an expanding population. These tests suggest that the Chuvash are not related to the Altai and Mongolia along their maternal line but supports the “Elite” hypothesis that their language was imposed by a conquering group-- leaving Chuvash mtDNA largely of Eurasian origin with a small amount of Central Asian gene flow. Their maternal markers appear to most closely resemble Finno-Ugric speakers rather than fellow Turkic speakers.
Population history and substructure of Anatolia and Turkey as evidenced by craniofacial diversity.
NORIKO SEGUCHI et al.

Anatolia, the Asian segment of Turkey, is an area of evolutionary importance for human groups who used this corridor as a bridge for migration between the Caucasus, Western Asia and Europe since Lower Paleolithic times. Historically, Anatolia has been occupied by diverse civilizations, including the Byzantine and Ottoman Empires. This study is an attempt to understand Turkish population substructure and history by examining craniofacial diversity through several temporal periods framed within a population genetic model. If the region of Anatolia has been used as a migratory corridor for peoples spanning disparate geographic areas (Balkans, Central Asia, and East Asia), then gradual craniofacial change is expected due to these migrations coupled with extensive admixture. Studies using mtDNA indicate a pre-Neolithic expansion resulting in extensive migration, while Y chromosome studies reveal haplogroup clustering and gene flow from the Caucus with less admixture from Central and East Asia. Overall, our results indicate minimal Turkish population substructure. When crania were separated into sex, our results are consistent with uniparental marker population history. Female crania show a distinctness with modern groups and are actually more similar to Neolithic European and Near Eastern populations. This would indicate a relatively stable female population in Anatolia since Neolithic times. Male crania are more heterogeneous and cluster within a larger geographic zone of Eurasia and the Near East consistent with greater male migration. There is little support for admixture from Central or East Asian groups. These results support the hypothesis for a Turkic language displacement with insignificant genetic exchange.
Genetic analyses reveal a history of serial founder effects, admixture between longseparated founding populations in Oceania, and interbreeding with archaic humans.
SARAH JOYCE, KEITH HUNLEY

Genetic anthropologists continue to debate whether human neutral genetic variation primarily reflects a continuum of demes connected by local gene flow or colonization and serial founder effects. A second unresolved issue concerns the genetic contribution of archaic species to the modern human gene pool. Some studies suggest that this contribution was substantial and that it played an important role in human adaptation. These issues remain unresolved because of inadequacies and biases in datasets, problems in statistical methodology, and the failure to recognize that different evolutionary processes may produce similar outcomes. This study redresses these limitations by analyzing gene identity within and between populations in a dataset comprised of 614 STRs assayed in 1,983 people from 99 widespread populations. Our strategy is to fit hierarchical models to these data and examine residual deviations from the models. Each model involves nesting smaller units such as populations into larger units such as continental regions. It is possible to restate many of these models as either expansions or reductions of each other and thereby identify aspects of population structure that have had a major impact on the overall pattern of diversity. The strong fit of a model estimated using the Neighbor Joining algorithm indicates that human genetic diversity primarily reflects a history of successive founder effects associated with our exodus from Africa, not a continuum of demes connected by gene flow. Residual deviations from the model suggest: 1) the genomes of Oceanic peoples are the product of two independent waves of migration to the region and admixture, and 2) genetic exchange occurred between archaic and modern humans after their initial divergence.
Correlations between genetic ancestry and superficial traits indicate substantial admixture stratification in Brazil.
LAUREL N. PEARSON et al.

Brazil is one of the most admixed countries in the world. How this admixture affected the distribution of genetic ancestry across Brazilian ethnic (“Color”) groups is a fundamental question which to date has only received minimal attention. In an effort to systematically study variation in genetic ancestry in Brazil, we collected DNA and various phenotypic measures from 596 volunteers in Brasilia, Brazil. Participants were asked to provide their self-described “Color” as defined by the Brazilian census (Preta/Black, Parda/Brown, Branca/White, Indigena/Indigenous, Amarela/Yellow). Phenotype data was collected from each subject including hair texture, highresolution eye photographs, skin and hair color by reflectometry, and three-dimensional facial photographs. To estimate genomic ancestry, DNA from each participant was genotyped using 176 ancestry informative markers (AIMs), autosomal SNPs with large frequency differences between parental populations known to contribute to Brazilian admixture (West African, East Asian, European and Indigenous American). Although genomic ancestry shows significant overlap across “Color” groups, there are highly significant differences in average proportional ancestry. Additionally, analyses comparing trait values and genetic ancestry show significant correlations consistent with expectations of populations stratified with respect to genetic ancestry. Ethnographic research indicates that designations of “Color” are fluid and largely based on physical traits as opposed to known ancestry. This likely contributes to the observed ancestry overlap between ethnic groups and the strong association between phenotype and group. This study emphasizes the importance of genetic marker based estimates of ancestry as well as objective assessment of superficial traits in understanding the admixture process.
Geographic structure of genetic variation in North America: Population fissions and European admixture.
KARI BRITT SCHROEDER et al.

A satisfactory understanding of how modern Native North America populations are biologically related to each other requires increased sampling of populations and/or genetic markers and testing of the fit of different models of population structure. To this end, we combine new autosomal microsatellite data from Native North American populations with previously published data. Using J.C. Long’s Generalized Hierarchical Modeling software, we evaluate the fit of different trees to the data. Although we observe a correlation between population pairwise genetic and geographic distances, as expected with a long-term process of isolation by distance, we show that this correlation likely results from geographically-structured population fissions. This pattern could result from the initial peopling of North America or from a later process. The magnitude of European ancestry in the sampled populations, as estimated with the software structure, varies drastically among geographic regions, and may limit our ability to use modern genetic variation to investigate Native North American prehistory.This study was funded by the Wenner-Gren Foundation for Anthropological Research, grant number 7580 to K.B. Schroeder and D.G. Smith, and by the National Science Foundation, grant BCS- 0422144 to R.S. Malhi, B.M. Kemp, and D.G. Smith.
Coalescent modeling of Yakut origins points to small founding population based on mtDNA variation.
MARK ZLOJUTRO et al.

Based on archaeological and ethnohistorical evidence, the Yakut people of northeastern Siberia are considered to be descendants of ancient Turkic-speaking populations once living in the distant Altai- Sayan region on the Russian- Mongolian border. The results of phylogeographic studies on Siberian mtDNA variation have been generally concordant with a southern Yakut origin, although the timing of the northern migration, the size of the founder group and the degree of genetic admixture with non-Turkic Siberian populations are less apparent. In an effort to better understand Yakut origins, we modeled 25 demographic scenarios, including parameters such as effective population size, growth rate and gene flow, and tested by coalescent simulation whether any are consistent with the patterns of mtDNA diversity observed in present-day Yakuts. The models consist of either two simulated demes that represent Yakuts and a South Siberian ancestral population, or three demes that also include a regional Northeast Siberian population that served as a source of localized gene flow into the Yakut deme. The model that produced the best fit to the observed data defined a founder group with an effective female population size of only 150 individuals, migrating northwards approximately 1,000 years BP and undergoing significant admixture with neighboring populations in Northeastern Siberia. These simulation results indicate a pronounced founder effect that was primarily kin-structured and reconcile reported discrepancies between Yakut mtDNA and Y chromosome diversity levels.
The role of selection-nominated candidate genes in determining Indigenous American skin pigmentation.
ELLEN E QUILLEN et al.
World-wide variability in skin pigmentation has been a subject of anthropological inquiry from the beginning of our discipline. Recent genomic studies indicate that skin pigmentation is one of the most rapidly evolving phenotypes in many human populations and that genes underlying skin pigmentation have been subject to some of the most extreme selective pressures of any genes in the human genome. Unlike previous research, this study both identifies pigmentation genes that have undergone selection in Indigenous American populations and tests the influences of these genes on skin color in admixed individuals. 906,600 single nucleotide polymorphisms (SNPs) were surveyed for signatures of selection in indigenous populations from Central and South America. Evidence of selection was identified by comparison to HapMap Phase I populations using reduction in heterozygosity (lnRH), Locus- Specific Branch Length (LSBL), Tajima’s D, and haplotype block structure. In the 12 pigmentation candidate genes that show the strongest evidence of selection (ADAM17, POMC, AP3B1, OPRM1, SILV, OCA2/HERC, PLDN, MYO5A, RAB27A, CYP1A2, ATRN, and ASIP), 48 SNPs selected to represent the overall variation in the selection nominated candidate genes were genotyped in individuals of admixed Indigenous American and European ancestry. These SNPs show substantial allele frequency differences between the parental populations. Using admixture based regression model analyses, genes contributing to darker skin pigmentation in Indigenous Americans were found. This study not only identified skin pigmentation genes contributing to skin color variation in previously understudied Indigenous American populations, it validated the usefulness of using population genetic tests of selection to identify functional genes. This study was generously funded by the National Science Foundation Dissertation Improvement Grant 0925976