March 31, 2006
Cerebral cortex and IQ
Nature 440, 676-679 (30 March 2006)
Intellectual ability and cortical development in children and adolescents
P. Shaw et al.
Children who are adept at any one of the three academic 'R's (reading, writing and arithmetic) tend to be good at the others, and grow into adults who are similarly skilled at diverse intellectually demanding activities1, 2, 3. Determining the neuroanatomical correlates of this relatively stable individual trait of general intelligence has proved difficult, particularly in the rapidly developing brains of children and adolescents. Here we demonstrate that the trajectory of change in the thickness of the cerebral cortex, rather than cortical thickness itself, is most closely related to level of intelligence. Using a longitudinal design, we find a marked developmental shift from a predominantly negative correlation between intelligence and cortical thickness in early childhood to a positive correlation in late childhood and beyond. Additionally, level of intelligence is associated with the trajectory of cortical development, primarily in frontal regions implicated in the maturation of intelligent activity4, 5. More intelligent children demonstrate a particularly plastic cortex, with an initial accelerated and prolonged phase of cortical increase, which yields to equally vigorous cortical thinning by early adolescence. This study indicates that the neuroanatomical expression of intelligence in children is dynamic.
Link
March 30, 2006
The FHM Top-16 composite woman
March 29, 2006
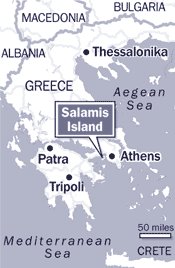
Palace of Telamonian Aias found in Salamis
Palace of Homer's hero rises out of the myths (The Times)
ARCHAEOLOGISTS claim to have unearthed the remains of the 3,500-year-old palace of Ajax, the warrior-king who according to Homer’s Iliad was one of the most revered fighters in the Trojan War.
Classicists hailed the discovery, made on a small Greek island, as evidence that the myths recounted by Homer in his epic poem were based on historical fact.
The ruins include a large palace, measuring about 750sq m (8,000sq ft), and believed to have been at least four storeys high with more than thirty rooms.
Yannos Lolos, the Greek archaeologist who made the discovery, said he was certain that he had come across the home of the Aiacid dynasty, a legendary line of kings mentioned in the Iliad and the Classical Greek tragedies. One of the kings, Ajax (or Aias), was described by Homer as a formidable fighter who, at one point in the Trojan campaign, held off the Trojans almost singlehandedly while his fellow Greek Achilles sulked in his tent because his slave-girl had been taken away from him.
The city of Troy is believed to have fallen about 1180BC — at about the same time, according to Mr Lolos, that the palace he has discovered was abandoned and left to crumble. Ajax, therefore, would have been the last king to have lived there before setting off on the ten-year Trojan expedition.
“This is one of the few cases in which a Mycenaean-era palace can be almost certainly attributed to a Homeric hero,” Mr Lolos said.
Fellow archaeologists said that they believed that the ruins were indeed those of a Mycenaean palace. Curtis Runnels, Professor of Archaeology at Boston University, said: “Mr Lolos has really delivered the goods.”
The Mycenaean ruins appear to be at the site where Homer records a fleet of ships setting out to take part in the war on Troy. The Iliad is believed to portray conditions at the close of the dominance of Mycenae, the prime Greek power of the second millennium BC.
The ruins have been excavated over the past five years at a site near the village of Kanakia on the island of Salamis, a few miles off the coast of Athens.
The palace was built in the style of those of the period, including the vast acropolis at Mycenae.
“The complex was found beneath a virgin tract of pine woods on two heights by the coast,” Mr Lolos said. “All the finds so far corroborate what we see in the Homeric epics.”
Homer compares Ajax to a wall and describes him carrying a shield made of seven layers of thick oxhide. Unlike other heroes, he fights without the aid of deities or the supernatural. According to Sophocles, who wrote 800 years after the Trojan War, Ajax committed suicide after the fall of Troy without seeing his homeland again.
Several relics of oriental and Cypriot origin were found at the site at Kanakia, such as bronze armour strips stamped with the emblem of Pharaoh Rameses II of Egypt, indicating trade or possible war in the 13th century BC.
Salamis became famous as the site of a sea battle in 480BC in which the Greek navies destroyed the invasion fleet of the Persian king Xerxes and put paid to the Persian threat.
The other main site where archaeologists claim to have discovered relics of places recounted in the Iliad is at the castle of Pylos in southeastern Greece, believed to be the home of King Nestor.
March 28, 2006
Richard Lynn's speculations
Lynn's speculations implicitly assume that IQ differences are of deep evolutionary origin. In other words, he assumes that Caucasoid-Mongoloid-Negroid aptitudes, as well as subracial cognitive distinctions (e.g., between Northcentral Europeans and Southeastern Europeans and Arctic vs. Far Eastern Mongoloids) date to the prehistoric period and accompanied racial differentiation.
Of course, this assumption is entirely unfounded. Indeed, increasingly, we are realizing that recent human evolutionary change, in post-Neolithic times was rapid, and the characteristics of populations were not already fixed (as the evolutionary psychologists hold) at the onset of the Neolithic, when racial differentiation was already in place.
But, the real problem is that there are only about 100 years of IQ data for some human populations and data of good quality (e.g., measured with culture-fair instruments) are at most 1-2 generations old. At the same time, it has been amply demonstrated that human IQ has been rising rapidly in several human populations even over the short time span for which IQ data exist, the so-called Flynn effect.
We thus know that (a) IQ is volatile, and can change rapidly, and (b) we have data that spans only perhaps 2% of human history.
The combination of these two factors renders any extrapolations from recent IQ data into the Stone Age or even a few centuries ago entirely unusable and untrustworthy. A good analogy would be someone's attempt to estimate the price of the IBM stock in 1935 by taking into account its value in the last year.
Richard Lynn must be commended for collecting and compiling such a volume of IQ data, but it's time to move beyond an early-20th century statistical understanding of human cognitive differences based on the reification of g and tackle the really hard problems of (a) figuring out whether individual racial ancestry predicts IQ, and (b) identifying some of the genes contributing to intelligence.
As I explain here, I see little hope of (b) occurring to any significant degree any time soon, but determining the racial (ancestral) contribution to IQ is wholly feasible. Let's hope that the race/IQ enthusiasts take up the challenge.
The changing shape of infant heads
The normal head shape of American infants has changed from mildly dolichocephalic to mildly brachycephalic. Although normalcy is redefined, societal or parental expectations do not change immediately. Some parents become concerned, perceiving their infant’s head shape as abnormal. Although some parents may respond to reassurance, others search for solutions, such as head-molding helmets or more invasive options such as surgery.Advances in Neonatal Care
Volume 5, Issue 6 , December 2005, Pages 329-340
Impacting Infant Head Shapes
Pat Hummel RNC, MA, NNP, PNP et al.
Abstract
Infant sleep position impacts the development of head shape. Changes in infant sleep position, specifically the movement toward supine sleep, have led to a redefinition of normal head shape for infants in the United States. Historically, a dolichocephalic (elongated) head shape was the norm. Currently the norm has changed to a more brachycephalic (shorter and broader) shape. Since the American Academy of Pediatrics’ Back to Sleep Campaign, the incidence of positional plagiocephaly has increased dramatically with a concurrent rise in the incidence of torticollis.
Infants who require newborn intensive care, particularly premature infants, are more prone to positional plagiocephaly and dolichocephaly. Both can be prevented or minimized by proper positioning. The infant with an abnormal head shape requires careful evaluation; treatment varies according to the etiology. Craniosynostosis, a less common but pathological etiology for plagiocephaly, should be considered in the diagnostic process. Successful treatment of positional plagiocephaly and dolichocephaly includes systematic positioning changes to overcome the mechanical forces of repetitive positioning, physical and/or occupational therapy to treat underlying muscle or developmental challenges, and in some cases, molding helmet therapy.
Link
Excerpt:
With the continued success of the “Back to Sleep Campaign,” infants will have aThe Journal of Pediatrics
more rounded head shape than cultures that previously put their infants to sleep
on their stomachs. The current normative CI is 86% to 88%, and it is relatively
rare to encounter a dolichocephalic infant in cultures whose infants sleep
supine.
Volume 146, Issue 2 , February 2005, Pages 253-257
Deformational brachycephaly in supine-sleeping infants
John M. Graham, Jr. MD, ScD
Objectives
Medical dictionaries and anthropologic sources define brachycephaly as a cranial index (CI = width divided by length × 100%) greater than 81%. We examine the impact of supine sleeping on CI and compare orthotic treatment with repositioning.
Study design
We compared the effect of repositioning versus helmet therapy on CI in 193 infants referred for abnormal head shape.
Results
Eighty percent of the infants had a pretreatment CI > 81%. Their initial mean CI at mean age 5.3 months was 89%, and after treatment, their mean CI was 87% (±2 SE = 0.9%) at mean age 9.0 months. For 92 infants with an initial CI at or above 90%, their initial mean CI of 96.1% was reduced to a mean of 91.9%.
Conclusions
Post-treatment CI was 86% to 88%, CI in neonates delivered by cesarean section was 80%, and CI in supine-sleeping Asian children was 85% to 91%, versus 78% to 83% for prone-sleeping American children. Repositioning was less effective than cranial orthotic therapy in correcting severe brachycephaly. We recommend varying the head position when putting infants to sleep.
Link
March 26, 2006
Heritability of human craniometric traits
Am J Phys Anthropol. 2006 Mar 21; [Epub ahead of print]
Maximum likelihood estimation of human craniometric heritabilities.
Carson EA.
This study presents univariate narrow-sense heritability estimates for 33 common craniometric dimensions, calculated using the maximum likelihood variance components method on a skeletal sample of 298 pedigreed individuals from Hallstatt, Austria. Quantitative genetic studies that use skeletal cranial measurements as a basis for inferring microevolutionary processes in human populations usually employ heritability estimates to represent the genetic variance of the population. The heritabilities used are often problematic: most come from studies of living humans, and/or they were calculated using statistical techniques or assumptions violated by human groups. Most bilateral breadth measures in the current study show low heritability estimates, while cranial length and height measures have heritability values ranging between 0.102-0.729. There appear to be differences between the heritabilities calculated from crania and those from anthropometric studies of living humans, suggesting that the use of the latter in quantitative genetic models of skeletal data may be inappropriate. The univariate skeletal heritability estimates seem to group into distinct regions of the cranium, based on their relative values. The most salient group of measurements is for the midfacial/orbital region, with a number of measures showing heritabilities less than 0.30. Several possible reasons behind this pattern are examined. Given the fact that heritabilities calculated on one population should not be applied to others, suggestions are made for the use of the data presented.
Link
Harvard working paper on Israeli lobby
Indeed, the mere existence of the Lobby suggests that unconditional support for Israel is not in the American national interest. If it was, one would not need an organized special interest group to bring it about. But because Israel is a strategic and moral liability, it takes relentless political pressure to keep U.S. support intact.
Faculty Working Paper
The Israel Lobby and U.S. Foreign Policy
By John J. Mearsheimer and Stephen Walt
Working Paper Number:RWP06-011
Abstract
In this paper, John J. Mearsheimer of the University of Chicago's Department of Political Science and Stephen M.Walt of Harvard University's Kennedy School of Government contend that the centerpiece of U.S. Middle East policy is its intimate relationship with Israel. The authors argue that although often justified as reflecting shared strategic interests or compelling moral imperatives, the U.S. commitment to Israel is due primarily to the activities of the “Israel Lobby." This paper goes on to describe the various activities that pro-Israel groups have undertaken in order to shift U.S. foreign policy in a pro-Israel direction.
Link (free access)
March 23, 2006
Body size and proportions of Tyrolean Ice Man
Body size, body proportions, and mobility in the Tyrolean "Iceman"
Ruff CB et al.
Body mass and structural properties of the femoral and tibial midshafts of the "Iceman," a late Neolithic (5200BP) mummy found in the Tyrolean Alps, are determined from computed tomographic scans of his body, and compared with those of a sample of 139 males spanning the European early Upper Paleolithic through the Bronze Age. Two methods, based on femoral head breadth and estimated stature/bi-iliac (pelvic) breath, yield identical body-mass estimates of 61kg for the Iceman. In combination with his estimated stature of 158cm, this indicates a short but relatively wide or stocky body compared to our total sample. His femur is about average in strength compared to our late Neolithic (Eneolithic) males, but his tibia is well above average. His femur also shows adaptations for his relatively broad body (mediolateral strengthening), while his tibia shows adaptations for high mobility over rough terrain (anteroposterior strengthening). In many respects, his tibia more closely resembles those of European Mesolithic rather than Neolithic males, which may reflect a more mobile lifestyle than was characteristic of most Neolithic males, perhaps related to a pastoral subsistence strategy. There are indications that mobility in general declined between the European Mesolithic and late Neolithic, and that body size and shape may have become more variable throughout the continent following the Upper Paleolithic.
Link
March 22, 2006
Personal ornaments reveal ethno-linguistic diversity of Aurignacian Europe
Aurignacian ethno-linguistic geography of Europe revealed by personal ornaments
Marian Vanhaeren et al.
Abstract
Our knowledge of the migration routes of the first anatomically modern populations colonising the European territory at the beginning of the Upper Palaeolithic, of their degree of biological, linguistic, and cultural diversity, and of the nature of their contacts with local Neanderthals, is still vague. Ethnographic studies indicate that of the different components of the material culture that survive in the archaeological record, personal ornaments are among those that best reflect the ethno-linguistic diversity of human groups. The ethnic dimension of beadwork is conveyed through the use of distinct bead types as well as by particular combinations and arrangements on the body of bead types shared with one or more neighbouring groups. One would expect these variants to leave detectable traces in the archaeological record. To explore the potential of this approach, we recorded the occurrence of 157 bead types at 98 European Aurignacian sites. Seriation, correspondence, and GIS analyses of this database identify a definite cline sweeping counter-clockwise from the Northern Plains to the Eastern Alps via Western and Southern Europe through fourteen geographically cohesive sets of sites. The sets most distant from each other include Aurignacian sites from the Rhône valley, Italy, Greece and Austria on the one hand, and sites from Northern Europe, on the other. These two macro-sets do not share any bead types. Both are characterised by particular bead types and share personal ornaments with the intermediate macro-set, composed of sites from Western France, Spain, and Southern France. We argue that this pattern, which is not explained by chronological differences between sites or by differences in raw material availability, reflects the ethnolinguistic diversity of the earliest Upper Palaeolithic populations of Europe.
Link
March 21, 2006
The geography of European phenotypical variation
If your country is not listed here, and you know of a good source of facial athlete pictures, e.g., the website of soccer team(s), drop me a line. I won't promise to do all countries, but I will return from time to time to this map to fill in some of the gaps. Also, note that 10 pictures is the bare minimum, although I would prefer a source of pictures with at lesat 16 native athletes, which is the number used for most of the composites in the map.
March 20, 2006
A few good sperm
Update: A reader alerts me that 60 minutes has also done a story on the same subject which you can watch online here.
See also the DonorSiblingRegistry.com registry list with descriptions.
March 18, 2006
Skeletofacial morphology and facial attractiveness
The Angle Orthodontist: Vol. 76, No. 2, pp. 204–210.
Skeletofacial Morphology of Attractive and Nonattractive Faces
Stamatia Matoula Hans Pancherz
ABSTRACT
The aim of this study was to answer the question: Is facial beauty related to specific skeletofacial morphology? Thirty attractive (25 females, 5 males) and 32 nonattractive (11 females, 21 males) subjects were compared. Facial attractiveness was assessed by the aid of en-face facial photographs. Skeletofacial morphology was determined using lateral head films. The radiographs were analyzed with respect to sagittal and vertical jaw relationships, facial height, profile convexity, and lip position. The relationship between the skeletofacial variables and “divine” facial proportions was evaluated with a facial disproportion index in the transverse and vertical plane. When comparing attractive with nonattractive females, the attractive females had a larger ANB angle and Wits-appraisal (P < .05 and P < .001, respectively), the soft tissue profile was more convex (P < .01), and the distances of the upper and lower lips to the “Esthetic Line” (E-line) were smaller (P < .01). When comparing nonattractive females with nonattractive males, the males had a larger Wits-appraisal (P < .01), the soft tissue profile was more convex (P < .01), and the distances of the upper and lower lips to the E-line were smaller (P < .01). A significant correlation (P < .05) between the skeletofacial variables and the transverse and vertical facial disproportion indices was found only for the ML/NL angle (transverse: r = −0.73, and vertical: r = 0.68) and for the posterior facial height (transverse: r = 0.80). It could be concluded that facial beauty in frontal view is related only to a minor degree to specific skeletofacial morphology in lateral view. Link
March 16, 2006
mtDNA distribution in European Russian populations
Russians, who occupy an immense area comparable by its size with the whole Western Europe, are characterized by substantial anthropological and dialectic diversity. Development of the independent Russian nation began in the 9th century A.D., as a result of the integration of Eastern Slavic tribes within the frames of the Old Russian State, and assimilation of Finno-Ugric, Baltic, and Turkic ethnic groups [1]. Subsequent integration and migration processes, as well as an enlargement of the territory of residence, introduced new ethnic elements into the Ancient Russian ethnic group. Numerous investigations of anthropological traits and classical genetic markers provided the idea on the complex genetic structure of Russians, and described the regional differences between different groups, caused by the interaction of newly arrived Slavic tribes with aboriginal populations. Until recently, mitochondrial DNA (mtDNA) diversity of Russians was studied only in some individual populations. At present, this problem attracts growing attention.Characteristics of the eastern European complex:
...
Most part of these mitotypes (from 80 to 85%) mark the main European haplogroups, H, I, J, K, T, U, V, W, and X (Table 2). Five of these haplogroups, H, U, J, T, and K, which are most prevalent among the European populations, account for 70 to 78% of the total diversity. In general, haplogroup frequency distribution patterns described in Russian populations were similar to those in European populations [5, 10–14, 16]. However, it should be noted that rather high frequencies (14 to 19.5%) of the mitotypes, not attributed to the haplogoups mentioned, were observed in the Russian populations examined (in Table 2, these mitotypes are defined as “others”). This mitotype group may contain Asian and some minor European haplogroups, the members of macrohaplogroup N.
...
Finally, the most “specific” Tambov oblast is located at the border between the Eastern European and the steppe complex, the anthropological specificity of which was repeatedly mentioned in a number of studies [1, 20].
...
Thus, our results point to closeness of the populations from three oblasts (Ivanovo, Ryazan’, and Vologda) to the average regional type, as well as to a substantial difference of the representatives of the two southern oblasts, Orel and Tambov, from this average type. It seems likely that this pattern reflects subdivision of the Russian ethnic area into zones determined by the patterns of the relationships between the Slavs and the local ethnic groups. This subdivision was first described by Rychkov et al. in their study of anthropological and classical genetic markers [8, 21]. According to the view of these authors, this subdivision reflected the movements of the annalistic Slavs from the west eastward. Ivanovo, Ryzan, and Vologda oblasts, defined in the present study as “middle Russian,” are located within the most typical of Russian population “zone of panmixia,” i.e., the region where the forward movement of ancient Slavs proper was replaced by intensive assimilation of the local (in this case, probably, Finno-Ugric) population [8, 21]. At the same time, “genetically specific” populations (Orlov and Tambov) are territorially close to the “cores” of the greatest anthropological specificity of the Russian population, which, according to Rychkov et al., traces back to the annalistic Slavic tribes [8]. Inclusion of more Russian populations in further analysis will probably enable more precise characterization of the observed patterns.
Characteristics: Darkening of the color of the hair and eyes distinguishes this from the White Sea-Baltic group. In the territory of the eastern European plain have been isolated several local combinations, that are differentiated, in essence, by variations in the cephalic index, and by the width and proportions of the face.
Description of the steppe complex:
Steppe Complex. Unfortunately, the population of the Steppe zone has been rather poorly studied by anthropologists. Therefore, the description of the Steppe complex is based only on scanty data regarding some Russian groups inhabiting the midflows of the Dona and Khoper rivers, and a few Turkic-speaking groups dwelling on the right banks of the Volga, most importantly the Mishars. The populations which form this complex are distinguished by mesocephaly, relatively small absolute dimensions of the head and face, partial depigmentation, intermediate development of tretiarry hair cover, intermediate horizontal facial profile and relatively strong nasal protrusion.See also Hair-color of the Proto-Slavs, Hair-color of the Proto-Slavs (revisited).
Russian Journal of Genetics Volume 41, Number 9
Mitochondrial DNA Polymorphism in Russian Population form Five Oblasts of the European Part of Russia
I. Yu. Morozova et al.
Abstract New data on mitochondrial DNA polymorphism among Russian population from five oblasts, located within the main ethnic area of Russians, specifically, Ryazan' oblast, Ivanovo oblast, Vologda oblast, Orel oblast, and Tambov oblast (N = 177) are presented. RFLP analysis of the mtDNA coding region showed that most of the mtDNA diversity in the populations examined could be described by main European haplogroups H, U, T, J, K, I, V, W, and X. Haplogroup frequency distribution patterns in the populations of interest were analyzed in comparison with the European and Uralic populations. Based on the haplogroup frequencies, the indices of intraethnic population diversity, Wright's F st statistics, and the values of squared deviation from the mean, as well as genetic distances between Russians and European and Uralic populations were estimated. Analysis of these indices along with the anthropological data provided identification of a number of regional groups within the populations examined, which could either result from the interaction of ancient Slavs with different non-Slavic tribes, or could be caused by the ethnic heterogeneity of the ancient Slavs themselves.
Link
March 15, 2006
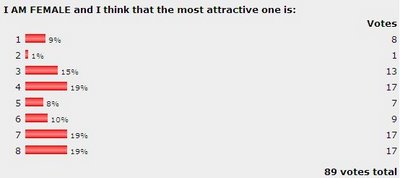
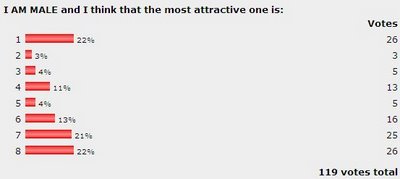
Who is the most attractive? (result)
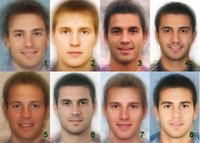
Feel free to invite your friends or to promote this in your blog. The greater the sample size, the better. And, don't ask me for the answers soon, I want to see a really big sample before giving out the answer! You can of course use the comments section to speculate as to the identity of the contestants.
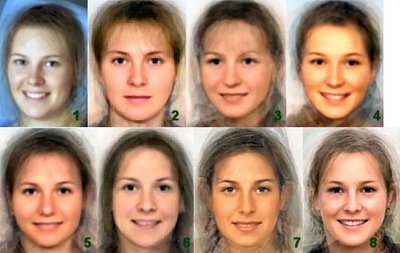
Click on the picture for the original at a higher resolution.
With this post, I want to study (a) what type is considered most attractive by readers of the blog, and (b) to see whether there is agreement in male vs. female ratings of attractiveness.
Results:
March 12, 2006
Who is who?
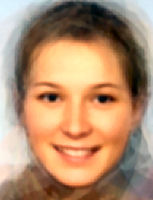
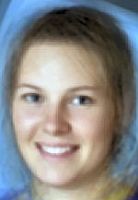
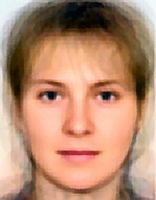
Alphabetically, the above women belong to these 8 groups: Austrian, Balkan Slav, British, Czech, German, Polish, Russian, Swedish. But, who is who?
Comment or trackback away!
Update #1 Haloscan comment posting seems to be down at the moment, but try again later.
Comments Working again.
Keep those guesses coming. I'll reveal the answers either when someone scores a perfect 8/8 or by 9pm GMT on Monday.
UPDATE #2 The answer and some extras here.
UPDATE #3 Some statistics:
- Classification accuracy (N=18) was 29% (random choice would have 12.5% accuracy).
- Slav vs. Germanic accuracy was 74% (random choice would have 50% accuracy).
- Britons (67%), Balkan Slavs (61%), followed by Swedes (39%) had above-average classification accuracy.
- The Germanic groups were identified as Germanic with probability: British (89%), Austrian (83%), Swedish (78%), German (50%)
- The Slavic groups were identified as Slavic with probability: Balkan Slav (78%), Russians, Poles, and Czechs (72%)
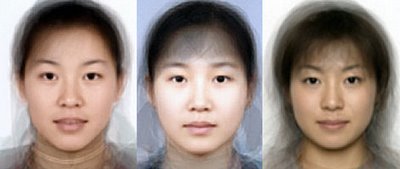
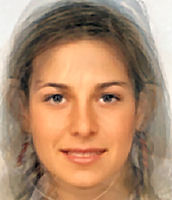
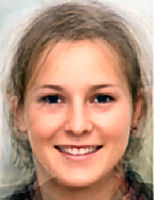
Finally, here are the composite Germanic and Slavic pictures.
Ethnic Composite Showdown (part V)
Migration and evolution
One promising possibility is the old chestnut question about why the personalities of today's Scandinavians don't seem all that much like their Viking ancestors. It's possible that the aggressive Viking personality was a winning hand in Darwinian terms back in the Dark Ages when other Europeans didn't have adequate defenses against Viking predations. But by the Middle Ages, Europeans had evolved the security system called feudalism and the Vikings were forced to stay home. The most aggressive then tended to slaughter each other in the kind of honor feuds described in Icelandic sagas, while the milder sorts kept their heads down, survived, and multiplied. (On the other hand, I'm rather skeptical of the notion that one group is more or less violent than another group, since humans seem to have a lot of capacity for violence. A nonviolent group probably wouldn't have survived. The obvious differences are in tendencies toward organized and disorganized violence.)
I was planning to compose a longer entry on the importance of migration in human evolution, but I don't think I will have the time to finish it (with all the morphing that I've been doing lately :) ) But, here is the gist of the idea:
Often, when we think of evolution, we think of it as being driven by differences in genetic fitness of different phenotypes, which correspond to differences in genetic fitness of individual "selfish" genes. Thus, we think of evolution if one phenotype or gene is more successful than another, and hence produces more of its copies in the next generation.
However, evolution can still occur even if all phenotypes and genes are equally successful in reproducing themselves. This is due to the fact that human populations are geographically and socially structured.
If in a given environment E, phenotype A is superior to phenotype B, then we would expect (over time) to see more of phenotype A and less of phenotype B. That is the essence of selection.
But, in the words of Epicurus "necessity is evil, but there is no reason to live under necessity".
In other words, humans -being the adaptible creatures that we are- often don't stick around in adverse environment E. Rather, quite often, the members of the disadvantaged phenotype B will find a new niche for themselves, either a new social niche, or -by migration- a new geographical one.
This type of population partition is -I believe- an important feature of human evolution, because of our enormous capacity to foresee the future and plan ahead.
Let's take Sailer's Vikings who inspired this blog entry. The Vikings stand at the middle of a long history of migrations of Germanic peoples out of northern Europe. Importantly, the people who left northern Europe (e.g., the Visigoths , the Varangians, the Vandals, etc.) represented the more active and warlike elements in the local population. They were the ones who when faced with poverty, climatic change, or population overflow, decided to find a new home by migration, war, and conquest. Consequently, modern Scandinavians are descended from the leftovers of those great movements. So, it should not come as a surprise that they are so passive, peace-loving and unlike the medieval Scandinavians who terrorized Europe.
Even earlier events in human evolution can be explained by looking at migration processes. For example, Polynesians and Ethiopians are both descended from the same African ancestors of the Upper Paleolithic. But, whereas the Ethiopians stayed close to the human cradle, the Polynesians are descended from the people who moved across Eurasia in a few thousand years and then made an almost crazy journey of colonization with primitive boats across the vast expanses of the Pacific Ocean. So, we should be willing to concede that some of the differences between the two peoples are due not only to long separate evolution, but also to the different kinds of people that would end up in the middle of the Pacific vs. the ones who would remain in the Horn of Africa.
The recent Americans are of course another classical example of the same process. European Americans differ from Europeans because they evolved (biologically and culturally) separately from their European ancestors, but they are also different because they are descended from a particular kind of European, who, being uncomfortable at home, decided to make a fresh start in the New World.
The destinations of migration processes tend to accumulate two kinds of individuals:
The adventurer type is the one who perceives opportunity and seizes it. The early Neolithic colonization, or the early American colonization is probably attributed to adventurer types.
The outcast type is the one who is uncompetitive and seeks a new homeland where competition is less fierce. The later American colonization, and probably the colonization of the ecologically extreme regions of the world was (is?) effected chiefly by outcast types.
(More later...)
Ethnic Composite Showdown (part IV)
March 11, 2006
Ethnic Composite Showdown (part III)
Disease avoidance and intergroup attitudes
Disease avoidance and ethnocentrism: the effects of disease vulnerability and disgust sensitivity on intergroup attitudes
Carlos David Navarrete
Abstract
Extending a model relating xenophobia to disease avoidance [Faulkner, J., Schaller, M., Park, J. H., & Duncan, L. A. (2004). Evolved disease-avoidance mechanisms and contemporary xenophobic attitudes. Group Processes & Intergroup Relations, 7(4), 333–353.], we argue that both inter- and intragroup attitudes can be understood in terms of the costs and benefits of interacting with the in-group versus out-groups. In ancestral environments, interaction with members of the in-group will generally have posed less risk of disease transmission than interaction with members of an out-group, as individuals will have possessed antibodies to many of the pathogens present in the former, in contrast to those prevalent among the latter. Moreover, because coalitions are more likely among in-group members, the in-group would have been a potential source of aid in the event of debilitating illness. We conducted two online studies exploring the relationship between disease threat and intergroup attitudes. Study 1 found that ethnocentric attitudes increase as a function of perceived disease vulnerability. Study 2 found that in-group attraction increases as a function of disgust sensitivity, both when measured as an individual difference variable and when experimentally primed. We discuss these results with attention to the relationships among disease salience, out-group negativity, and in-group attraction.
Link
March 09, 2006
Ethnic Composite Showdown
Women can infer men's characteristics by listening to their voices
Women use voice parameters to assess men's characteristics.
Bruckert L, Lienard JS, Lacroix A, Kreutzer M, Leboucher G.
The purpose of this study was: (i) to provide additional evidence regarding the existence of human voice parameters, which could be reliable indicators of a speaker's physical characteristics and (ii) to examine the ability of listeners to judge voice pleasantness and a speaker's characteristics from speech samples. We recorded 26 men enunciating five vowels. Voices were played to 102 female judges who were asked to assess vocal attractiveness and speakers' age, height and weight. Statistical analyses were used to determine: (i) which physical component predicted which vocal component and (ii) which vocal component predicted which judgment. We found that men with low-frequency formants and small formant dispersion tended to be older, taller and tended to have a high level of testosterone. Female listeners were consistent in their pleasantness judgment and in their height, weight and age estimates. Pleasantness judgments were based mainly on intonation. Female listeners were able to correctly estimate age by using formant components. They were able to estimate weight but we could not explain which acoustic parameters they used. However, female listeners were not able to estimate height, possibly because they used intonation incorrectly. Our study confirms that in all mammal species examined thus far, including humans, formant components can provide a relatively accurate indication of a vocalizing individual's characteristics. Human listeners have the necessary information at their disposal; however, they do not necessarily use it.
Link
March 07, 2006
Recent positive selection in humans
The findings are reported in PLoS Biology (free text). Nicholas Wade also covers the study in the New York Times:
Providing the strongest evidence yet that humans are still evolving, researchers have detected some 700 regions of the human genome where genes appear to have been reshaped by natural selection, a principal force of evolution, within the last 5,000 to 15,000 years.From the new paper:
The genes that show this evolutionary change include some responsible for the senses of taste and smell, digestion, bone structure, skin color and brain function.
Many of these instances of selection may reflect the pressures that came to bear as people abandoned their hunting and gathering way of life for settlement and agriculture, a transition well under way in Europe and East Asia some 5,000 years ago.
A fully rigorous estimation of the ages of the candidate sweeps is difficult with the current data. However, making the simplistic assumption of a star-shaped genealogy for the favored haplotypes and assuming a generation time of 25 y, suggests average ages of ≍6,600 years and ≍10,800 years in the non-African, and African populations, respectively (Materials and Methods).
...
Some of the strongest signals of recent selection appear in various types of genes related to morphology. For example, four genes involved in skin pigmentation show clear evidence of selection in Europeans (OCA2, MYO5A, DTNBP1, TYRP1). All four genes are associated with Mendelian disorders that cause lighter pigmentation or albinism, and all are in different genomic locations, indicating the action of separate selective events. One of these genes, OCA2, is associated with the third longest haplotype on a high frequency SNP anywhere in the genome for Europeans. A fifth gene, SLC24A5, has recently been shown by another group to impact skin pigmentation and to have a derived, selected allele near fixation in Europeans [45]. Though iHS has reduced power for alleles near fixation, SNPs near this gene also show strong iHS signals in Europeans (Table S2).
Various genes involved in skeletal development have also been targets of recent selection. Three related proteins involved in bone morphogenesis show signals of selection in Europeans (BMP3 and BMPR2) and in East Asians (BMP5). In addition, GDF5, a gene in which mutations cause skeletal malformations, shows strong signals of selection in both Europeans and East Asians. Other morphological features also appear to be targets of selection, including hair formation and patterning in Yoruba (the keratin cluster near 17q12; and FZD6).
An important type of selective pressure that has confronted modern humans is the transition to novel food sources with the advent of agriculture and the colonization of new habitats [19,21]. As noted above, we see a strong signal of selection in the alcohol dehydrogenase (ADH) cluster in East Asians, including the third longest haplotype around a high frequency allele in East Asians. A variety of genes involved in carbohydrate metabolism have evidence for recent selection, including genes involved in metabolizing mannose (MAN2A1 in Yoruba and East Asians), sucrose (SI in East Asians), and lactose (LCT in Europeans). Processing of dietary fatty acids is another system with signals of strong selection, including uptake (SLC27A4 and PPARD in Europeans), oxidation (SLC25A20 in East Asians) and regulation (NCOA1 in Yoruba and LEPR in East Asians). The latter gene (LEPR) is the leptin receptor and plays an important role in regulating adipose tissue mass.
Recent articles have proposed that genes involved in brain development and function may have been important targets of selection in recent human evolution [8,9]. While we do not find evidence for selection in the two genes reported in those studies (MCPH1 and ASPM), we do find signals in two other microcephaly genes, namely, CDK5RAP2 in Yoruba, and CENPJ in Europeans and East Asians [46]. Though there is not an overall enrichment for neurological genes in our gene ontology analysis, several other important brain genes also have signals of selection, including the primary inhibitory neurotransmitter GABRA4, an Alzheimer's susceptibility gene PSEN1, and SYT1 in Yoruba; the serotonin transporter SLC6A4 in Europeans and East Asians; and the dystrophin binding gene SNTG1 in all populations.
PLoS Biology Volume 4 | Issue 3 | MARCH 2006
A Map of Recent Positive Selection in the Human Genome
Benjamin F. Voight1, Sridhar Kudaravalli1, Xiaoquan Wen1, Jonathan K. Pritchard1*
The identification of signals of very recent positive selection provides information about the adaptation of modern humans to local conditions. We report here on a genome-wide scan for signals of very recent positive selection in favor of variants that have not yet reached fixation. We describe a new analytical method for scanning single nucleotide polymorphism (SNP) data for signals of recent selection, and apply this to data from the International HapMap Project. In all three continental groups we find widespread signals of recent positive selection. Most signals are region-specific, though a significant excess are shared across groups. Contrary to some earlier low resolution studies that suggested a paucity of recent selection in sub-Saharan Africans, we find that by some measures our strongest signals of selection are from the Yoruba population. Finally, since these signals indicate the existence of genetic variants that have substantially different fitnesses, they must indicate loci that are the source of significant phenotypic variation. Though the relevant phenotypes are generally not known, such loci should be of particular interest in mapping studies of complex traits. For this purpose we have developed a set of SNPs that can be used to tag the strongest ∼250 signals of recent selection in each population.
Link
March 06, 2006
Prevalence of depression has been greatly exaggerated
The Methodology of Community Surveys leads to an overestimate of mental illness
According to widely reported community-based research, almost half the U.S. population suffers from depression. But research by two sociologists indicates that percentage is greatly exaggerated or is a misrepresentation.
The extraordinarily high rates of untreated mental illness reported by community studies are false, say Allan V. Horwitz, a sociology professor in the Institute of Health at Rutgers University, and Jerome Wakefield, a professor in the School of Social Work at New York University. Community studies rely on standard, closed-format questions about symptoms with no context provided to differentiate between reactions to normal life stress (i.e., a death, a romantic break up, work or school stress) and pathological conditions that indicate clinical mental illness.
"These numbers are largely a product of survey methodologies that, by nature, overstate the number of people with mental illness." Reporting the findings in Contexts magazine (Winter 2006), published by the American Sociological Association, the authors state, "Moreover, because people experiencing normal reactions to stressful events are less likely than the truly disordered to seek medical attention, such questions are bound to inflate estimates of the rate of untreated disorder."
In the past, diagnoses relied on treatment studies, but it became apparent that the number of treated patients understated the problem for a variety of reasons such as lack of access to treatment and reluctance to seek appropriate help. Today tightly structured questions are used in community studies to allow researchers to better diagnose a population.
The problem is that the criteria used in the community surveys are not necessarily valid for diagnosing mental disorders. One reason for this is that people self-select when seeking treatment and use their judgment to decide if their feelings exceed normal responses to stressful events. Second, clinicians make contextual judgments when they diagnose patients because some depressive symptoms might occur as a normal response to a loss of a job or a marriage unraveling. In surveys, interviewers are forbidden to judge the validity of a response or discuss the intent of a question. In addition, the duration criteria of community surveys only require that symptoms last at least two weeks, causing transient and self-correcting problems to be counted as disorders.
"In contrast to clinical settings," say Horwitz and Wakefield, "symptom-based diagnoses in community studies consider everyone who reports enough symptoms as having the mental disorder of depression. Symptoms that would not require treatment may nevertheless qualify as a disorder in a community survey."
"Community surveys could more adequately separate normal responses to stressful situations from mental disorders by including questions about the context in which symptoms develop and persist," say Horwitz and Wakefield. The decision not to include contextual criteria in community surveys, they speculate, might have to do not only with efficiency and practicality but also with resistance to change by groups that benefit from high rates of mental health problems.
There are a number of reasons that these high rates are perpetuated. One is that political support is more likely for an agency devoted to preventing and treating a widespread disease such as the National Institute of Mental Health. Another reason is that pharmaceutical companies capitalize on these survey findings to broaden their markets. The explosive growth in sales of antidepressants may indicate its effectiveness. Lastly, advocacy groups lay claim to the prevalence of mental disorders. They equate the millions of people that surveys identify with disorders with the serious mental disorders in order to reduce the social distance between the mentally disordered and others, thereby lowering the stigma. This may only hinder the truly disabled by shifting resources from where it is truly needed.
March 05, 2006
March 03, 2006
Altruistic human infants
The authors also tried to see if chimpanzees would act altruistically in similar situations. They did so, but at a lower rate than human infants, indicating that some degree of altruism may have been present in the common ancestor of humans and chimpanzees.
Science Vol. 311. no. 5765, pp. 1301 - 1303
Altruistic Helping in Human Infants and Young Chimpanzees
Felix Warneken and Michael Tomasello
Human beings routinely help others to achieve their goals, even when the helper receives no immediate benefit and the person helped is a stranger. Such altruistic behaviors (toward non-kin) are extremely rare evolutionarily, with some theorists even proposing that they are uniquely human. Here we show that human children as young as 18 months of age (prelinguistic or just-linguistic) quite readily help others to achieve their goals in a variety of different situations. This requires both an understanding of others' goals and an altruistic motivation to help. In addition, we demonstrate similar though less robust skills and motivations in three young chimpanzees.
Link
Bronze Age artists from Thera had advanced knowledge of geometry
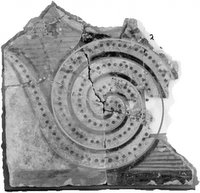
A group of Greek researchers has studied spiral designs from the Aegean island of Thera which was home to a Bronze Age civilization related to the Minoan civilization of Crete. Spirals are mathematical curves which are described by specific formulas. It is however possible to create a spiral-like design even if someone has no knowledge of geometry. The researchers have shown that the Theran spirals follow very closely the geometrical spiral described by Archimedes, the Greek mathematician of the Hellenistic age, who lived more than 1,000 years after the demise of the Theran civilization. According to the researchers (subscription may be required):
Some spirals, such as the ones found on snail shells, are common in nature. And others can be easily made by unwinding a thread around a central peg. But the Archimedes' spiral is not like either of these. "Seemingly it does not exist in nature," the researchers say.Such a close match between the mathematically described spirals and the ones found in Thera is not possible by chance alone; someone who drew a spiral by freehand would simply not be able to match the mathematical form so closely. Therefore, it is likely that the Theran artists used a mechanical technique which made use of mathematics to produce these very precise decorative motifs.
"This is the earliest time that such advanced geometric figures have been spotted," says Papaodysseus. "The next such figures appear only 1,300 years later." The team report their work in the journal Archaeometry
Archaeometry, Volume 48, Number 1, February 2006, pp. 97-114(18)
DISTINCT, LATE BRONZE AGE (c. 1650bc) WALL-PAINTINGS FROM AKROTIRI, THERA, COMPRISING ADVANCED GEOMETRICAL PATTERNS
C. Papaodysseus et al.
Abstract:
This paper studies a set of wall-paintings of the Late Bronze Age (c. 1650bc) initially decorating the internal walls of the third floor of the edifice called `Xeste 3', excavated at Akrotiri, Thera, whose restoration is now in progress. It deals with the methods used for the drawing of the geometrical figures appearing in these wall-paintings. It is demonstrated that most of the depicted configurations correspond with accuracy to geometrical prototypes such as linear spirals and canonical polygons. It is pointed out that the steady lines of the figures, their remarkable repeatability, the precision of the geometrical shapes and their even distribution in the wall-paintings indicate a very distinctive use of the `Xeste 3' third floor, which is now investigated.
Link
March 02, 2006
Neanderthal and modern human hunters from the Southern Caucasus
CURRENT ANTHROPOLOGY Volume 47, Number 1, February 2006
Ahead of the Game
Middle and Upper Palaeolithic Hunting Behaviors in the Southern Caucasus
by Daniel S. Adler, Guy Bar-Oz, Anna Belfer-Cohen, and Ofer Bar-Yosef
Over the past several decades a variety of models have been proposed to explain perceived behavioral and cognitive differences between Neanderthals and modern humans. A key element in many of these models and one often used as a proxy for behavioral "modernity" is the frequency and nature of hunting among Palaeolithic populations. Here new archaeological data from Ortvale Klde, a late Middle–early Upper Palaeolithic rockshelter in the Georgian Republic, are considered, and zooarchaeological methods are applied to the study of faunal acquisition patterns to test whether they changed significantly from the Middle to the Upper Palaeolithic. The analyses demonstrate that Neanderthals and modern humans practiced largely identical hunting tactics and that the two populations were equally and independently capable of acquiring and exploiting critical biogeographical information pertaining to resource availability and animal behavior. Like lithic techno-typological traditions, hunting behaviors are poor proxies for major behavioral differences between Neanderthals and modern humans, a conclusion that has important implications for debates surrounding the Middle–Upper Palaeolithic transition and what features constitute "modern" behavior. The proposition is advanced that developments in the social realm of Upper Palaeolithic societies allowed the replacement of Neanderthals in the Caucasus with little temporal or spatial overlap and that this process was widespread beyond traditional topographic and biogeographical barriers to Neanderthal mobility.
Link
The eclipse of the gene
Eclipse of the Gene and the Return of Divination
by Margaret Lock
Research in the field of epigenetics challenges the assumption on which the molecular genetics of the past 50 years has been based, namely, genetic determinism. This paper reviews the social science literature that considers the social effects of the application of molecular genetics and genetic testing in connection with Mendelian conditions. It is argued that anthropologists must now go farther and respond to the challenge posed by current moves toward the implementation of genetic profiling and testing for susceptibility genes. Following a discussion of ontological problems associated with molecular genetics raised by philosophers and biologists who subscribe to epigenetics, current knowledge about molecular and population genetics of late-onset Alzheimer's disease and cross-cultural findings about the epidemiology of this disease are introduced. These findings illustrate the provisional nature of these bodies of knowledge and the complexity associated with susceptibility genes, which makes estimations of probabilities of individual risk unrealistic. A controlled clinical trial is discussed in which first-degree relatives of Alzheimer's disease patients are genotyped for risk for late-onset Alzheimer's disease. In conclusion, the social implications of testing for susceptibility genes are discussed, with comments about the role that anthropologists might play in future research.
Link