Slick, sanctimonious Dr. Robert Bellarmino at the National Institutes of Health touts future genetic cures he doubts will ever happen. Bellarmino knows that individual genes don't determine specific traits such as homosexuality, violence, high IQ, short stature or resistance to Alzheimer's disease; their interaction with other genes and with the environment is staggeringly complex. But it's good for the research business to pretend otherwise. When doctors bend the rules in long-odds attempts to provide the cures for inherited illnesses that the public demands, Bellarmino works to shield them from censure.

November 30, 2006
Michael Crichton's Next
Michael Crichton, author of popular books such as Jurassic Park has written a new novel about genetic engineering, titled Next. I didn't much like his previous book which expressed unwarranted reservations about the reality of global warming, but this bit from a review of his book seems to me to be right on the money:
Nature article on Antikythera mechanism
From the BBC:
The New York Times:
Jo Marchant writing in Nature:
François Charette in Nature:
From the paper:
Nature 444, 587-591 (30 November 2006)
T. Freeth et al.
The Antikythera Mechanism is a unique Greek geared device, constructed around the end of the second century bc. It is known1, 2, 3, 4, 5, 6, 7, 8, 9 that it calculated and displayed celestial information, particularly cycles such as the phases of the moon and a luni-solar calendar. Calendars were important to ancient societies10 for timing agricultural activity and fixing religious festivals. Eclipses and planetary motions were often interpreted as omens, while the calm regularity of the astronomical cycles must have been philosophically attractive in an uncertain and violent world. Named after its place of discovery in 1901 in a Roman shipwreck, the Antikythera Mechanism is technically more complex than any known device for at least a millennium afterwards. Its specific functions have remained controversial11, 12, 13, 14 because its gears and the inscriptions upon its faces are only fragmentary. Here we report surface imaging and high-resolution X-ray tomography of the surviving fragments, enabling us to reconstruct the gear function and double the number of deciphered inscriptions. The mechanism predicted lunar and solar eclipses on the basis of Babylonian arithmetic-progression cycles. The inscriptions support suggestions of mechanical display of planetary positions9, 14, 15, now lost. In the second century bc, Hipparchos developed a theory to explain the irregularities of the Moon's motion across the sky caused by its elliptic orbit. We find a mechanical realization of this theory in the gearing of the mechanism, revealing an unexpected degree of technical sophistication for the period.
Link
For example, the Moon sometimes moves slightly faster in the sky than at others because of the satellite's elliptic orbit.
To overcome this, the designer of the calculator used a "pin-and-slot" mechanism to connect two gear-wheels that introduced the necessary variations.
"When you see it your jaw just drops and you think: 'bloody hell, that's clever'. It's a brilliant technical design," said Professor Mike Edmunds.
The New York Times:
The mechanism, presumably used in preparing calendars for seasons of planting and harvesting and fixing religious festivals, had at least 30, possibly 37, hand-cut bronze gear-wheels, the researchers reported. An ingenious pin-and-slot device connecting two gear-wheels induced variations in the representation of lunar motions according to the Hipparchos model of the Moon’s elliptical orbit around Earth.
The functions of the mechanism were determined by the numbers of teeth in the gears. The 53-tooth count of certain gears, the researchers said, was “powerful confirmation of our proposed model of Hipparchos’ lunar theory.”
Jo Marchant writing in Nature:
The researchers realized that the ratios of the gear-wheels involved produce a motion that closely mimics the varying motion of the Moon around Earth, as described by Hipparchus. When the Moon is close to us it seems to move faster. And the closest part of the Moon's orbit itself makes a full rotation around the Earth about every nine years. Hipparchus was the first to describe this motion mathematically, working on the idea that the Moon's orbit, although circular, was centred on a point offset from the centre of Earth that described a nine-year circle. In the Antikythera Mechanism, this theory is beautifully translated into mechanical form. "It's an unbelievably sophisticated idea," says Tony Freeth, a mathematician who worked out most of the mechanics for Edmunds' team. "I don't know how they thought of it."
...
Charette also hopes the new Antikythera reconstruction will encourage scholars to take the device more seriously, and serve as a reminder of the messy nature of history. "It's still a popular notion among the public, and among scientists thinking about the history of their disciplines, that technological development is a simple progression," he says. "But history is full of surprises."
François Charette in Nature:
From the paper:
The Antikythera Mechanism shows great economy and ingenuity of design. It stands as a witness to the extraordinary technological potential of Ancient Greece, apparently lost within the Roman Empire.
Nature 444, 587-591 (30 November 2006)
T. Freeth et al.
The Antikythera Mechanism is a unique Greek geared device, constructed around the end of the second century bc. It is known1, 2, 3, 4, 5, 6, 7, 8, 9 that it calculated and displayed celestial information, particularly cycles such as the phases of the moon and a luni-solar calendar. Calendars were important to ancient societies10 for timing agricultural activity and fixing religious festivals. Eclipses and planetary motions were often interpreted as omens, while the calm regularity of the astronomical cycles must have been philosophically attractive in an uncertain and violent world. Named after its place of discovery in 1901 in a Roman shipwreck, the Antikythera Mechanism is technically more complex than any known device for at least a millennium afterwards. Its specific functions have remained controversial11, 12, 13, 14 because its gears and the inscriptions upon its faces are only fragmentary. Here we report surface imaging and high-resolution X-ray tomography of the surviving fragments, enabling us to reconstruct the gear function and double the number of deciphered inscriptions. The mechanism predicted lunar and solar eclipses on the basis of Babylonian arithmetic-progression cycles. The inscriptions support suggestions of mechanical display of planetary positions9, 14, 15, now lost. In the second century bc, Hipparchos developed a theory to explain the irregularities of the Moon's motion across the sky caused by its elliptic orbit. We find a mechanical realization of this theory in the gearing of the mechanism, revealing an unexpected degree of technical sophistication for the period.
Link
November 29, 2006
The Gagauz of Moldova
Annals of Human Genetics (Online Early)
The Gagauz, a Linguistic Enclave, are not a Genetic Isolate
Ivan Nasidze et al.
Summary
The Gagauz are a Turkic-speaking group that migrated from Turkey to their present location in the southern part of the Republic of Moldova about 150 years ago. Surrounded by Indo-European-speaking populations, they thus form a linguistic enclave, which raises the following question: to what extent have they remained in genetic isolation from their geographic neighbours? Analyses of mtDNA and Y chromosome variation indicate that despite their linguistic differences, the Gagauz have admixed extensively with neighbouring groups. Our data suggest that there has been more mtDNA than Y chromosome admixture, in keeping with the patrilocal nature of these groups. Moreover, when compared with another linguistic enclave, the Kalmyks there appears to be a correlation between the amount of genetic admixture and the amount of linguistic influence that these two linguistic enclaves have experienced from neighbouring groups.
Link
November 23, 2006
Copy number variation in humans
 From the paper:
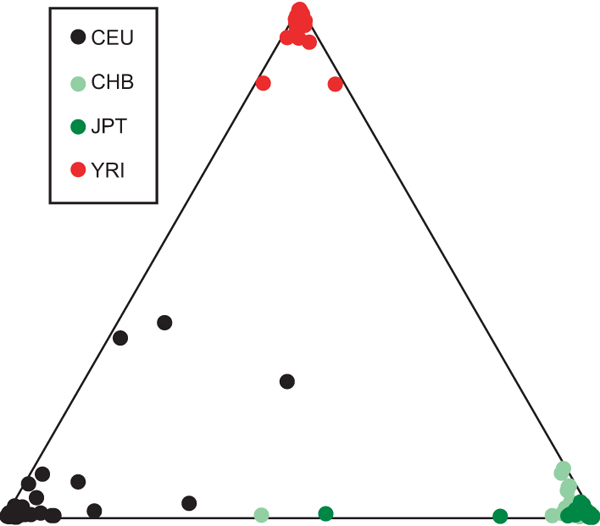
We obtained the optimal clustering with the assumption of three ancestral populations, with the African, European and Asian populations clearly differentiated
Nature 444, 444-454 (23 November 2006)
Global variation in copy number in the human genome
Richard Redon et al.
Copy number variation (CNV) of DNA sequences is functionally significant but has yet to be fully ascertained. We have constructed a first-generation CNV map of the human genome through the study of 270 individuals from four populations with ancestry in Europe, Africa or Asia (the HapMap collection). DNA from these individuals was screened for CNV using two complementary technologies: single-nucleotide polymorphism (SNP) genotyping arrays, and clone-based comparative genomic hybridization. A total of 1,447 copy number variable regions (CNVRs), which can encompass overlapping or adjacent gains or losses, covering 360 megabases (12% of the genome) were identified in these populations. These CNVRs contained hundreds of genes, disease loci, functional elements and segmental duplications. Notably, the CNVRs encompassed more nucleotide content per genome than SNPs, underscoring the importance of CNV in genetic diversity and evolution. The data obtained delineate linkage disequilibrium patterns for many CNVs, and reveal marked variation in copy number among populations. We also demonstrate the utility of this resource for genetic disease studies.
Link (Free access)
November 17, 2006
Phylogeography of mtDNA haplogroup L1c
Mol Phylogenet Evol. 2006 Oct 5; [Epub ahead of print]
Phylogeography of the human mitochondrial L1c haplogroup: Genetic signatures of the prehistory of Central Africa.
Batini C, Coia V, Battaggia C, Rocha J, Pilkington MM, Spedini G, Comas D, Destro-Bisol G, Calafell F.
Abstract
Interindividual variation of human mitochondrial DNA has been extensively studied over the last two decades, and its usefulness for reconstructing evolutionary relationships of extant populations has been proved. However, some mitochondrial lineages still need to be studied using a combination of larger and tailored datasets and increased level of resolution in order to shed light on their origin and on the processes underlying their present distribution. In this study, we analyze the phylogeny of the L1c haplogroup of human mitochondrial DNA using sequence data from hypervariable regions 1 and 2 obtained from 455 individuals (extracted from a total sampling of 2542 individuals) belonging to sub-Saharan African and African-American populations. We propose a substantial revision of L1c phylogeny, by introducing one new sub-haplogroup (L1c4), two new L1c1 clades (L1c1b and L1c1c), and by reassigning the previous L1c1a1 sequences to a clade which we termed L1c5. The new phylogeny encompasses distinct lineages with different evolutionary histories. In fact, based on population frequency, internal variation and mismatch distribution, we propose that L1c1b, L1c1c and L1c2 originated in Bantu ancestors, whereas L1c1a, L1c4 and L1c5 evolved among Western Pygmies. The population structure of L1c is not comparable to any known mitochondrial or, even, Y-chromosomal haplogroup, and challenges the current view that most of mtDNA variation in Pygmies might reflect admixture with Bantu or a persistence of plesiomorphic characters. In fact, the unique feature of the L1c is that it retains a signature of a phase common to the ancestors of the Bantu and Western Pygmies, while encompassing some specific sub-clades which can indicate their divergence. This allowed us to attempt a phylogenetically based assessment of the evolutionary relationships between the two groups. Taking into consideration estimates of the time to the most recent common ancestor of L1c and its clades together with archaeological and paleoclimatological evidence, we propose that the ancestors of Bantu and Western Pygmies separated between 60 and 30kya.
Link
Human eye color explained by a three-SNP haplotype
A very exciting new preprint in AJHG describes how a haplotype defined by three SNPs, i.e., single-letter changes in the genetic code, describes most variation in human eye color. I am sure that this paper will make the news once its edited version appears, but this is very exciting development for many different reasons.
American Journal of Human Genetics (preprint)
A three-SNP haplotype in the first intron of OCA2 explains most human eye color variation
David L. Duffy, Grant W. Montgomery, Wei Chen, Zhen Zhen Zhao, Lien Le, Michael R. James, Nicholas K. Hayward, Nicholas G. Martin, Richard A. Sturm
Abstract
We have previously shown that a QTL linked to the OCA2 region of 15q accounts for 74% of variation in human eye color. We conducted additional genotyping to clarify the role of the OCA2 locus in the inheritance of eye color and other pigmentary traits associated with skin cancer risk in white populations. Fifty eight synonymous and non-synonymous exonic SNPs and tagging SNPs were typed in a collection of 3839 adolescent twins, their sibs, and parents. The highest association for blue:non-blue eye color was found with three OCA2 SNPs; rs7495174 T/C, rs6497268 G/T and rs11855019 T/C (P-values of 1.02x10-61, 1.57x10-96, and 4.45x10-54 respectively) in intron 1. These three SNPs are in one major haplotype block with TGT representing 78.4% of alleles. The TGT/TGT diplotype found in 62.2% of samples was the major genotype seen to modify eye color, with a frequency of 0.905 in blue or green compared with only 0.095 in brown eye color. This genotype was also at highest frequency in subjects with light brown hair and was more frequent in fair and medium skin types, consistent with the TGT haplotype acting as a recessive modifier of lighter pigmentary phenotypes. Homozygotes for rs11855019 C/C were predominantly without freckles and had decreased mole counts. The minor population impact of the nonsynonymous coding region polymorphisms Arg305Trp and Arg419Gln associated with non-blue eyes, and the tight linkage of the major TGT haplotype within the first intron of OCA2 with blue eye color and lighter hair and skin tones, suggest that differences within the 5’ proximal regulatory control region of OCA2 gene alter expression or mRNA transcript levels and may be responsible for these associations.
Link
- First, it shows that a very striking observable difference among humans can be explained by minute differences in the genetic code. This should be a reminder to those who engage in grocery-style genetics. Quantity matters not.
- Second, eye color is an important phenotypical character that people actually care about. Genetics becomes exciting when it's about stuff that people are interested in (intelligence, eye color, the chance of getting cancer before 40, etc.).
- Third, we are finally getting to the point where genetics can be used to infer characteristics of organisms that are not preserved in bones. This will doubtlessly lead to applications in ancient DNA research (see also here).
American Journal of Human Genetics (preprint)
A three-SNP haplotype in the first intron of OCA2 explains most human eye color variation
David L. Duffy, Grant W. Montgomery, Wei Chen, Zhen Zhen Zhao, Lien Le, Michael R. James, Nicholas K. Hayward, Nicholas G. Martin, Richard A. Sturm
Abstract
We have previously shown that a QTL linked to the OCA2 region of 15q accounts for 74% of variation in human eye color. We conducted additional genotyping to clarify the role of the OCA2 locus in the inheritance of eye color and other pigmentary traits associated with skin cancer risk in white populations. Fifty eight synonymous and non-synonymous exonic SNPs and tagging SNPs were typed in a collection of 3839 adolescent twins, their sibs, and parents. The highest association for blue:non-blue eye color was found with three OCA2 SNPs; rs7495174 T/C, rs6497268 G/T and rs11855019 T/C (P-values of 1.02x10-61, 1.57x10-96, and 4.45x10-54 respectively) in intron 1. These three SNPs are in one major haplotype block with TGT representing 78.4% of alleles. The TGT/TGT diplotype found in 62.2% of samples was the major genotype seen to modify eye color, with a frequency of 0.905 in blue or green compared with only 0.095 in brown eye color. This genotype was also at highest frequency in subjects with light brown hair and was more frequent in fair and medium skin types, consistent with the TGT haplotype acting as a recessive modifier of lighter pigmentary phenotypes. Homozygotes for rs11855019 C/C were predominantly without freckles and had decreased mole counts. The minor population impact of the nonsynonymous coding region polymorphisms Arg305Trp and Arg419Gln associated with non-blue eyes, and the tight linkage of the major TGT haplotype within the first intron of OCA2 with blue eye color and lighter hair and skin tones, suggest that differences within the 5’ proximal regulatory control region of OCA2 gene alter expression or mRNA transcript levels and may be responsible for these associations.
Link
November 16, 2006
Personality traits of voters for US presidential elections
Personality and Individual Differences (Article in Press)
Voters’ personality traits in presidential elections
Claudio Barbaranelli et al.
Abstract
Personality measures of more than 6000 US electors on the Big Five Factors have been collected on the Web through a Web site designed to assess their personality. By means of structural equation modeling the impact of personality factors as well as of demographic variables, such as age and sex, on voting intentions on the forthcoming US presidential elections was investigated. Personality variables accounted for 16% of variance of voting intentions, while gender and age accounted for no more than 3%. High Agreeableness and Openness were predictive of intention to vote for Kerry, while all high Energy, Conscientiousness and Emotional Stability were predictive of intention to vote for Bush. Results are consistent with previous research conducted in a different country, using a different language.
Link
Being rich lowers mens' attractiveness to women
Personality and Individual Differences (Article in Press)
Too good to be ‘true’? The handicap of high socio-economic status in attractive males
Simon Chu et al.
Abstract
Empirical evidence concerning human mate-choice preferences suggests that females should select partners on the basis of cues to genetic quality and/or ability to contribute resources to childcare. Paradoxically, while high levels of both factors should be an attractive combination to females, they might also dissuade females from entering into a relationship with such males since, by definition, they are likely to be highly attractive to other females, and therefore might increase the likelihood that such a male may cheat or desert the relationship. If so, females should be wary of entering into long-term relationships with physically attractive, high status males as compared with males of lower physical attractiveness or status. We asked females to rate a number of different males in terms of attractiveness as a long-term partner. Females were presented with attractive, average and unattractive male faces paired with lonely-hearts advertisements implying high, medium or low socio-economic status. Highest ratings were consistently given to attractive males of medium status rather than high status. We suggest that females see physically attractive, high status males as being more likely to pursue a mating strategy rather than parenting strategy. Under particular circumstances, high socio-economic status in males can be subtly counter-productive in terms of attractiveness as a long-term partner.
Link
November 13, 2006
Culture and ratings of attractiveness of different body shapes
Evolution and Human Behavior
Volume 27, Issue 6 , November 2006, Pages 443-456
Changing perceptions of attractiveness as observers are exposed to a different culture
Martin J. Tovée et al.
Abstract
It has been suggested that certain physical cues can be used to predict mate quality and that sensitivity to these cues would therefore be adaptive. From this, it follows that in environments where the optimal values for these features differ, the attractiveness preferences should also be different. In this study, we show that there are striking differences in attractiveness preferences for female bodies between United Kingdom (UK) Caucasian and South African Zulu observers. These differences can be explained by different local optima for survival and reproduction in the two environments. In the UK, a high body mass is correlated with low health and low fertility, and the converse is true in rural South Africa. We also report significant changes in the attractiveness preferences of Zulus who have moved to the UK. This suggests that these preferences are malleable and can change with exposure to different environments and conditions. Additionally, we show that Britons of African origin, who were born and who grew up in the UK, have exactly the same preferences as our UK Caucasian observers. These results suggest that humans have mechanisms for acquiring norms of attractiveness that are highly plastic, which allow them to track different ecological conditions through learning.
Link
Even facial color is attractive in women
The study I had posted about earlier.
Evolution and Human Behavior
Volume 27, Issue 6 , November 2006, Pages 433-442
Visible skin color distribution plays a role in the perception of age, attractiveness, and health in female faces
Bernhard Fink et al.
Abstract
Evolutionary psychologists have proposed that preferences for facial characteristics, such as symmetry, averageness, and sexual dimorphism, may reflect adaptations for mate choice because they signal aspects of mate quality. Here, we show that facial skin color distribution significantly influences the perception of age and attractiveness of female faces, independent of facial form and skin surface topography. A set of three-dimensional shape-standardized stimulus faces—varying only in terms of skin color distribution due to variation in biological age and cumulative photodamage—was rated by a panel of naive judges for a variety of perceptual endpoints relating to age, health, and beauty. Shape- and topography-standardized stimulus faces with the homogeneous skin color distribution of young people were perceived as younger and received significantly higher ratings for attractiveness and health than analogous stimuli with the relatively inhomogeneous skin color distribution of more elderly people. Thus, skin color distribution, independent of facial form and skin surface topography, seems to have a major influence on the perception of female facial age and judgments of attractiveness and health as they may signal aspects of underlying physiological condition of an individual relevant for mate choice. We suggest that studies on human physical attractiveness and its perception need to consider the influence of visible skin condition driven by color distribution and differentiate between such effects and beauty-related traits due to facial shape and skin topography.
Link
Female advantage in recognizing emotional facial expressions
Evolution and Human Behavior
Volume 27, Issue 6 , November 2006, Pages 401-416
A female advantage in the recognition of emotional facial expressions: test of an evolutionary hypothesis
Elizabeth Hampson et al.
Abstract
A set of computerized tasks was used to investigate sex differences in the speed and accuracy of emotion recognition in 62 men and women of reproductive age. Evolutionary theories have posited that female superiority in the perception of emotion might arise from women's near-universal responsibility for child-rearing. Two variants of the child-rearing hypothesis predict either across-the-board female superiority in the discrimination of emotional expressions (“attachment promotion” hypothesis) or a female superiority that is restricted to expressions of negative emotion (“fitness threat” hypothesis). Therefore, we sought to evaluate whether the expression of the sex difference is influenced by the valence of the emotional signal (Positive or Negative). The results showed that women were faster than men at recognizing both positive and negative emotions from facial cues, supporting the attachment promotion hypothesis. Support for the fitness threat hypothesis also was found, in that the sex difference was accentuated for negative emotions. There was no evidence that the female superiority was learned through previous childcare experience or that it was derived from a sex difference in simple perceptual speed. The results suggest that evolved mechanisms, not domain-general learning, underlie the sex difference in recognition of facial emotions.
Link
November 10, 2006
Origin of mtDNA haplogroup H
Molecular Biology and Evolution (Advance Access published online on November 10, 2006)
Origin and Expansion of Haplogroup H, the Dominant Human Mitochondrial DNA Lineage in West Eurasia: the Near Eastern and Caucasian Perspective
U. Roostalu et al.
Abstract
More than a third of the European pool of human mitochondrial DNA (mtDNA) is fragmented into a number of subclades of haplogroup (hg) H, the most frequent hg throughout western Eurasia. While there has been considerable recent progress in studying mitochondrial genome variation in Europe at the complete sequence resolution, little data of comparable resolution is so far available for regions like the Caucasus and the Near and Middle East - areas where most of European genetic lineages, including hg H, have likely emerged. This gap in our knowledge causes a serious hindrance for progress in understanding the demographic pre-history of Europe and western Eurasia in general. Here we describe the phylogeography of hg H in the populations of the Near East and the Caucasus. We have analyzed 545 samples of hg H at high resolution, including 15 novel complete mtDNA sequences. As in Europe, most of the present-day Near Eastern - Caucasus area variants of hg H started to expand after the Last Glacial Maximum (LGM) and presumably before the Holocene. Yet importantly, several hg H sub-clades in Near East and Southern Caucasus region coalesce to the pre-LGM period. Furthermore, irrespective of their common origin, significant differences between the distribution of hg H sub-hgs in Europe and in the Near East and South Caucasus imply limited post-LGM maternal gene flow between these regions. In a contrast, the North Caucasus mitochondrial gene pool has received an influx of hg H variants, arriving from the Pontocaspian/East European area.
Link
The Perfect comedy face
 Anthony Little has created a facial composite of comedians. From the BBC:
Scientists have used computer software to come up with what they say is the perfect comedy face.
The University of Stirling team blended together 179 different facial aspects of 20 top comedians.
They said soft and feminine features, typified by Ricky Gervais, were more likely to make people laugh.
The researchers also concluded that Conservative leader David Cameron, unlike Tony Blair or Gordon Brown, has features prone to make people laugh.
However, they said it was questionable whether a funny face was an electoral asset.
Researcher Dr Anthony Little, a psychologist, whose work was commissioned by Jongleurs comedy clubs, showed faces with a range of different features to volunteers, and asked them to rate how funny they thought the person was.
He said: "The features most likely to mark male comedians out for success are predominantly soft and feminine.
"The face is a strong indication of character, and today's study appears to explain why comedians of a certain appearance would have been drawn to their career.
"The characteristics of a feminine face imply that the person may be agreeable and co-operative, which can be causal in our first impressions of comedians as being friendly and funny."
Dr Little said Mr Cameron's round and wide facial shape, large eyes and soft features meant he had the right natural physical attributes for comedy.
November 08, 2006
Switch to Blogger beta
I have switched the blog to Google's blogger beta. Everything seems to work fine so far, but the site feed has a new address. You might want to update it in your news reader, since I'm not sure whether the old feed will continue to be updated (I will know after posting this).
UPDATE: Yep, the old feed still works.
UPDATE: The gmail-like system of search+label rocks! I just labeled all 911 posts of the blog in a few minutes right from the dashboard. Another great feature: no more waiting on the "publishing 34%" whenever you change your template or republish a post.
UPDATE: Yep, the old feed still works.
UPDATE: The gmail-like system of search+label rocks! I just labeled all 911 posts of the blog in a few minutes right from the dashboard. Another great feature: no more waiting on the "publishing 34%" whenever you change your template or republish a post.
Intelligence and socioeconomic success
Intelligence (in press)
Intelligence and socioeconomic success: A meta-analytic review of longitudinal research
Tarmo Strenze
Abstract
The relationship between intelligence and socioeconomic success has been the source of numerous controversies. The present paper conducted a meta-analysis of the longitudinal studies that have investigated intelligence as a predictor of success (as measured by education, occupation, and income). In order to better evaluate the predictive power of intelligence, the paper also includes meta-analyses of parental socioeconomic status (SES) and academic performance (school grades) as predictors of success. The results demonstrate that intelligence is a powerful predictor of success but, on the whole, not an overwhelmingly better predictor than parental SES or grades. Moderator analyses showed that the relationship between intelligence and success is dependent on the age of the sample but there is little evidence of any historical trend in the relationship.
Link
Microcephalin haplotype from Neanderthals
Bruce Lahn continues his work on the Microcephalin haplogroup D. In a new paper in PNAS he and his team suggest that this brain gene may have introgressed into the modern human gene pool ~37kya from a separate Homo lineage, possibly the Neanderthals. Note that this is an open access article.
UPDATE (May 15, 2010): Neandertals had ancestral MCPH1 allele; hence this paper's inference is essentially falsified.
Proc. Natl. Acad. Sci. USA, 10.1073/pnas.0606966103
Evidence that the adaptive allele of the brain size gene microcephalin introgressed into Homo sapiens from an archaic Homo lineage
Patrick D. Evans et al.
At the center of the debate on the emergence of modern humans and their spread throughout the globe is the question of whether archaic Homo lineages contributed to the modern human gene pool, and more importantly, whether such contributions impacted the evolutionary adaptation of our species. A major obstacle to answering this question is that low levels of admixture with archaic lineages are not expected to leave extensive traces in the modern human gene pool because of genetic drift. Loci that have undergone strong positive selection, however, offer a unique opportunity to identify low-level admixture with archaic lineages, provided that the introgressed archaic allele has risen to high frequency under positive selection. The gene microcephalin (MCPH1) regulates brain size during development and has experienced positive selection in the lineage leading to Homo sapiens. Within modern humans, a group of closely related haplotypes at this locus, known as haplogroup D, rose from a single copy {approx}37,000 years ago and swept to exceptionally high frequency ({approx}70% worldwide today) because of positive selection. Here, we examine the origin of haplogroup D. By using the interhaplogroup divergence test, we show that haplogroup D likely originated from a lineage separated from modern humans {approx}1.1 million years ago and introgressed into humans by {approx}37,000 years ago. This finding supports the possibility of admixture between modern humans and archaic Homo populations (Neanderthals being one possibility). Furthermore, it buttresses the important notion that, through such adminture, our species has benefited evolutionarily by gaining new advantageous alleles. The interhaplogroup divergence test developed here may be broadly applicable to the detection of introgression at other loci in the human genome or in genomes of other species.
Link
November 07, 2006
Mongoloid components in Eastern Europe
Slavs and other eastern Europeans are typically Caucasoid although one does not seldom find among them individuals with certain attenuated Mongoloid influences. The extent of Mongoloid admixture in eastern Europe will eventually be determined by autosomal admixture studies which sample the relevant source populations of the Mongoloid component in Europe, namely the Uralic and Altaic speakers of Siberia and Central Asia.
At present, the only study which studied the genomic study of a Slavic sample of Russians (Science 20 December 2002: Vol. 298. no. 5602, pp. 2381 - 2385) determined a 93% membership coefficient in the main Caucasoid cluster, with a 3% membership in the main (East Asian) Mongoloid cluster. Unfortunately Central Asian Turkic and Finno-Ugrian populations from Europe and Asia were not sampled.
The presence of Mongoloid mtDNA types in East Europe is well established, but it should be remembered that movements from the east did not usually involve large numbers of women (*). Therefore, one expects that inference from mtDNA will underestimate the total number of immigrants.
Moreover, as I have pointed out before, Turkic speakers of Central Asia were likely to possess majority components of Caucasoid Y chromosomes associated with Mongoloid mtDNA components. Today, haplogroup C chromosomes make up a large component of Y-chromosome variation in Central Asia (including the famous "Genghis Khan" line), but these were probably added (from the east), late in history, since the Mongol expansion is at the end of the great period of Altaic migrations to the west (Huns, Seljuks, Ottomans, Bulgars, etc.)
As a result a proportion of the eastern immigrants into Europe would be undetectable with Y-chromosome markers, namely the substantial fraction with Caucasoid Y chromosomes and Mongoloid mtDNA. The male immigrants of this type would impart their Y chromosomes in the regions they invaded, but not their maternal mtDNA. In the Altai-Kizhi group, for example, 71% Caucasoid Y chromosomes are associated with 76% non-Caucasoid mtDNA.
Consider a population with 3/4 Caucasoid Y chromosomes and 3/4 Mongoloid mtDNA. Consider that the migrant group consists of 3/4 men and 1/4 women. Under such circumstances we would expect approximately the same rate of Mongoloid mtDNA and Y chromosomes in the recipient population. Moreover, the inferred admixture proportion from the frequencies of Mongoloid mtDNA and Y chromosomes would underestimate the true rate of Mongoloid admixture by a factor of 2.
Unfortunately, the presence of Mongoloid Y chromosomes has not been properly studied until now. In the recent Y chromosome study of the Czech Republic for example, the main Mongoloid Y-haplogroups (C, Q, O) likely to have accompanied the women bearing the 3% Mongoloid mtDNA were not examined and could be part of the Y*, P*, and K* paragroups. Similarly, none of these haplogroups were studied in a recent study on Poland and Germany.
In conclusion:
- The mtDNA evidence suggests a very low-level introgression of Mongoloid components into Eastern Europe.
- The extent of this admixture is likely to be underestimated by the genetic profile of the source population and the excess of male migrants.
- The best estimate of the admixture rate will be determined by autosomal studies that sample relevant Uralic-Altaic source populations, but is probably unlikely to amount to more than a few percentage points.
November 06, 2006
ASHG 2006 abstracts
The meeting of the American Society of Human Genetics took place this October and the abstracts of the meeting are online in a big pdf file. A few items of interest:
The genetic variation and population history in the Baltic Sea region
Estimating the split time of Human and Neanderthal populations
Genomic diversity and population structure of Native Americans
The rare nonsynonymous SCN5A-S1103Y variant in Caucasians is due to recent African Admixture as revealed by 100k SNP genotyping.
Allele frequency estimates from DNA pools for 317,000 SNPs for multiple European and worldwide populations and discovery of Ancestry Informative Markers for Europe.
Mitochondrial haplogroups are associated with asthma and total serum IgE levels
The genetic variation and population history in the Baltic Sea region
Sharp genetic borders within a geographically restricted region are known to exist among the populations around the northern Baltic Sea on the northern edge of Europe. We studied the population history of this area in greater detail from paternal and maternal perspectives with Y chromosomal and mitochondrial DNA markers. Over 1700 DNA samples from Finland, Karelia, Estonia, Latvia, Lithuania and Sweden were genotyped for 18 Y-chromosomal biallelic polymorphisms and 8 microsatellite loci, together with 18 polymorphisms from the coding area of mtDNA and sequencing of the HVR1. Y chromosomal haplogroups from the biallelic data indicate both various phases of gene flow and existence of genetic barriers within the Baltic region. Haplogroup N3, being abundant on the eastern side of the Baltic, differentiates between eastern and western sides of the Baltic Sea, just like R1b that has a reverse frequency pattern to N3. The typically Scandinavian haplogroup Ia1 has a high frequency of up to 40%, separating not only Sweden but also Western Finland from the other populations. The frequency of haplogroup R1a1, most characteristic to Slavic peoples, varied substantially across the populations. In addition to biallelic markers, Y-chromosomal microsatellite loci were analyzed for a more detailed approach to the history of the paternal lineages in the region. We also analyzed mtDNA markers with special interest for sub-haplogroups of H and U, that among other haplogroups, show substantial variation between the populations (e.g. haplogroups H1, H2, T and J1). In conclusion, our current Y-chromosomal and mtDNA data suggest various incidents of gene flow from different sources, each reaching partly different areas of the Baltic region, which can be thus seen as a meeting point of a not only culturally but also genetically diverse set of populations.Asian Nomads traces in the mitochondrial gene pool of Slavs.
Mitochondrial DNA (mtDNA) variability was studied in a sample of 179 individuals representing Czech population from west Bohemia. MtDNA analysis revealed that the majority of Czech mtDNAs belongs to the common West Eurasian mitochondrial haplogroups. However, about 3 per cent of Czech mtDNAs encompass East Eurasian lineages (A, N9a, D4, M*). Comparative analysis of published data has shown that different Slavonic populations contain small but marked amount of East Eurasian mtDNAs (e.g. 1.3 per cent in Eastern Slavs, 1.8 per cent in Western Slavs, and 1.2 per cent in Southern Slavs). It is noteworthy that Baltic populations (Latvians, Lithuanians and Estonians) have avoided a marked influence of maternal lineages of East Eurasian origin (0.3-0.6 per cent). The two East Eurasian mtDNA haplogroups, Z1 and D5, are present in gene pools of North European Finnic populations (Saami, Finns, and Karelians). Unlike them, Slavonic populations in general are characterized by heterogeneous mtDNA structure, defined, in addition to Z1 and D5, by haplogroups A, C, D4, G2a, M*, N9a, F and Y. Therefore, different scenarios of female-mediated East Eurasian genetic influence on Northern and Eastern Europeans should be highlighted: (1) the most ancient, probably originated in the early Holocene, influx of Asian tribes, which brought a few selected East Asian mtDNA haplotypes (like Z and D5) to Fennoscandia (Tambets et al. 2004), and (2) gradual gene flows of historic times occurred mostly in the Middle Ages due to migrations of nomadic peoples (such as the Huns, Avars, Bulgars, Mongols) to Eastern and Central European territories inhabited mainly by Slavonic tribes. We suggest that the presence of East Eurasian mtDNA haplotypes is not original feature of gene pool of the proto-Slavs, but mostly is a consequence of admixture with Central Asian nomadic tribes, who migrated into Central and Eastern Europe in the early middle Ages.Use of Forensic Markers in the Assessment of Population Stratification.
Assignment of individuals to population groups is important to genetic case control association studies, admixture mapping, medical risk assessment, genealogy, and forensic studies. Polymorphic sequences can be used to infer ancestry but their utility for such an application is related to the number of alleles and relative frequency differences of these alleles between the population groups under study. Multiple study designs differing in numbers and types of polymorphic markers with differing levels of informativeness make comparison of studies difficult. The use of commercially-available highly-informative markers that are used internationally in forensic applications could provide a universal first tier analysis for assignment of individuals to population groups prior to inclusion in association and admixture studies. We evaluated the utility of the PowerPlex kit of 16 markers from Promega for this purpose. Multiple population groups including African, Bengalis, Chinese, Japanese, Koreans, Crypto Jews, Sephardic Jews, and Dutch were genotyped using the PowerPlex kit. The data were analyzed with STRUCTURE (Pritchard et al.) using an admixture model, correlated alleles and 3 clusters. Africans, Asians (Bengalis, Koreans, Chinese and Japanese), and Caucasians (Dutch, Sephardic Jews, and Crypto Jews) were clearly delineated. Individuals showing admixture were detectable and their removal resulted in more discrete clustering. An independently collected and genotyped set of Dutch individuals was indistinguishable from the original Dutch group providing reproducibility across data sets. The sensitivity conferred by the number of markers used in the analysis was assessed by removing markers. Delineation of population groups was apparent when 14 markers were used, although clusters were noisier; however it was not possible to delineate population groups when only 8 markers were used. The use of forensic markers is a promising strategy for clustering individuals into population groups and will be an inevitable outcome of their forensic use.Evaluation of Ancestry and Linkage Disequilibrium Sharing in Admixed Population in Mexico
National Institute of Genomic Medicine, Mexico. More than 80% of the Mexican population is considered Mestizo, resulting from the admixture of ethnic groups with Spaniards. To generate an initial estimate of ancestral contribution (AC) of populations from Europe, Africa and Asia to the Mexican Mestizos, we genotyped 104 samples from the states of Sonora (n=20), Yucatan (n=17), Guerrero (n=21), Zacatecas (n=19), Veracruz (n=18) and Guanajuato (n=8) using the 100K Affymetrix SNP array, and used data from the International HapMap Project as the parental population information. From 3,055 ancestry informative SNPs reported by Smith et al. and Choudhry et al., we identified 105 present in the 100K array and used them to calculate AC from each population to our sample. To infer AC we used Structure software under the admixture model. Based on this analysis, the average AC in our samples is 58.96% European, 10.03% African and 31.05% Asian. Sonora shows the highest European contribution (70.63%) and Guerrero the lowest (51.98%) where we also observe the highest Asian contribution (37.17%). African contribution ranges from 7.8% in Sonora to 11.13% in Veracruz. Based on these data, we grouped our population according to European AC (<50%,>70%). We used the Carlson algorithm to derive European tagSNPs from the 100K marker set. To explore Linkage Disequlibrium Sharing (LDS) between Mestizos and Europeans, we calculated the proportion of tagSNP-marker pairs that maintained an r2≥0.8 in each evaluated population. In general, comparison of LDS between European and Asian population is ~73%, whereas comparison with African population is ~40%. Mestizos from Guerrero show the lowest LDS (74%), whereas those from Sonora show the highest (77%). Similar results are seen in the group of lower (<50%)>70%) European ancestry. Our results suggest that the Mexican Mestizo population shows ancestry-based stratification that will requiere the appropriate corrections to avoid spurius results in association studies. Our results show that admixed populations have unique patterns of LD depending on levels of ancestral contribution.European mitochondrial haplogroups exhibit differential risk of developing presbycusis.
The genetic basis of human presbycusis (age-related hearing loss) is unknown. This common disorder is characterized by difficulty understanding conversation, particularly in noisy backgrounds. Audiograms of presbycusics show sloping hearing loss, with greatest deficiencies at the highest frequencies, and over time an individual’s hearing loss progresses into the lower frequencies that are more important for understanding speech. We investigated the hypothesis that the mitochondrial (mt) genome plays a role in presbycusis. Subjects of European ancestry, all over age 58, were tested using both classical and advanced audiometric measures and then genotyped to determine mt haplogroups. We found that subjects belonging to haplogroup H (N=93) had better hearing than other Europeans (N=80), with the greatest differences observed in the right ear at 3 kHz (p=0.017) and 10-14 kHz (p=0.016). The difference at 3 kHz correlates with the common noise notch location, and thus may indicate a difference in susceptibility to noise damage. Distortion product otoacoustic emissions also indicated better hair cell health in haplogroup H subjects, at higher frequencies and in the right ear (average DPOAEfor 4-6 kHz, p= 0.010). These results support the hypothesis that a mitochondrial factor influences susceptibility to the development of presbycusis. We are currently investigating the mt genome for causative mutations linked to the haplogroups.
Estimating the split time of Human and Neanderthal populations
Previous genetic studies of Neanderthal ancestry have used mtDNA and thus have been limited in their conclusions on the relationship of humans and Neanderthals. We present here the first use of Neanderthal genomic DNA to assess the joint history of human and Neanderthal populations. Our data consist of 37kb of short fragments of genomic DNA sequenced in Neanderthal. By studying the degree to which modern human diversity is shared with Neanderthal we can assess the time at which the human and Neanderthal populations split. We use a flexible simulation based approach that demonstrates the power of using human variation data in such analyses. We find that the two populations split ~400,000 years, predating the emergence of modern humans. Our best fitting model predicts that the Neanderthal lineage will be outgroup to the human population ~52% of the time.The Genetic Structure of Human Populations in Africa.
Africa contains the greatest levels of human genetic variation and is the source of the worldwide range expansion of all modern humans. Knowledge of the genetic population boundaries within Africa has important implications for the design and implementation of genetic epidemiologic studies of Africans and African Americans, and for reconstructing modern human origins. A dataset consisting of ~3.7 million genotypes has been generated from the Marshfield panel of 773 microsatellites and 392 in-del polymorphic genetic markers. These markers were genotyped in ~3,200 individuals from >100 diverse ethnic populations across Africa as well as in 118 African Americans and in the CEPH Human Genome Diversity Panel, consisting of 1048 individuals from 51 globally diverse populations. Preliminary analysis of population structure using the program STRUCTURE1 indicates considerably more substructure amongst global populations (estimate for the number of genetic clusters, K, is 12) and amongst African populations (K = 9) than had previously been recognized2. Population clusters are correlated with self-described ethnicity and shared cultural and/or linguistic properties (e.g. Pygmies, Khoisan-speakers, Bantu-speakers, etc). African Americans have predominantly West African Bantu (~80%) and European (~17%) ancestry, although individual admixture levels vary considerably. These results justify the need to include a broad range of geographically and ethnically diverse African populations in studies of human genetic variation. 1Pritchard JK, et al. Genetics 155:945-59 (2000) 2Rosenberg NA, et al. Science 298:2381- 5 (2002).Patterns of admixture in Latino populations
We examined the diversity of 13 Latino populations from seven countries (Mexico, Guatemala, Costa Rica, Colombia, Chile, Argentina and Brazil) typing 745 autosomal microsatellite markers in 250 individuals. Estimates of genetic ancestry for these populations varied substantially. Native American ancestry varied between 19.6% and 70.3%, European ancestry between 26.9% and 70.6%, and African ancestry between 1.1% and 9.8%. Genetic structure analysis provides evidence of a genetic continuity between pre- and post-Columbian populations for specific geographic regions. For instance, a Chibchan-Paezan ancestry is detectable in Latinos from lower Central America and northwest South America. Individual admixture estimates vary considerably between populations. Some Latinos (e.g. Mexico City) show marked variation in individual admixture, whereas others (e.g. Antioquia and Costa Rica) show little variation. This variation is likely to reflect the history of admixture of each geographic region examined: some Latino populations are still undergoing substantial admixture whereas others underwent admixture mostly in early colonial times. These results have important implications for admixture mapping and association mapping studies in Latino populations.
Genomic diversity and population structure of Native Americans
We examined 745 autosomal microsatellite markers in 432 individuals sampled from 24 indigenous populations in the Americas. These data were analyzed jointly with similar data available in 54 other indigenous populations from across the world (including an additional 5 Native American groups). The populations from the Americas show lower diversity and more differentiation than populations from other continental regions (global Fst=0.08). Signals of long-range linkage disequilibrium are detectable to a greater extent in Native Americans than in other populations, as are signals of recent bottlenecks followed by population growth. A negative correlation is observed between population diversity and geographic distance from the Bering Strait, an observation consistent with the north-to-south dispersal of humans upon initial entry into the continent. A higher diversity is observed in western vs. eastern South American populations, potentially reflecting differences in long-term effective population size or in colonization routes within South America. Phylogenetic trees relating Native American populations show a marked differentiation between Canadian and other Native populations. Canadian natives also show a detectable shared ancestry with contemporary Siberian populations, which is less visible for more southerly Americans. A substantial agreement is observed between phylogenetic relatedness and population affiliation according to the linguistic classification of Greenberg.
The rare nonsynonymous SCN5A-S1103Y variant in Caucasians is due to recent African Admixture as revealed by 100k SNP genotyping.
The SCN5A-S1103Y variant is an established and confirmed risk factor conferring an odds ratio up to 8.5 for cardiac ventricular arrhythmias and sudden cardiac death (Splawski et al, Science, 2002, Burke et al., Circulation, 2005, Plant et al., J. Clin. Invest. 2006). In Africans it is a common nonsynonymous SNP (MAF=8%), but it is rarely observed in Caucasians (Chen et al, J. Med. Genet. 2002). In a Bavarian family appearing of entirely Caucasian descent and affected with long QT Syndrome we have detected this variant in heterozygote state as the only causal nonsynonymous variation upon diagnostic ion channel resequencing. To resolve the question, whether in the family the variant was (a) of ancient African descent, (b) due to recent African admixture or (c) a de novo mutation, we analyzed the genetic segment it resided on. Dense SNP genotyping in admixed individuals allows to infer the ethnicity of chromosomal regions if allele frequencies are known in the original populations. Ethnicity inference for any given locus can be carried out by applying the product rule to a sliding window of neighboring SNPs or via modeling ancestry by hidden Markov Chain Monte Carlo Methods (Tang et al. Am. J. Hum. Genet, 2006). By 100k SNP genotyping of the Bavarian family, we demonstate that the S1103 variant is due to recent African admixture (b) and could rule out possibilities (a) and (c). This application demonstrates that inferring ethnicity of chromosomal regions by high density SNP genotyping is a powerful approach with prospects also to admixture mapping of disease loci and population stratification correction of genomewide association mapping of complex disease loci.
Allele frequency estimates from DNA pools for 317,000 SNPs for multiple European and worldwide populations and discovery of Ancestry Informative Markers for Europe.
The identification of Ancestry Informative Markers (AIMs) and inference of individual genetic history is useful in many applications, including studies of geography and evolution of human populations, forensic sciences, pharmacogenomics, admixture mapping and association studies of complex diseases. While many AIMs have been reported that define strong genetic differences between major continents, it is more difficult to identify markers that reflect subtle, within-continent diversity, such as the heterogeneous ancestry of European Americans contributed by different populations within Europe. We have analyzed DNA pools, each for a different population, on Illumina HumanHap300 BeadArrays to estimate allele frequencies for ~317,000 Single Nucleotide Polymorphisms for 9 European, 6 African, and 2 Amerindian populations in the Human Genome Diversity Project collection. We have also evaluated the performance of this method by analyzing three HapMap pools (YRI, CHB, and JPT), for which the true allele frequencies are already known from the International HapMap Project. We found that the allele frequency estimates differed between replicate chips by less than +/-5% for 95% of the SNPs, and that the estimated frequencies and the true frequencies differed by +/-5-10% for 90% of the SNPs. The data for nine European populations, from western Caucasus, Scotland, Tuscany, Sardinia, France, Iberia, Russia, Northern Italy, and a Basque region, showed a clear excess of SNPs having large allele frequency differences (e.g. >30%) between most pairs of populations, compared to what would be expected given the sample sizes. These results provide a valuable resource of European AIMs for monitoring within-continent stratification in association studies. We are currently validating the most informative SNPs by individually genotyping samples that formed the pools as well as those from additional European populations.
Mitochondrial haplogroups are associated with asthma and total serum IgE levels
Maternal history of asthma and/or atopy is a major risk factor for the subsequent development of asthma and allergy in childhood. Although mitochondrial mutations have been implicated in several maternally inherited monogenic disorders, no studies of mitochondrial polymorphisms and asthma have been reported.Weevaluated whether common mitochondrial haplogroups are associated with asthma and total serum IgE levels. 8 common mitochondrial single nucleotide polymorphisms (mtSNP) were genotyped in two cohorts of European ancestry: 512 adult women with incident asthma and 517 matching controls participating in the Nurses’ Health Study (NHS) and 654 children ages 5-12 years with mild to moderate asthma participating in the Childhood Asthma Management Program (CAMP). Genotyping was performed using TaqMan® probe hybridization assays. 93 random NHS samples were run in duplicate for all assays and demonstrated 100% concordance. In the CAMP Study, genotype data from probands’ mothers was also 100% concordant across all assays. Completion rates in both cohorts were > 95% for all markers. mtSNP 9055 was seen at higher frequency in NHS asthma cases (frequency 11.1%) than controls (8.0%, p = 0.02). Association analysis using haplo.score identified two haplogroups associated with asthma: one haplogroup at a frequency of 3.83% among cases compared to 1.27% among controls (p=0.0002) and another at a frequency of 9.97% among cases and 11.3% among controls (p=0.04). The CAMP Study is a case-only (family-based) cohort, thus precluding evaluation of mitochondrial SNP associations with asthma status. However, quantitative analysis of mitochondrial haplogroups identified two haplogroups of 11.0% and 1.87% frequency that were associated with log-transformed total serum IgE levels, an important intermediate phenotype in asthma and atopy (p=0.006 and 0.01, respectively). These data suggest that common mitochondrial haplogroups influence asthma diathesis.
November 05, 2006
Actual vs. Observable Criminality
Inspired from this Telegraph story:
Race watchdogs are to investigate the national DNA database over revelations that up to three quarters of young black men will soon have their profiles stored.We should remember that a group's observed criminality is a function of their propensity for criminality as well as the authorities' propensity to investigate members of the group. I suspect that differences in average criminality (perhaps related to personality differences between groups) result in a (correct) perception that an individual of group A has a higher probability of engaging in some type of criminal activity than an individual of group B. This perception then leads one to investigate more thoroughly persons of group A, thus leading to a greater observable criminality for group A.
Trevor Phillips, the chairman of the Commission for Racial Equality (CRE), vowed to examine whether the database breached race relations laws following the findings by The Sunday Telegraph. "This is tantamount to criminalising a generation of young black men," he said.
An estimated 135,000 black males aged 15 to 34 will be entered in the crime-fighting- database by April, equivalent to as many as 77 per cent of the young black male population in England and Wales. By contrast, only 22 per cent of young white males, and six per cent of the general population, will be on the database.
Suppose that 60% of car thefts in a city are done by Blues. The police is then justified in thinking of Blues as more likely to steal cars than Greens. If a car theft takes place, and given two suspects, a Blue and a Green, and given a limited number of police resources, the smarter choice is to investigate the Blue individual.
Suppose that the police has enough resources to investigate 1 suspect 50% of the time, and both suspects 50% of the time. Then, 50% of the time they would investigate both suspects and catch the perpetrator (30% Blues and 20% Greens), but 50% of the time they will only investigate the Blue one leading to an arrest of a Blue one in 30% of the cases.
Thus, in total there will be 60% Blues and 20% Greens that were arrested, i.e., a difference in actual criminality of 1.5x was transformed into a 3x observed one. Moreover, 80% of the total criminals would be arrested with a race-conscious policy.
Suppose now that a race-blind policy is enacted. Now, for the 50% of the time where they can only investigate 1 suspect, they pick his race randomly and with equal probability. Now they will expect to catch a Blue criminal whenever a Blue committed the crime and they happened to investigate the Blue suspect (15%) and similarly a Green one (10%). So, with a race-blind policy 75% of the total criminals would be arrested.
This illustrates the problem: using the information encoded in the "race" variable leads to more efficient crime fighting: more criminals are caught. However, it also leads to a upwardly biased estimate of the criminality of the more criminal group.
In my opinion, society should not throw away information encoded in sex, race, ethnicity, etc. in fighting crime. That is the rational choice to maximize justice. However, it should also be aware that this rational group-conscious policy biases our perception.
PS: The relevant statistics for particular human group differences, including those cited by the Telegraph, are not important for the argument presented above. I am agnostic about both the magnitude in actual criminality between different groups (e.g., men vs. women, Muslims vs. Buddhists, blacks vs. Mongoloids, etc.) as well as the potential racial biases (above and beyond the rational group-conscious choice), or racial political correctness that may further inflate/deflate observable differences.
November 03, 2006
Y chromosomes of Czech Republic
 From the paper:
The position of Czech samples in the genetic landscape of central Europe emerges in Correspondence Analysis (Fig. 2). In the first dimension the Czech samples are clustered and positioned in between the Polish and German samples. In fact Hg’s R1a and N3-Tat (more frequent in Poland) have the largest negative loadings on this dimension, whereas Hg’s K*-M9 and J2*-M172 (more frequent in Germany and Italy) have the largest positive ones. The second dimension is mainly contributed by Hg’s I-M170, E3b1-M78, and K*-M9 (negative loadings) vs. Hg P-DYS257*(xR1a). Thus, the position of the three Balkan populations in Figure 2 is in line with the focal distribution of Hg’s I and E3b1 in this area (Cruciani et al., 2004; Pericic et al., 2005).
These seem to agree with my observations regarding a recent study on Germans and Poles:
We see that Poles are differentiated by Germans on the basis of R1a1 and N3 (Finno-Ugrian admixture). The differentiation on the basis of I subgroups is not evident, because no downstream markers for this haplogroup were examined in this study.as well as the observational evidence.
Also of particular interest is that of the two Neolithic haplogroups, J2 is associated with Germans, whereas DE* is apparently not. So, this may hint at different patterns of arrival of the two haplogroups in this part of the world. This would agree with some recent results from Balkan Slavic populations, that typically found a higher-percentage of YAP (DE) lineages than J2 ones.
American Journal of Physical Anthropology (online early)
Y-chromosomal variation in the Czech Republic
F. Luca et al.
Abstract
To analyze the contribution of the Czech population to the Y-chromosome diversity landscape of Europe and to reconstruct past demographic events, we typed 257 males from five locations for 21 UEPs. Moreover, 141 carriers of the three most common haplogroups were typed for 10 microsatellites and coalescent analyses applied. Sixteen Hg's characterized by derived alleles were identified, the most common being R1a-SRY10831 and P-DYS257*(xR1a). The pool of haplogroups within I-M170 represented the third most common clade. Overall, the degree of population structure was low. The ages for Hg I-M170, P-DYS257*(xR1a), and R1a-SRY10831 ap peared to be comparable and compatible with their presence during or soon after the LGM. A signal of population growth beginning in the first millennium B.C. was detected. Its similarity among the three most common Hg's indicated that growth was characteristic for a gene pool that already contained all of them. The Czech population appears to be influenced, to a very moderate extent, by genetic inputs from outside Europe in the post-Neolithic and historical times. Population growth postdated the archaeologically documented introduction of Neolithic technology and the estimated central value coincides with a period of repeated changes driven by the development of metal technologies and the associated social and trade organization.
Link
November 01, 2006
Genetic impact of the caste system in India
This article has appeared in PubMed but not yet posted on the Human Genetics website.
Hum Genet. 2006 Oct 31; [Epub ahead of print]
Y-chromosomal insights into the genetic impact of the caste system in India.
Zerjal T, Pandya A, Thangaraj K, Ling EY, Kearley J, Bertoneri S, Paracchini S, Singh L, Tyler-Smith C.
The caste system has persisted in Indian Hindu society for around 3,500 years. Like the Y chromosome, caste is defined at birth, and males cannot change their caste. In order to investigate the genetic consequences of this system, we have analysed male-lineage variation in a sample of 227 Indian men of known caste, 141 from the Jaunpur district of Uttar Pradesh and 86 from the rest of India. We typed 131 Y-chromosomal binary markers and 16 microsatellites. We find striking evidence for male substructure: in particular, Brahmins and Kshatriyas (but not other castes) from Jaunpur each show low diversity and the predominance of a single distinct cluster of haplotypes. These findings confirm the genetic isolation and drift within the Jaunpur upper castes, which are likely to result from founder effects and social factors. In the other castes, there may be either larger effective population sizes, or less strict isolation, or both.
Link
Machiavellian intelligence hypothesis
Yann points me to a new PNAS article.
Proc. Natl. Acad. Sci. USA, 10.1073/pnas.0601428103
The dynamics of Machiavellian intelligence
Sergey Gavrilets and Aaron Vose
The "Machiavellian intelligence" hypothesis (or the "social brain" hypothesis) posits that large brains and distinctive cognitive abilities of humans have evolved via intense social competition in which social competitors developed increasingly sophisticated "Machiavellian" strategies as a means to achieve higher social and reproductive success. Here we build a mathematical model aiming to explore this hypothesis. In the model, genes control brains which invent and learn strategies (memes) which are used by males to gain advantage in competition for mates. We show that the dynamics of intelligence has three distinct phases. During the dormant phase only newly invented memes are present in the population. During the cognitive explosion phase the population’s meme count and the learning ability, cerebral capacity (controlling the number of different memes that the brain can learn and use), and Machiavellian fitness of individuals increase in a runaway fashion. During the saturation phase natural selection resulting from the costs of having large brains checks further increases in cognitive abilities. Overall, our results suggest that the mechanisms underlying the "Machiavellian intelligence" hypothesis can indeed result in the evolution of significant cognitive abilities on the time scale of 10 to 20 thousand generations. We show that cerebral capacity evolves faster and to a larger degree than learning ability. Our model suggests that there may be a tendency toward a reduction in cognitive abilities (driven by the costs of having a large brain) as the reproductive advantage of having a large brain decreases and the exposure to memes increases in modern societies.
Link
The Lancet publishes global sex survey
Scientific American reports:
And from WebMD:
Some of the primary findings of this meta-analysis are unsurprising: Monogamy is the dominant sexual pattern globally. Married individuals--which constitute most people studied--have the most sex. Men report having engaged in sex with more partners than women in a given year. Instances of males with multiple partners, however, were more frequent in industrialized nations, Wellings says, than in places such as Africa, where sexual health education is relatively unsophisticated. "We certainly expected to see that in African countries there would be an equal prevalence of multiple partnerships," she says. "I don't think we expected to see less reporting of them."
That is just one of many surprises found in the meta-analysis. Contrary to popular belief, there is no evidence that young people are engaging in sexual intercourse at earlier ages--the first instance of sexual activity for both genders generally occurs at between 15 and 19 years of age globally. "There's always a tendency to think that things are going to 'hell in a handbasket,'" remarks Richard Parker, the sociomedical sciences department chair at Columbia University's Mailman School of Public Health. "A lot of what we say we think about trends in sexual behavior are basically kind of knee-jerk, impressionistic conclusions that we make, rather than because we looked at the data." Another surprising finding is that married women are actually at greater risk of unhealthy sexual behavior-they find it harder than single women do to convince their partners to use condoms.
One optimistic finding is that condom use is up worldwide. From 1993 to 2001, in 19 African countries, the rate of condoms employed to prevent pregnancy increased from five to 19 percent of the time; at the last instance of intercourse, the increase was from 19 percent to 28 percent. Wellings explains, however, that "there are parts of this that are reassuring and parts that are not: If you look at the [cross-national] data on condom use, you then see a big difference between the richer and poorer countries." Although numbers have improved in less developed parts of the world, condom use still lags far behind industrialized nations. "The protection of risk behavior is less prevalent in the poorer countries," she says.
And from WebMD:
Some of the survey's major findings:
# While there is no major trend toward earlier sexual experience, a trend toward later marriage has led to an increase in premarital sex.
# Married people have more sex than unmarried people do.
# Sexual activity among single people is more common in industrialized countries than in developing countries.
# First sexual experience is often forced or sold.
# Monogamy is the dominant pattern in most parts of the world. Men report more multiple partnerships than do women. Such men are more likely to live in developed nations.
# Marriage is no safeguard of sexual health. It is more difficult for married women to negotiate safe sex and condom use than it is for single women.
# Among girls who marry at a very young age, "very early sexual experience within marriage can be coercive and traumatic."
# Condom use is increasing, but condom-use rates remain low in many developing countries.
# Public health measures to improve sexual health should focus not only on individual behaviors but also on broader issues such as gender, poverty, and mobility.
# Public-health messages intended to reduce sexual risk-taking "should respect diversity and preserve choice."
# School-based sexual education delays and does not hasten onset of sexual activity.
Chess and Intelligence
A casual reading of this abstract might give the wrong impression that intelligence is not necessary for achievement in chess. However, the actual results are that chess players, and even more, elite chess players have substantially higher intelligence than average. However, given that someone is a chess player, the researchers found that their ability, measured by a "chess test" or an international testing was not very significantly predicted by their general intelligence. Thus, we may say that intelligence seems to be a necessary pre-condition for chess achievement, but other factors tend to predict the chess ability of those who are intelligent enough to be good at chess.
Intelligence (online early)
Does chess need intelligence? — A study with young chess players
Merim Bilalić et al.
Abstract
Although it is widely acknowledged that chess is the best example of an intellectual activity among games, evidence showing the association between any kind of intellectual ability and chess skill has been remarkably sparse. One of the reasons is that most of the studies investigated only one factor (e.g., intelligence), neglecting other factors relevant for the acquisition of chess skill (e.g., amount of practice, years of experience). The present study investigated the chess skill of 57 young chess players using measures of intelligence (WISC III), practice, and experience. Although practice had the most influence on chess skill, intelligence explained some variance even after the inclusion of practice. When an elite subsample of 23 children was tested, it turned out that intelligence was not a significant factor in chess skill, and that, if anything, it tended to correlate negatively with chess skill. This unexpected result is explained by a negative correlation between intelligence and practice in the elite subsample. The study demonstrates the dangers of focusing on a single factor in complex real-world situations where a number of closely interconnected factors operate.
Link
Subscribe to:
Posts (Atom)