December 29, 2009

Imperfection of the Molecular Clock of Hominid Mitochondria (Loogväli et al. 2009)

Another paper which shows that post-Last Ice Age mtDNA evolution did not proceed "slowly", i.e., with a rate similar to that inferred from human-chimpanzee divergence. As the authors note, the mechanism for the "slow" mutation rate, i.e. purifying selection of deleterious mtDNA mutations was "sluggish".

Note also how post-Last Ice Age population expansions are responsible for the weakness of purifying selection: as populations expand, even slightly deleterious alleles (and even non-deleterious ones) have a higher chance of surviving in a population. Genetic diversity increases faster in an expanding than in a static population.

From the paper:
In conclusion, human mitochondrial DNA clock is time-dependent mainly because of the time-dependence of purifying selection. There is also evidence that purifying selection has been counteracted by other population genetic factors during the course of human history. Our results imply that the proportion of synonymous substitutions has alternated between growth and decrease. This interpretation is strengthened given the shape of the human mtDNA tree, which reflects the bottlenecks and subsequent population expansions associated with the out-of-Africa migration and the hectic climatic conditions of the last glacial period. The wavy growth of the proportion of synonymous substitutions implies biases in the published correction of the mtDNA clock, which assumed a monotonic growth curve [15]. Therefore, the clock of synonymous substitutions should be preferred. In addition, it seems that a good consensus has been achieved on the rate of accumulation of synonymous substitutions in human mtDNA, which applies at the population as well as the interspecies level (this study, [15]).
[15] is Soares et al. (see below)

Related:
PLoS ONE doi:10.1371/journal.pone.0008260

Explaining the Imperfection of the Molecular Clock of Hominid Mitochondria

Eva-Liis Loogväli et al.

Abstract

The molecular clock of mitochondrial DNA has been extensively used to date various genetic events. However, its substitution rate among humans appears to be higher than rates inferred from human-chimpanzee comparisons, limiting the potential of interspecies clock calibrations for intraspecific dating. It is not well understood how and why the substitution rate accelerates. We have analyzed a phylogenetic tree of 3057 publicly available human mitochondrial DNA coding region sequences for changes in the ratios of mutations belonging to different functional classes. The proportion of non-synonymous and RNA genes substitutions has reduced over hundreds of thousands of years. The highest mutation ratios corresponding to fast acceleration in the apparent substitution rate of the coding sequence have occurred after the end of the Last Ice Age. We recalibrate the molecular clock of human mtDNA as 7990 years per synonymous mutation over the mitochondrial genome. However, the distribution of substitutions at synonymous sites in human data significantly departs from a model assuming a single rate parameter and implies at least 3 different subclasses of sites. Neutral model with 3 synonymous substitution rates can explain most, if not all, of the apparent molecular clock difference between the intra- and interspecies levels. Our findings imply the sluggishness of purifying selection in removing the slightly deleterious mutations from the human as well as the Neandertal and chimpanzee populations. However, for humans, the weakness of purifying selection has been further exacerbated by the population expansions associated with the out-of Africa migration and the end of the Last Ice Age.

Link

December 28, 2009

Το προσχέδιο νόμου για την πολιτογράφηση των μεταναστών σε διαβούλευση στο opengov.gr

Όλοι πάμε στο opengov.gr σχολιάζουμε με σοβαρότητα άρθρο προς άρθρο, απαντούμε σε όσους έχουν αντίθετη άποψη, και ζητάμε για ένα τόσο σοβαρό κοινωνικό ζήτημα να εγκρίνει την πρωτοβουλία της Κυβέρνησης ο λαός με δημοψήφισμα.

Κάντε κλικ στην εικόνα για να πάρετε έγκυρη πληροφόρηση και επιχειρήματα εναντίον της μεταρρύθμισης. Κάθε νέα πληροφορία θα προστίθεται σε νέο ποστ και συγκεντρωτικά σε αυτή τη διεύθυνση.

Οι πολίτες παίρνουν την υπόθεση στα χέρια τους! Όχι ιθαγένεια και ψήφος στους πάντες χωρίς ουσιαστικές προϋποθέσεις!

Προσοχή: η διαβούλευση διαρκεί έως τις 7/1/2010.

Y chromosomes of Dagestan highlanders

Journal of Human Genetics 54, 689–694 (1 December 2009) | doi:10.1038/jhg.2009.94

The key role of patrilineal inheritance in shaping the genetic variation of Dagestan highlanders

Laura Caciagli

Abstract

The Caucasus region is a complex cultural and ethnic mosaic, comprising populations that speak Caucasian, Indo-European and Altaic languages. Isolated mountain villages (auls) in Dagestan still preserve high level of genetic and cultural diversity and have patriarchal societies with a long history of isolation. The aim of this study was to understand the genetic history of five Dagestan highland auls with distinct ethnic affiliation (Avars, Chechens-Akkins, Kubachians, Laks, Tabasarans) using markers on the male-specific region of the Y chromosome. The groups analyzed here are all Muslims but speak different languages all belonging to the Nakh-Dagestanian linguistic family. The results show that the Dagestan ethnic groups share a common Y-genetic background, with deep-rooted genealogies and rare alleles, dating back to an early phase in the post-glacial recolonization of Europe. Geography and stochastic factors, such as founder effect and long-term genetic drift, driven by the rigid structuring of societies in groups of patrilineal descent, most likely acted as mutually reinforcing key factors in determining the high degree of Y-genetic divergence among these ethnic groups.

Link

December 27, 2009

mtDNA haplogroup C4c as a founding lineage in the Americas

American Journal of Physical Anthropology doi:10.1002/ajpa.21238

Brief communication: Mitochondrial haplotype C4c confirmed as a founding genome in the Americas

Ripan S. Malhi et al.

Abstract

Mitochondrial DNA analysis of 31 unrelated Shuswap speakers from a previously poorly sampled region of North America revealed two individuals with haplogroups rarely found in the Americas, C4c and C1d. Comparison of the complete genomes of the two individuals with others found in the literature confirms that C4c is a founding haplotype and gives insight into the evolution of the C1d haplotype. This study demonstrates the importance of collecting and analyzing data from Native North Americans when addressing hypotheses about the peopling of the Americas.

December 26, 2009

mtDNA evidence for Caucasoid-Mongoloid admixture in Xinjiang 2,500 years ago

Related:
American Journal of Physical Anthropology doi:10.1002/ajpa.21237

Prehistorical East-West admixture of maternal lineages in a 2,500-year-old population in Xinjiang

Fan Zhang et al.

Abstract

As an area of contact between Asia and Europe, Central Asia witnessed a scenario of complex cultural developments, extensive migratory movements, and biological admixture between West and East Eurasians. However, the detanglement of this complexity of diversity requires an understanding of prehistoric contacts of the people from the West and the East on the Eurasia continent. We demonstrated the presence of genetic admixture of West and East in a population of 35 inhabitants excavated in Gavaerk in southern Xinjiang and dated 2,800-2,100 years before present by analyzing their mitochondrial DNA variations. This result indicates that the initial contact of the East and the West Eurasians occurred further east than Central Asia as early as 2,500 years ago.

Link

December 22, 2009

New major study on African ancestry

This looks like a great continuation of the previous study on African structure from the Tishkoff lab. I will add the abstract when it's posted in the PNAS site.

From the press release, Genetic study clarifies African and African-American ancestry:
This newly acquired genetic data revealed a number of important advances, including:
  • The rich mosaic of African-American ancestry. Among the 365 African-Americans in the study, individuals had as little as 1 percent West African ancestry and as much as 99 percent. There are significant implications for pharmacogenomic studies and assessment of disease risk. It appears that the range of genetic ancestry captured under the term African-American is extremely diverse, suggesting that caution should be used in prescribing treatment based on differential guidelines for African-Americans.
  • A median proportion of European ancestry in African-Americans of 18.5 percent, with large variation among individuals.
  • The predominately African origin of X chromosomes of African-Americans. This is consistent with the pattern of gene flow where mothers were mostly of African ancestry while fathers were either of African or European ancestry.
  • A technique which can reliably distinguish African and European ancestry for any particular region of the genome in African-Americans. This could have implications for personalized ancestry reconstructions, personalized medicine and more effective drug treatments and could aid in developing more effective methods for mapping genetic risk factors for diseases common in African-Americans, such as hypertension, diabetes and prostate cancer.
  • The similarity of the West African component of African-American ancestry to the profile from non-Bantu Niger-Kordofanian speaking populations, which include the Igbo and Yoruba from Nigeria and the Brong from Ghana
  • A comparison of the West African segments of African-American genomes. This is wholly in line with historical documents showing that the Igbo and Yoruba are two of the 10 most frequent ethnicities in slave trade records; however, most African-Americans also have ancestry from Bantu-speaking populations in western Africa.
  • Population structure within the West African samples reflecting primarily language and secondarily geographical distance, echoing the Bantu expansion from a homeland in West Africa across much of sub-Saharan Africa around 4,000 years ago.
The paper is open access and is now online.


PNAS doi:10.1073/pnas.0909559107

Genome-wide patterns of population structure and admixture in West Africans and African Americans

Katarzyna Bryc et al.

Abstract

Quantifying patterns of population structure in Africans and African Americans illuminates the history of human populations and is critical for undertaking medical genomic studies on a global scale. To obtain a fine-scale genome-wide perspective of ancestry, we analyze Affymetrix GeneChip 500K genotype data from African Americans (n = 365) and individuals with ancestry from West Africa (n = 203 from 12 populations) and Europe (n = 400 from 42 countries). We find that population structure within the West African sample reflects primarily language and secondarily geographical distance, echoing the Bantu expansion. Among African Americans, analysis of genomic admixture by a principal component-based approach indicates that the median proportion of European ancestry is 18.5% (25th–75th percentiles: 11.6–27.7%), with very large variation among individuals. In the African-American sample as a whole, few autosomal regions showed exceptionally high or low mean African ancestry, but the X chromosome showed elevated levels of African ancestry, consistent with a sex-biased pattern of gene flow with an excess of European male and African female ancestry. We also find that genomic profiles of individual African Americans afford personalized ancestry reconstructions differentiating ancient vs. recent European and African ancestry. Finally, patterns of genetic similarity among inferred African segments of African-American genomes and genomes of contemporary African populations included in this study suggest African ancestry is most similar to non-Bantu Niger-Kordofanian-speaking populations, consistent with historical documents of the African Diaspora and trans-Atlantic slave trade.

Link (pdf)

December 19, 2009

The Ecumenical Patriarch on 60 Minutes

The Ecumenical Patriarch Bartholomew, leader of 300 million Orthodox Christians, feels "crucified" and "second-class " living in Turkey. Bob Simon reports, this Sunday, Dec. 20, at 7 p.m. ET/PT.

Video excerpt (2:27)

Update: The Complete segment


December 17, 2009

New comprehensive study on continental ancestry of Argentineans (Corach et al. 2010)

An interesting find from the study:
Whereas 96% of the individuals with European surnames carried European Y-chromosomes, 50% of the samples from individuals with Amerindian surnames had
European Y chromosomes.
The combined use of Y-chromosome, mtDNA, and autosomal markers in a sample gives us a rare opportunity to see how well inferences of ancestry from uniparental markers matches with that from autosomal ones:

European ancestry in mtDNA (44.3%) and Y-chromosome (94.1%) gives an estimate of 69.2%, compared to 78.6% for autosomal markers. Native S. American in mtDNA (53.7%) and Y-chromosome (4.9%) gives an estimate of 29.3%, compared to 17.28% for autosomal markers. Finally, African mtDNA (2%) and Y-chromosomes (0.9%) gives an estimate of 1.45% compared to 4.15% for the autosomal markers.

It is difficult to guess how much of the difference is due to the small number of markers used, how much is due to the choice of parental populations for the admixture estimate (which cannot match perfectly the actual parental populations), and how much is due to the inclusion of pigmentation-related markers which have substantial inter-continental differences, but may have shifted frequencies due to social selection.

Annals of Human Genetics doi:10.1111/j.1469-1809.2009.00556.x

Inferring Continental Ancestry of Argentineans from Autosomal, Y-Chromosomal and Mitochondrial DNA

Daniel Corach et al.

Abstract

We investigated the bio-geographic ancestry of Argentineans, and quantified their genetic admixture, analyzing 246 unrelated male individuals from eight provinces of three Argentinean regions using ancestry-sensitive DNA markers (ASDM) from autosomal, Y and mitochondrial chromosomes. Our results demonstrate that European, Native American and African ancestry components were detectable in the contemporary Argentineans, the amounts depending on the genetic system applied, exhibiting large inter-individual heterogeneity. Argentineans carried a large fraction of European genetic heritage in their Y-chromosomal (94.1%) and autosomal (78.5%) DNA, but their mitochondrial gene pool is mostly of Native American ancestry (53.7%); instead, African heritage was small in all three genetic systems (less than 4%). Population substructure in Argentina considering the eight sampled provinces was very small based on autosomal (0.92% of total variation was between provincial groups, p = 0.005) and mtDNA (1.77%, p = 0.005) data (none with NRY data), and all three genetic systems revealed no substructure when clustering the provinces into the three geographic regions to which they belong. The complex genetic ancestry picture detected in Argentineans underscores the need to apply ASDM from all three genetic systems to infer geographic origins and genetic admixture. This applies to all worldwide areas where people with different continental ancestry live geographically close together.

Link

Facial attractiveness ratios for Caucasoid women

Vision Research doi:10.1016/j.visres.2009.11.003

New “golden” ratios for facial beauty


Pamela M. Pallett et al.

Abstract

In four experiments, we tested the existence of an ideal facial feature arrangement that could optimize the attractiveness of any face given its facial features. Participants made paired comparisons of attractiveness between faces with identical facial features but different eye–mouth distances and different interocular distances. We found that although different faces have varying attractiveness, individual attractiveness is optimized when the face’s vertical distance between the eyes and the mouth is approximately 36% of its length, and the horizontal distance between the eyes is approximately 46% of the face’s width. These “new” golden ratios match those of an average face.

Link

December 15, 2009

Physical appearance predicts personality

The paper is open access.

Personality and Social Psychology Bulletin Vol. 35, No. 12, 1661-1671, DOI: 10.1177/0146167209346309

Personality Judgments Based on Physical Appearance

Laura P. Naumann et al.

Abstract

Despite the crucial role of physical appearance in forming first impressions, little research has examined the accuracy of personality impressions based on appearance alone. This study examined the accuracy of observers’ impressions on 10 personality traits based on full-body photographs using criterion measures based on self and peer reports. When targets’ posture and expression were constrained (standardized condition), observers’ judgments were accurate for extraversion, self-esteem, and religiosity. When targets were photographed with a spontaneous pose and facial expression (spontaneous condition), observers’ judgments were accurate for almost all of the traits examined. Lens model analyses demonstrated that both static cues (e.g., clothing style) and dynamic cues (e.g., facial expression, posture) offered valuable personality-relevant information. These results suggest that personality is manifested through both static and expressive channels of appearance, and observers use this information to form accurate judgments for a variety of traits.

Link

December 11, 2009

Mapping Human Genetic Diversity in Asia

From the press release:
Several genome-wide studies of human genetic diversity have been conducted on European populations. Now, for the first time, these studies have been extended to 73 Southeast Asian (SEA) and East Asian (EA) populations.

In a paper titled, "Mapping Human Genetic Diversity in Asia," published online Science on 10 Dec. 2009, over 90 scientists from the Human Genome Organisation's (HUGO's) Pan-Asian SNP Consortium report that their study conducted within and between the different populations in the Asia continent showed that genetic ancestry was highly correlated with ethnic and linguistic groups.

The scientists also reported a clear increase in genetic diversity from northern to southern latitudes. Their findings also suggest that there was one major inflow of human migration into Asia arising from Southeast Asia, rather than multiple inflows from both southern and northern routes as previously proposed. This indicates that Southeast Asia was the major geographic source of East Asian and North Asian populations.

(A figure illustrating the paper shows plausible routes of pre-historical migration of Asian human populations. According to the study, the PanAsia SNP Initiative, the most recent common ancestors of Asians arrived first in India and later, some of them migrated to Thailand, and South to the lands known today as Malaysia, Indonesia, and the Philippines. The first group of settlers must have gone very far south before they settled successfully. These included the Malay Negritos , Philippine Negritos , the East Indonesians, and early settlers of the Pacific Islands. Thereafter, one or several groups of people migrated North, mixed with previous settlers there and, finally, formed various populations we now refer to as Austronesian, Austro-Asiatic, Tai-Kadai, Hmong-Mien, and Altaic. The figure is titled, "Putative Pre-Historical Migration Routes of Asian Human Populations.")

The researchers noted that the geographical and linguistic basis of genetic subgroups in Asia clarifies the need for genetic stratification when conducting genetic and pharmacogenomic studies in this continent, and that human genetic mapping of Asia has important implications for the study of genetics and disease and for research to understand migratory patterns in human history.

HUGO President Edison Liu, M.D., who is Executive Director of the Genome Institute of Singapore (GIS), said, "This study was a milestone not only in the science that emerged, but the consortium that was formed. Ten Asian countries came together in the spirit of solidarity to understand how we were related as a people, and we finished with a truly Asian scientific community. We overcame shortage of funds and diverse operational constraints through partnerships, good will, and cultural sensitivity.

"Our next goal is to expand this collaboration to all of Asia including Central Asia and the Polynesian Islands," said Dr. Liu, one of the corresponding authors of the paper. "We also aim to be more detailed in our genomic analysis and plan to include structural variations, as well as over a million single nucleotide polymorphisms in the next analysis."

While HUGO initiated and coordinated the research, Dr. Liu pointed out, "Affymetrix, led by Dr. Giulia C. Kennedy and based in the US, is our primary technology partner in this endeavour. We greatly appreciate their support."
As usual for a Science paper there are voluminous (and free) supplementary materials. The Neighbor-Joining tree shows the clear correlation between linguistic affiliation and genetic identity of individuals.


UPDATE: As to the main thesis of the paper, namely that East Asians are descended from Southeast Asians rather than Central Asians, I have to say that I am not convinced. This thesis is based on two observations: minimum sharing between East Asians and Central/South Asians and south-north reduction of genetic diversity in East Eurasians. However, the high genetic diversity in Southeast Asians can be explained if they are taken to be old hybrids of Mongoloid northerners with "Australoid"-like southerners as physical anthropology suggests, and the seeming absence of influence of present-day Central/South Asians is due to the fact that the latter are largely Caucasoids of western Eurasian origin, and, thus, do not represent any putative ancestral populations to modern Mongoloids.

Science
doi:10.1126/science.1177074

Mapping Human Genetic Diversity in Asia

The HUGO Pan-Asian SNP Consortium

Abstract

Asia harbors substantial cultural and linguistic diversity, but the geographic structure of genetic variation across the continent remains enigmatic. Here we report a large-scale survey of autosomal variation from a broad geographic sample of Asian human populations. Our results show that genetic ancestry is strongly correlated with linguistic affiliations as well as geography. Most populations show relatedness within ethnic/linguistic groups, despite prevalent gene flow among populations. More than 90% of East Asian (EA) haplotypes could be found in either Southeast Asian (SEA) or Central-South Asian (CSA) populations and show clinal structure with haplotype diversity decreasing from south to north. Furthermore, 50% of EA haplotypes were found in SEA only and 5% were found in CSA only, indicating that SEA was a major geographic source of EA populations.

Link

December 09, 2009

Jews intermediate between Middle Eastern and European populations (Kopelman et al. 2009)

Fairly interesting that at K=5 a Palestinian cluster emerges, and Jews show mixed affiliations with this cluster and the European one. This is also consistent with the idea that different Jewish populations have a Levantine element in common, and have also undergone admixture with European (or more properly European-like) populations.

A weakness of the study is that it does not look into Gentile populations in the region between Italy and Palestine.

The main issue in Jewish origins is no longer whether they are of Middle Eastern or European (or European-like) origin. It seems pretty clear by now that they are both. The main issue is to determine the origin of their Middle Eastern and European components. This study does offer some new insight by showing the affinity between Jews and Palestinians at K=5 (purple); however the origin of the European (or European-like) component remains elusive.


BMC Genetics 2009, 10:80 doi:10.1186/1471-2156-10-80

Genomic microsatellites identify shared Jewish ancestry intermediate between
Middle Eastern and European populations


Naama M Kopelman et al.

Abstract
Background: Genetic studies have often produced conflicting results on the
question of whether distant Jewish populations in different geographic locations
share greater genetic similarity to each other or instead, to nearby non-Jewish
populations. We perform a genome-wide population-genetic study of Jewish
populations, analyzing 678 autosomal microsatellite loci in 78 individuals from four
Jewish groups together with similar data on 321 individuals from 12 non-Jewish
Middle Eastern and European populations.
Results: We find that the Jewish populations show a high level of genetic similarity
to each other, clustering together in several types of analysis of population structure.
Further, Bayesian clustering, neighbor-joining trees, and multidimensional scaling
place the Jewish populations as intermediate between the non-Jewish Middle
Eastern and European populations.
Conclusion: These results support the view that the Jewish populations largely
share a common Middle Eastern ancestry and that over their history they have
undergone varying degrees of admixture with non-Jewish populations of European
descent.

December 06, 2009

Kinship, marriage, and the genetics of past human dispersals (Bentley et al. 2009)

Hum Biol. 2009 Apr;81(2-3):159-79

Kinship, marriage, and the genetics of past human dispersals.

Bentley RA, Layton RH, Tehrani J

Abstract The extent to which colonizing farmer populations have overwhelmed or "replaced" indigenous forager populations, as opposed to having intermarried with them, has been widely debated. Indigenous-colonist "admixture" is often represented in genetic models as a single parameter that, although parsimonious and simple, is incongruous with the sex-specific nature of mtDNA and Y-chromosome data. To help interpret genetic patterns, we can construct useful null hypotheses about the generalized migration history of females (mtDNA) as opposed to males (Y chromosome), which differ significantly in almost every ethnographically known society. We seek to integrate ethnographic knowledge into models that incorporate new social parameters for predicting geographic patterns in mtDNA and Y-chromosome distributions. We provide an example of a model simulation for the spread of agriculture in which this individual-scale evidence is used to refine the parameters.

Link

December 05, 2009

Y chromosome and mtDNA of Udegeys

American Journal of Physical Anthropology doi:10.1002/ajpa.21232

Genetic diversity of two haploid markers in the Udegey population from southeastern Siberia


Han-Jun Jin et al.

Abstract

The Udegeys are a small ethnic group who live along the tributaries of the Amur River Basin of southeastern Siberia in Russia. They are thought to speak a language belonging to a subdivision of the Tungusic-Manchu branch of the Altaic family. To understand the genetic features and genetic history of the Udegeys, we analyzed two haploid markers, mitochondrial DNA (mtDNA), and Y-chromosomal variation, in 51 individuals (including 21 males) from the Udegey population. In general, the Udegeys' mtDNA profiles revealed similarities to Siberians and other northeastern Asian populations, although a moderate European contribution was also detected. Interestingly, pairwise values of FST and the MDS plots based on the mtDNA variation showed that the Orok and Nivkh inhabiting the very same region of the Udegey were significantly different from the Udegey, implying that they may have been isolated and undergone substantial genetic drift. The Udegeys were characterized by a high frequency (66.7%) of Y chromosome haplogroup C, indicating a close genetic relationship with Mongolians and Siberians. On the paternal side, however, very little admixture was observed between the Udegeys and Europeans. Thus, the combined haploid genetic markers of both mtDNA and the Y chromosome imply that the Udegeys are overall closest to Siberians and northeast Asians of the Altaic linguistic family, with a minor maternal contribution from the European part of the continent.

Link

December 04, 2009

mtDNA continuity between Bronze Age and some modern Sardinians

Molecular Biology and Evolution, doi:10.1093/molbev/msp292

Inferring Genealogical Processes from Patterns of Bronze-Age and Modern DNA variation in Sardinia

Silvia Ghirotto et al.

Abstract

The ancient inhabitants of a region are often regarded as ancestral, and hence genetically related, to the modern dwellers (for instance, in studies of admixture), but so far this assumption has not been tested empirically using ancient DNA data. We studied mitochondrial DNA variation in Sardinia, across a time span of 2,500 years, comparing 23 Bronze-Age (nuragic) mitochondrial DNA sequences with those of 254 modern individuals from two regions, Ogliastra (a likely genetic isolate) and Gallura, and considering the possible impact of gene flow from mainland Italy. To understand the genealogical relationships between past and present populations we developed seven explicit demographic models; we tested whether these models can account for the levels and patterns of genetic diversity in the data, and which one does it best. Extensive simulation based on a serial coalescent algorithm allowed us to compare the posterior probability of each model and estimate the relevant evolutionary (mutation and migration rates) and demographic (effective population sizes, times since population splits) parameters, by Approximate Bayesian Computations. We then validated the analyses by investigating how well parameters estimated from the simulated data can reproduce the observed data set. We show that a direct genealogical continuity between Bronze-Age Sardinians and the current people of Ogliastra, but not Gallura, has a much higher probability than any alternative scenarios, and that genetic diversity in Gallura evolved largely independently, owing in part to gene flow from the mainland.

Link

December 03, 2009

Biological basis for musical scales

I find it fascinating that the two highest ranked scales are precisely the two ones allowed by Plato for his Republic:
Quite the reverse, he replied; and if so the Dorian and the Phrygian are the only ones which you have left.

I answered: Of the harmonies I know nothing, but I want to have one warlike, to sound the note or accent which a brave man utters in the hour of danger and stern resolve, or when his cause is failing, and he is going to wounds or death or is overtaken by some other evil, and at every such crisis meets the blows of fortune with firm step and a determination to endure; and another to be used by him in times of peace and freedom of action, when there is no pressure of necessity, and he is seeking to persuade God by prayer, or man by instruction and admonition, or on the other hand, when he is expressing his willingness to yield to persuasion or entreaty or admonition, and which represents him when by prudent conduct he has attained his end, not carried away by his success, but acting moderately and wisely under the circumstances, and acquiescing in the event. These two harmonies I ask you to leave; the strain of necessity and the strain of freedom, the strain of the unfortunate and the strain of the fortunate, the strain of courage, and the strain of temperance; these, I say, leave.

And these, he replied, are the Dorian and Phrygian harmonies of which I was just now speaking.

Then, I said, if these and these only are to be used in our songs and melodies, we shall not want multiplicity of notes or a panharmonic scale?

I suppose not.
CORRECTION: A reader correctly points out in the comments that the names of musical scales are a bit ambivalent, so I looked into the paper itself. By "Dorian" they mean do-re-mib-fa-sol-la-sib-do which corresponds to the ancient Phrygian mode (the peace-like one according to Plato). The ancient Dorian mode (the war-like one according to Plato) seems to correspond to the "Phrygian" one. So, as far as I can tell, the highest ranked is the ancient Dorian and the next highest-ranked is the ancient Phrygian one, but any music experts are free to chime in and correct me.

From the paper:
The 50 heptatonic scales with the highest mean percentage similarity among the >4×10⁷ possible scales evaluated are shown in Table 3. Three of the seven heptatonic modes (see Figure 1) emerge at the top of this list. The Phrygian mode holds the highest rank followed by the Dorian mode and the Ionian mode (the major scale). The fourth ranked scale is similar to the Phrygian mode but contains a neutral second (12:11) instead of a minor second; this collection is the Husayni scale in Arabic music [27]. The Aeolian mode (the natural minor scale) and Lydian mode are the fifth and sixth ranked scales. The next three scales are similar to the Dorian mode but with slight alterations in one or two scale degrees. The seventh ranked scale may represent the Kafi scale in classical Indian music with an alternative sharp sixth scale degree [22]. The eighth ranked scale is the Kardaniya scale in Arabic music [op cit.]. Although the ninth ranked scale does not represent any well-known musical tone collection, the Mixolydian mode is ranked tenth. The Locrian, which is the least used of the Western modes, is ranked fiftieth. Thus both the five-note and seven-note scales preferred in much music worldwide comprise intervals that conform optimally to a harmonic series.

and:
In humans, vocal stimuli arise in a variety of complex ways, not all of which are harmonic. Harmonic series depend on vocal fold vibrations and are characteristic of the “voiced speech” responsible for vowel sounds and some consonants [1]. Although the relative amplitudes of harmonics are altered by filtering effects of the supralaryngeal vocal tract resonances to produce different vowel phones, the frequencies of harmonics remain unchanged [op cit.]. In consequence, the presence of a harmonic series is a salient feature of human vocalizations and essential to human speech and language. It follows that the similarity of musical intervals to harmonic series provides a plausible biological basis for the worldwide human preference for a relatively small number of musical scales defined by their overall similarity to a harmonic series.

PLoS ONE doi:10.1371/journal.pone.0008144

A Biological Rationale for Musical Scales


Kamraan Z. Gill, Dale Purves

Abstract

Scales are collections of tones that divide octaves into specific intervals used to create music. Since humans can distinguish about 240 different pitches over an octave in the mid-range of hearing [1], in principle a very large number of tone combinations could have been used for this purpose. Nonetheless, compositions in Western classical, folk and popular music as well as in many other musical traditions are based on a relatively small number of scales that typically comprise only five to seven tones [2]–[6]. Why humans employ only a few of the enormous number of possible tone combinations to create music is not known. Here we show that the component intervals of the most widely used scales throughout history and across cultures are those with the greatest overall spectral similarity to a harmonic series. These findings suggest that humans prefer tone combinations that reflect the spectral characteristics of conspecific vocalizations. The analysis also highlights the spectral similarity among the scales used by different cultures.

Link

December 01, 2009

Why Some Women Look Young for Their Age (Gunn et al. 2009)

On the left facial composites of younger/older (left/right) monozygotic/dizygotic twins (top/bottom).

PLoS ONE doi:10.1371/journal.pone.0008021

Why Some Women Look Young for Their Age

David A. Gunn et al.

Abstract

The desire of many to look young for their age has led to the establishment of a large cosmetics industry. However, the features of appearance that primarily determine how old women look for their age and whether genetic or environmental factors predominately influence such features are largely unknown. We studied the facial appearance of 102 pairs of female Danish twins aged 59 to 81 as well as 162 British females aged 45 to 75. Skin wrinkling, hair graying and lip height were significantly and independently associated with how old the women looked for their age. The appearance of facial sun-damage was also found to be significantly correlated to how old women look for their age and was primarily due to its commonality with the appearance of skin wrinkles. There was also considerable variation in the perceived age data that was unaccounted for. Composite facial images created from women who looked young or old for their age indicated that the structure of subcutaneous tissue was partly responsible. Heritability analyses of the appearance features revealed that perceived age, pigmented age spots, skin wrinkles and the appearance of sun-damage were influenced more or less equally by genetic and environmental factors. Hair graying, recession of hair from the forehead and lip height were influenced mainly by genetic factors whereas environmental factors influenced hair thinning. These findings indicate that women who look young for their age have large lips, avoid sun-exposure and possess genetic factors that protect against the development of gray hair and skin wrinkles. The findings also demonstrate that perceived age is a better biomarker of skin, hair and facial aging than chronological age.

Link

November 30, 2009

Wet phases in Sahara and migrations in North Africa

This is an open access article.

PNAS doi:10.1073/pnas.0905771106

Wet phases in the Sahara/Sahel region and human migration patterns in North Africa

Isla S. Castañeda et al.

Abstract

The carbon isotopic composition of individual plant leaf waxes (a proxy for C3 vs. C4 vegetation) in a marine sediment core collected from beneath the plume of Sahara-derived dust in northwest Africa reveals three periods during the past 192,000 years when the central Sahara/Sahel contained C3 plants (likely trees), indicating substantially wetter conditions than at present. Our data suggest that variability in the strength of Atlantic meridional overturning circulation (AMOC) is a main control on vegetation distribution in central North Africa, and we note expansions of C3 vegetation during the African Humid Period (early Holocene) and within Marine Isotope Stage (MIS) 3 (≈50–45 ka) and MIS 5 (≈120–110 ka). The wet periods within MIS 3 and 5 coincide with major human migration events out of sub-Saharan Africa. Our results thus suggest that changes in AMOC influenced North African climate and, at times, contributed to amenable conditions in the central Sahara/Sahel, allowing humans to cross this otherwise inhospitable region.

Link

November 29, 2009

45 SNP universal genetic identification

Forensic geneticists currently use the highly polymorphic CODIS microsatellite markers for DNA sample identification. This paper shows that a unique DNA id for a human can be achieved by a panel of 45 SNPs.

Human Genetics doi:10.1007/s00439-009-0771-1

SNPs for a universal individual identification panel

Andrew J. Pakstis et al.

Abstract

An efficient method to uniquely identify every individual would have value in quality control and sample tracking of large collections of cell lines or DNA as is now often the case with whole genome association studies. Such a method would also be useful in forensics. SNPs represent the best markers for such purposes. We have developed a globally applicable resource of 92 SNPs for individual identification (IISNPs) with extremely low probabilities of any two unrelated individuals from anywhere in the world having identical genotypes. The SNPs were identified by screening over 500 likely/candidate SNPs on samples of 44 populations representing the major regions of the world. All 92 IISNPs have an average heterozygosity >0.4 and the F st values are all less than 0.06 on our 44 populations making these a universally applicable panel irrespective of ethnicity or ancestry. No significant linkage disequilibrium (LD) occurs for all unique pairings of 86 of the 92 IISNPs (median LD = 0.011) in all of the 44 populations. The remaining 6 IISNPs show strong LD in most of the 44 populations for a small subset (7) of the unique pairings in which they occur due to close linkage. 45 of the 86 SNPs are spread across the 22 human autosomes and show very loose or no genetic linkage with each other. These 45 IISNPs constitute an excellent panel for individual identification including paternity testing with associated probabilities of individual genotypes less than 10−15, smaller than achieved with the current panels of forensic markers. This panel also improves on an interim panel of 40 IISNPs previously identified using 40 population samples. The unlinked status of the subset of 45 SNPs we have identified also makes them useful for situations involving close biological relationships. Comparisons with random sets of SNPs illustrate the greater discriminating power, efficiency, and more universal applicability of this IISNP panel to populations around the world. The full set of 86 IISNPs that do not show LD can be used to provide even smaller genotype match probabilities in the range of 10−31–10−35 based on the 44 population samples studied.

Link

November 28, 2009

Γιατί ψηφίζουμε Ντόρα Μπακογιάννη στις 29 Νοεμβρίου

Στηρίζουμε Ντόρα Μπακογιάννη, γιατί δεν θέλουμε αύριο η Νέα Δημοκρατία να κυβερνάται από τη δυαρχία των πρώην αρχηγών αποτυχημένων κομμάτων και να έχει ηγετική ομάδα τους Μανώλη/Παπακώστα/Παναγιωτόπουλο/Πιπιλή/Μιχαλολιάκο/Μαρκόπουλο/Γεροντόπουλο/Γκιουλέκα. Στηρίζουμε Ντόρα Μπακογιάννη γιατί δεν θέλουμε να μείνουμε στην αντιπολίτευση ως το 2017 και βλέπουμε. Στηρίζουμε Ντόρα Μπακογιάννη γιατί ήταν μαζί μας στον αγώνα της 4ης Οκτωβρίου ενώ ο Μεσσήνιος Μεσσίας διατηρούσε το προσωπικό του ίματζ άφθαρτο και κρυβόταν στην εκλογική του περιφέρεια. Στηρίζουμε Ντόρα Μπακογιάννη γιατί ζήτησε διάλογο και πήρε άρνηση, δεσμεύτηκε για θητεία και προκριμματικές εκλογές και πήρε "ίσως", βγήκε σε όλα τα μέσα, φίλια και εχθρικά, και δεν κρύφτηκε σε μονολόγους μπροστά σε χειροκροτητές. Στηρίζουμε Ντόρα Μπακογιάννη γιατί δεν κοιτούσε 8 χρόνια τους τοίχους του σπιτιού της. Στηρίζουμε Ντόρα Μπακογιάννη γιατί δεν έκανε 7 ερωτήσεις 3 χρόνια ευρωβουλευτής. Στηρίζουμε Ντόρα Μπακογιάννη γιατί αυτός που πάτωσε το κόμμα του και οδήγησε σε αύξηση της Αριστεράς το 1996 δεν θα δώσει ιδεολογική λάμψη στην Κεντροδεξιά το 2013. Στηρίζουμε Ντόρα Μπακογιάννη γιατί δεν έχει πορεία εκκρεμούς, να είναι υπερβατική κεντρώα το 1993 και Σαρκοζική δεξιά το 2009. Στηρίζουμε Ντόρα Μπακογιάννη γιατί δεν θέλουμε να ξεχάσουμε την ιστορία μας και τους τρεις μας αρχηγούς εναντίον των οποίων κατέβηκε ο Σαμαράς στις εκλογές. Στηρίζουμε Ντόρα Μπακογιάννη γιατί ο Εθνάρχης πέταξε έξω τον Σαμαρά από το Προεδρικό Μέγαρο. Στηρίζουμε Ντόρα Μπακογιάννη γιατί μας έκανε για πρώτη φορά μετά από χρόνια να χαμογελάσουμε για το Σκοπιανό. Στηρίζουμε Ντόρα Μπακογιάννη γιατί το καπρίτσιο του Σαμαρά ανέτρεψε την βούληση τριών εκατομμυρίων Νεοδημοκρατών ψηφοφόρων. Στηρίζουμε Ντόρα Μπακογιάννη γιατί το μεγαλύτερο πολιτικό της επίτευγμα τα τελευταία 15 χρόνια δεν είναι που στερέωσε το πόδι της Ίριδας στο νέο Μουσείο. Για τον Παύλο, για την Ευρυτανία, για το Υπουργείο Πολιτισμού, για την Α' Αθηνών, για το Δήμο Αθηναίων, για το ΥΠΕΞ, για την εργατικότητα της, για την ευφυΐα της, για τη μαχητικότητα της, για την πίστη της, για την αδιάλειπτη παρουσία της σε καλές και κακές στιγμές, Ντόρα Μπακογιάννη στις 29 Νοεμβρίου.

Αποτίμηση αποτελέσματος: 29/11/09: η νέα αρχή για τη Νέα Δημοκρατία

November 27, 2009

Y chromosomes of Andalusians from Huelva

Annals of Human Biology

The Andalusian population from Huelva reveals a high diversification of Y-DNA paternal lineages from haplogroup E: Identifying human male movements within the Mediterranean space.

B. Ambrosio et al.

Abstract

Gene flow among human populations is generally interpreted in terms of complex patterns, with the observed gene frequencies being the consequence of the entire genetic and demographic histories of the population. Aims: This study performs a high-resolution analysis of the Y-chromosome haplogroup E in Western Andalusians (Huelva province). The genetic information presented here provides new insights into migration processes that took place throughout the Mediterranean space and tries to evaluate its impact on the current genetic composition of the most southwestern population of Spain. Subjects and methods: 167 unrelated males were previously typed for the presence/absence of the Y-chromosome Alu polymorphism (YAP). The group of YAP (+) Andalusians was genotyped for 16 Y-SNPs and also characterized for 16 Y-STR loci. Results: The distribution of E-M81 haplogroup, a Berber marker, was found at a frequency of 3% in our sample. The distribution of M81 frequencies in Iberia seems to be not concordant with the regions where Islamic rule was most intense and long-lasting. The study also showed that most of M78 derived allele (6.6%) led to the V13* subhaplogroup. We also found the most basal and rare paragroup M78* and others with V12 and V65 mutations. The lineage defined by M34 mutation, which is quite frequent in Jews, was detected as well. Conclusions: The haplogroup E among Western Andalusians revealed a complex admixture of genetic markers from the Mediterranean space, with interesting signatures of populations from the Middle East and the Balkan Peninsula and a surprisingly low influence by Berber populations compared to other areas of the Iberian Peninsula.

Link

November 26, 2009

Τwo papers on Genetic structure of Han Chinese in AJHG

A couple of new papers on population structure in the Han Chinese have just appeared in the American Journal of Human Genetics. My comments will follow once I read the two papers.

UPDATE (on Chen et al.):

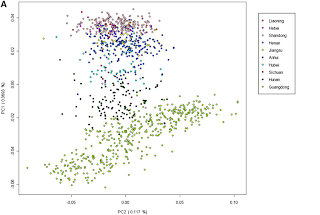
The PCA plot on the left from Chen et al. shows clearly the north-south cline of genetic variation in China. While there are no apparent barriers within the Han ethnic group, it is clear that subsets of Han Chinese can be perfectly distinguished from each other by just looking at the first two principal components.

From the paper:
The one-dimensional subpopulation structure of the Han Chinese population (along PC1) showed a close resemblance to their sampling location son a geographic map, and there is a very high correlation of 0.93 between the mean PC1 values of samples and the median latitudes of the provinces

The results of the STRUCTURE analysis are also very interesting as they show the expected clinality of variation within China rather than sharp distinctions, paralleling the situation in the landmass of Europe. However, at K=3 the major component of the Japanese (JPT) is shown to be a low-level component within the Chinese. It's hard to interpret this, but a first hypothesis could be that the Japanese are descended from an earlier Mongoloid genetic stratum that has since been admixed in the Asian mainland with other Mongoloid groups, but retained its "purity" in the Japanese islands.

The American Journal of Human Genetics, 25 November 2009
doi:10.1016/j.ajhg.2009.10.016

Genetic Structure of the Han Chinese Population Revealed by Genome-wide SNP Variation

Jieming Chen et al.

Abstract

Population stratification is a potential problem for genome-wide association studies (GWAS), confounding results and causing spurious associations. Hence, understanding how allele frequencies vary across geographic regions or among subpopulations is an important prelude to analyzing GWAS data. Using over 350,000 genome-wide autosomal SNPs in over 6000 Han Chinese samples from ten provinces of China, our study revealed a one-dimensional “north-south” population structure and a close correlation between geography and the genetic structure of the Han Chinese. The north-south population structure is consistent with the historical migration pattern of the Han Chinese population. Metropolitan cities in China were, however, more diffused “outliers,” probably because of the impact of modern migration of peoples. At a very local scale within the Guangdong province, we observed evidence of population structure among dialect groups, probably on account of endogamy within these dialects. Via simulation, we show that empirical levels of population structure observed across modern China can cause spurious associations in GWAS if not properly handled. In the Han Chinese, geographic matching is a good proxy for genetic matching, particularly in validation and candidate-gene studies in which population stratification cannot be directly accessed and accounted for because of the lack of genome-wide data, with the exception of the metropolitan cities, where geographical location is no longer a good indicator of ancestral origin. Our findings are important for designing GWAS in the Chinese population, an activity that is expected to intensify greatly in the near future.

Link

The American Journal of Human Genetics, 25 November 2009
doi:10.1016/j.ajhg.2009.10.015

Genomic Dissection of Population Substructure of Han Chinese and Its Implication in Association Studies

Shuhua Xu et al.

Abstract

To date, most genome-wide association studies (GWAS) and studies of fine-scale population structure have been conducted primarily on Europeans. Han Chinese, the largest ethnic group in the world, composing 20% of the entire global human population, is largely underrepresented in such studies. A well-recognized challenge is the fact that population structure can cause spurious associations in GWAS. In this study, we examined population substructures in a diverse set of over 1700 Han Chinese samples collected from 26 regions across China, each genotyped at ∼160K single-nucleotide polymorphisms (SNPs). Our results showed that the Han Chinese population is intricately substructured, with the main observed clusters corresponding roughly to northern Han, central Han, and southern Han. However, simulated case-control studies showed that genetic differentiation among these clusters, although very small (FST = 0.0002 ∼0.0009), is sufficient to lead to an inflated rate of false-positive results even when the sample size is moderate. The top two SNPs with the greatest frequency differences between the northern Han and southern Han clusters (FST > 0.06) were found in the FADS2 gene, which associates with the fatty acid composition in phospholipids, and in the HLA complex P5 gene (HCP5), which associates with HIV infection, psoriasis, and psoriatic arthritis. Ingenuity Pathway Analysis (IPA) showed that most differentiated genes among clusters are involved in cardiac arteriopathy (p less than 10−101). These signals indicating significant differences among Han Chinese subpopulations should be carefully explained in case they are also detected in association studies, especially when sample sources are diverse.

November 25, 2009

Sex-biased admixture in the Americas (Stefflova et al. 2009)


PLoS ONE doi:10.1371/journal.pone.0007842

Evaluation of Group Genetic Ancestry of Populations from Philadelphia and Dakar in the Context of Sex-Biased Admixture in the Americas

Klara Stefflova et al.

Abstract

Background
Population history can be reflected in group genetic ancestry, where genomic variation captured by the mitochondrial DNA (mtDNA) and non-recombining portion of the Y chromosome (NRY) can separate female- and male-specific admixture processes. Genetic ancestry may influence genetic association studies due to differences in individual admixture within recently admixed populations like African Americans.

Principal Findings
We evaluated the genetic ancestry of Senegalese as well as European Americans and African Americans from Philadelphia. Senegalese mtDNA consisted of ~12% U haplotypes (U6 and U5b1b haplotypes, common in North Africa) while the NRY haplotypes belonged solely to haplogroup E. In Philadelphia, we observed varying degrees of admixture. While African Americans have 9–10% mtDNAs and ~31% NRYs of European origin, these results are not mirrored in the mtDNA/NRY pools of European Americans: they have less than 7% mtDNAs and less than 2% NRYs from non-European sources. Additionally, there is Additionally, there is less than 2% Native American contribution to Philadelphian African American ancestry and the admixture from combined mtDNA/NRY estimates is consistent with the admixture derived from autosomal genetic data. To further dissect these estimates, we have analyzed our samples in the context of different demographic groups in the Americas.

Conclusions
We found that sex-biased admixture in African-derived populations is present throughout the Americas, with continual influence of European males, while Native American females contribute mainly to populations of the Caribbean and South America. The high non-European female contribution to the pool of European-derived populations is consistently characteristic of Iberian colonization. These data suggest that genomic data correlate well with historical records of colonization in the Americas.

Link

November 23, 2009

Genetic Variation and Recent Positive Selection with 1 million SNPs

On the left Figure S4 shows PCA and frappe analysis for Eurasia. From the paper:
When just the Central/South Asia, Middle East, North Africa, and European groups are analyzed, PC1 (Fig. S4A) distinguishes the Mozabite (North Africa), Middle East, and Europe groups from the Central/South Asian groups, while PC2 separates the Mozabite and Middle East groups from the Europe groups, with no overlap among individuals from the different North Africa/Middle East/Europe groups. By contrast, there is overlap among individuals from the different Central/South Asia groups; in addition, the Makrani and Sindhi individuals identified in the worldwide analysis as having experienced recent sub-Saharan African admixture are clearly differentiated by PC2. The frappe analysis at K = 5 (Fig. S4B) indicates ancestry components corresponding to the Mozabite, Kalash, Hazara/Uygur, other Central/South Asia, and Europe groups. The three Middle East groups have varying amounts of the Europe, Mozabite, and Central/South Asia ancestry components. The three Italian groups are alone among European groups in having low amounts of the Mozabite ancestry component, possibly indicating gene flow across the Mediterranean. The Sardinians differ from continental European groups in lacking any Asian ancestry component, while the Russians and Adygei differ from other European groups in having appreciable amounts of the Hazara/Uygur and other Central/South Asia ancestry components, respectively, indicating more gene flow and/or ancestry with these groups (Fig. S4B).
Also from the paper, referring to Figure 3 and Figure S3:
Second, many of the subsequent statistically-significant PCs (Fig. 3 and Fig. S3) distinguish among various combinations of the sub-Saharan African groups (or among individuals within such groups), despite the fact that there are only six such groups in the analysis. This disproportionate impact of structure within sub-Saharan Africa on analyses of worldwide genetic diversity clearly emphasizes both the importance of such structure and the great need for further in-depth genetic characterization of sub-Saharan African populations [22]; we would hardly expect that these six groups encompass all of the genetic diversity in sub-Saharan Africa.

PLoS ONE doi:10.1371/journal.pone.0007888

Genetic Variation and Recent Positive Selection in Worldwide Human Populations: Evidence from Nearly 1 Million SNPs

David López Herráez et al.

Abstract

Background
Genome-wide scans of hundreds of thousands of single-nucleotide polymorphisms (SNPs) have resulted in the identification of new susceptibility variants to common diseases and are providing new insights into the genetic structure and relationships of human populations. Moreover, genome-wide data can be used to search for signals of recent positive selection, thereby providing new insights into the genetic adaptations that occurred as modern humans spread out of Africa and around the world.

Methodology
We genotyped approximately 500,000 SNPs in 255 individuals (5 individuals from each of 51 worldwide populations) from the Human Genome Diversity Panel (HGDP-CEPH). When merged with non-overlapping SNPs typed previously in 250 of these same individuals, the resulting data consist of over 950,000 SNPs. We then analyzed the genetic relationships and ancestry of individuals without assigning them to populations, and we also identified candidate regions of recent positive selection at both the population and regional (continental) level.

Conclusions
Our analyses both confirm and extend previous studies; in particular, we highlight the impact of various dispersals, and the role of substructure in Africa, on human genetic diversity. We also identified several novel candidate regions for recent positive selection, and a gene ontology (GO) analysis identified several GO groups that were significantly enriched for such candidate genes, including immunity and defense related genes, sensory perception genes, membrane proteins, signal receptors, lipid binding/metabolism genes, and genes involved in the nervous system. Among the novel candidate genes identified are two genes involved in the thyroid hormone pathway that show signals of selection in African Pygmies that may be related to their short stature.

Link

November 22, 2009

Ancestry-related assortative mating in latino populations (Risch et al. 2009)

When different races admix, then in the first few generations there is a spectrum of ancestry proportions, ranging from pure individuals of the constituent races to admixed individuals with varying proportions of ancestry.

If there is random mating, then over several generations all individuals tend to have similar ancestry proportions, determined by the number of founders from the two constituent races. Mix 30,000 Europeans with 70,000 Africans, randomly mate them for 10-20 generations, and pretty soon almost everyone will have 30:70 European/African ancestral proportions with a little variation.

However, if there is assortative mating, then this process takes much longer to complete, as matings of individuals with very different ancestry proportions are rare, and the spectrum of varying individual ancestry is maintained. In the above-mentioned example, if there is perfect assortative mating, then after 10-20 generations you will still have 30% of the population having 100% European genes, and 70% of them having 100% African ones.

Previously, I had argued that the fact that Latin Americans, unlike Central Asian Turkic populations (such as the Uyghurs), have such a wide spectrum of ancestry proportions is due to the more recent admixture in the Americas than in Central Asia (less time for homogenization to take place), and the continued importation of Europeans.

Assortative mating is a third factor that may be behind this phenomenon. A stronger parallel may be found in South Asia, where the two constituents have been co-existing for a much longer time, but under a rigid, formalized regime of assortative mating (the caste system), homogenization has not taken place.

Genome Biology doi:10.1186/gb-2009-10-11-r132

Ancestry-related assortative mating in latino populations

Neil Risch et al.

Abstract

Background

While spouse correlations have been documented for numerous traits, no prior studies have assessed assortative mating for genetic ancestry in admixed populations.

Results

Using 104 ancestry informative markers, we examined spouse correlations in genetic ancestry for Mexican spouse pairs recruited from Mexico City and the San Francisco Bay Area, and Puerto Rican spouse pairs recruited from Puerto Rico and New York City. In the Mexican pairs, we found strong spouse correlations for European and Native American ancestry, but no correlation in African ancestry. In the Puerto Rican pairs, we found significant spouse correlations for African ancestry and European ancestry but not Native American ancestry. Correlations were not attributable to variation in socioeconomic status or geographic heterogeneity. Past evidence of spouse correlation was also seen in the strong evidence of linkage disequilibrium between unlinked markers, which was accounted for in regression analysis by ancestral allele frequency difference at the pair of markers (European versus Native American for Mexicans, European versus African for Puerto Ricans). We also observed an excess of homozygosity at individual markers within the spouses, but this provided weaker evidence, as expected, of spouse correlation. Ancestry variance is predicted to decline in each generation, but less so under assortative mating. We used the current observed variances of ancestry to infer even stronger patterns of spouse ancestry correlation in previous generations.

Conclusions

Assortative mating related to genetic ancestry persists in Latino populations to the current day, and has impacted on the genomic structure in these populations.

Link

November 21, 2009

Orientation of ancient Greek temples

From the paper:
One reason for the difference in results might be the context of their construction. Temples in Greece were frequently built upon sites that had been sacred for generations, reaching back into the Bronze Age at places like Thermon, where the later classical temples were built over the remains of Mycenaean era megaron. [21] There was the matter of historical tradition which meant that temples built in the archaic and classical periods might be built not only according to the cosmology of the time of construction, but also within the restraints of prior religious thought. The temples in Sicily were built in cities that, at the time of building, saw themselves as immigrants in a distant land. [22] Therefore there was no historical precedent to shape the construction of the temples. They were much more likely to be purely the products of seventh-, sixth- and fifth-century cosmology. The lack of prior foundations gave the Sicilian Greeks more freedom to express current thought in religious practice through their temples.

The self-identification of Sicilian Greeks as Greeks living overseas may have also made adherence to a Greek ideal more of an imperative to reassure both themselves and visitors from the homeland that their location made them no less Greek. It is interesting to note that Greek sanctuaries in Greece could be out in the hinterland tying territory to the city, while Sicilian temples were all built in urban or suburban sites. An ‘astronomical fingerprint’ may, along with other elements such as the architectural form and religious practice, have been part of a drive to prove the Hellenic character of a settlement. Hence, perhaps, the stronger results in Sicily than Greece. This could be testable by comparison with temple alignments in other locations like the Black Sea colonies or Hellenistic Asia. A lack of a similar adherence to astronomical orientation for temples in these regions would be a surprising result given the emphatic nature of the results in Sicily and Greece.
Related: Soil and Greek temples

PLoS ONE doi:10.1371/journal.pone.0007903

The Astronomical Orientation of Ancient Greek Temples

Alun M. Salt

Abstract

Despite its appearing to be a simple question to answer, there has been no consensus as to whether or not the alignments of ancient Greek temples reflect astronomical intentions. Here I present the results of a survey of archaic and classical Greek temples in Sicily and compare them with temples in Greece. Using a binomial test I show strong evidence that there is a preference for solar orientations. I then speculate that differences in alignment patterns between Sicily and Greece reflect differing pressures in the expression of ethnic identity.

Link

November 20, 2009

Y chromosome diversity, human expansion, drift, and cultural evolution (Chiaroni et al. 2009)

The supplementary material has some very interesting maps of the distribution of all major Y-chromosome haplogroups, and lists the geographical centroids with the standard deviations of all haplogroups. For example, the centroid of haplogroup J is in the Mediterranean sea between Greece, Cyprus, and Turkey, while that of its sister haplogroup I is in Central Europe. However, the standard deviation (in degrees) of the two haplogroups is 27.45 and 13.58 respectively, which shows the limited geographical extent of the latter haplogroup (see map on left).

As I have mentioned before, the origin (in space and time) of different haplogroups is related to their current geographical extent and demographic sizes, as well as their Y-STR diversity. This paper offers important data in assessing the first of these three factors.

Also of great interest is the updated Y-chromosome phylogeny, with two new branches (star: M522 that join IJ and KT, and diamond: M525 that unifies KMNOPS):


I am not so sure that drift has played a major role in human Y-chromosome diversity. As I argue in a previous post, I believe that the combination of recent TMRCAs and large haplogroup demographic sizes is best explained by selection (reproductive inequality) rather than drift.

PNAS doi:10.1073/pnas.0910803106

Y chromosome diversity, human expansion, drift, and cultural evolution


Jacques Chiaroni et al.

Abstract

The relative importance of the roles of adaptation and chance in determining genetic diversity and evolution has received attention in the last 50 years, but our understanding is still incomplete. All statements about the relative effects of evolutionary factors, especially drift, need confirmation by strong demographic observations, some of which are easier to obtain in a species like ours. Earlier quantitative studies on a variety of data have shown that the amount of genetic differentiation in living human populations indicates that the role of positive (or directional) selection is modest. We observe geographic peculiarities with some Y chromosome mutants, most probably due to a drift-related phenomenon called the surfing effect. We also compare the overall genetic diversity in Y chromosome DNA data with that of other chromosomes and their expectations under drift and natural selection, as well as the rate of fall of diversity within populations known as the serial founder effect during the recent “Out of Africa” expansion of modern humans to the whole world. All these observations are difficult to explain without accepting a major relative role for drift in the course of human expansions. The increasing role of human creativity and the fast diffusion of inventions seem to have favored cultural solutions for many of the problems encountered in the expansion. We suggest that cultural evolution has been subrogating biologic evolution in providing natural selection advantages and reducing our dependence on genetic mutations, especially in the last phase of transition from food collection to food production.

Link

November 18, 2009

Genetic methods applied to linguistic diversity of the Sahul

It is great to see cross-pollination between the sciences; in this case, use of STRUCTURE has led to insights about languages of the Sahul.

From the paper:
Although we cannot specify how many different migrations have colonized Sahul since the first settlement approximately 50,000 years ago, our results indicate ancient splits into seven major plausible groups: TNG, South-Papuan, North-West Papuan, North-East Papuan, West-Papuan, PN, and non-PN. The wide-spread families (TNG and PN) on both sides of the Torres Strait divide (~9,000 BP) are the result of more recent expansions of two of those groups, in the case of TNG probably linked to the development of agriculture, ~9,000 to 6,000 years ago, see [35],[37].

The AN expansion is much more recent and has only had effects in eastern Indonesia, along the north coast of New Guinea and the islands east of the New Guinea mainland. We know on the basis of the comparative method correlated with archaeological data that approximately 3,200 years ago the Oceanic subgroup dispersed from its homeland on New Britain in three directions [9]: (1) back along the north coast, (2) around the eastern tip of New Guinea along the south coast, and (3) much further into the Pacific. The results of our analysis capture some of the impact of this great expansion on the languages that were already in the region. We find that in the eastern islands there are clearly distinct AN and non-AN groups, with good evidence of a deep structural phylogenetic signal, albeit with some admixture [16]. In the western islands however there is considerably more typological convergence between AN and non-AN languages (see also [38]). The linguistic population identified as Red appears to have members along the north coast (Mairasi, I'saka, and Kamasau) and on New Britain, where again both AN (Mangseng) and Papuan languages (Kol and Sulka) have contributions from the same cluster. This finding suggests an area of millennia of contact between AN and Papuan non-TNG speaking groups.
Gene Expression has more.

PLoS Biology doi:10.1371/journal.pbio.1000241

Explaining the Linguistic Diversity of Sahul Using Population Models


Ger Reesink et al.

Abstract

The region of the ancient Sahul continent (present day Australia and New Guinea, and surrounding islands) is home to extreme linguistic diversity. Even apart from the huge Austronesian language family, which spread into the area after the breakup of the Sahul continent in the Holocene, there are hundreds of languages from many apparently unrelated families. On each of the subcontinents, the generally accepted classification recognizes one large, widespread family and a number of unrelatable smaller families. If these language families are related to each other, it is at a depth which is inaccessible to standard linguistic methods. We have inferred the history of structural characteristics of these languages under an admixture model, using a Bayesian algorithm originally developed to discover populations on the basis of recombining genetic markers. This analysis identifies 10 ancestral language populations, some of which can be identified with clearly defined phylogenetic groups. The results also show traces of early dispersals, including hints at ancient connections between Australian languages and some Papuan groups (long hypothesized, never before demonstrated). Systematic language contact effects between members of big phylogenetic groups are also detected, which can in some cases be identified with a diffusional or substrate signal. Most interestingly, however, there remains striking evidence of a phylogenetic signal, with many languages showing negligible amounts of admixture.

Link

Y chromosomes of NE Portuguese Jews

American Journal of Physical Anthropology doi:10.1002/ajpa.21154

Phylogeographic analysis of paternal lineages in NE Portuguese Jewish communities

Inês Nogueiro et al.

Abstract

The establishment of Jewish communities in the territory of contemporary Portugal is archaeologically documented since the 3rd century CE, but their settlement in Trás-os-Montes (NE Portugal) has not been proved before the 12th century. The Decree of Expulsion followed by the establishment of the Inquisition, both around the beginning of the 16th century, accounted for a significant exodus, as well as the establishment of crypto-Jewish communities. Previous Y chromosome studies have shown that different Jewish communities share a common origin in the Near East, although they can be quite heterogeneous as a consequence of genetic drift and different levels of admixture with their respective host populations. To characterize the genetic composition of the Portuguese Jewish communities from Trás-os-Montes, we have examined 57 unrelated Jewish males, with a high-resolution Y-chromosome typing strategy, comprising 16 STRs and 23 SNPs. A high lineage diversity was found, at both haplotype and haplogroup levels (98.74 and 82.83%, respectively), demonstrating the absence of either strong drift or founder effects. A deeper and more detailed investigation is required to clarify how these communities avoided the expected inbreeding caused by over four centuries of religious repression. Concerning haplogroup lineages, we detected some admixture with the Western European non-Jewish populations (R1b1b2-M269, 28%), along with a strong ancestral component reflecting their origin in the Middle East [J1(xJ1a-M267), 12%; J2-M172, 25%; T-M70, 16%] and in consequence Trás-os-Montes Jews were found to be more closely related with other Jewish groups, rather than with the Portuguese non-Jewish population.

Link

November 16, 2009

Time-independent evolutionary mtDNA mutation rates in Penguins

The study is reminiscent of another recent paper on Penguins, and strikes another blow against the idea that over long time periods genetic diversity accumulates at a slow rate.

Trends in Genetics, Volume 25, Issue 11, doi:10.1016/j.tig.2009.09.005

High mitogenomic evolutionary rates and time dependency

Sankar Subramanian et al.

Using entire modern and ancient mitochondrial genomes of Adélie penguins (Pygoscelis adeliae) that are up to 44000 years old, we show that the rates of evolution of the mitochondrial genome are two to six times greater than those estimated from phylogenetic comparisons. Although the rate of evolution at constrained sites, including nonsynonymous positions and RNAs, varies more than twofold with time (between shallow and deep nodes), the rate of evolution at synonymous sites remains the same. The time-independent neutral evolutionary rates reported here would be useful for the study of recent evolutionary events.

Link

November 14, 2009

Cambyses' army found in Egypt

VANISHED PERSIAN ARMY SAID FOUND IN DESERT
Bones, jewelry and weapons found in Egyptian desert may be the remains of Cambyses' army that vanished 2,500 years ago.

The remains of a mighty Persian army said to have drowned in the sands of the western Egyptian desert 2,500 years ago might have been finally located, solving one of archaeology's biggest outstanding mysteries, according to Italian researchers.

Bronze weapons, a silver bracelet, an earring and hundreds of human bones found in the vast desolate wilderness of the Sahara desert have raised hopes of finally finding the lost army of Persian King Cambyses II. The 50,000 warriors were said to be buried by a cataclysmic sandstorm in 525 B.C.

"We have found the first archaeological evidence of a story reported by the Greek historian Herodotus," Dario Del Bufalo, a member of the expedition from the University of Lecce, told Discovery News.

According to Herodotus (484-425 B.C.), Cambyses, the son of Cyrus the Great, sent 50,000 soldiers from Thebes to attack the Oasis of Siwa and destroy the oracle at the Temple of Amun after the priests there refused to legitimize his claim to Egypt.

After walking for seven days in the desert, the army got to an "oasis," which historians believe was El-Kharga. After they left, they were never seen again.

"A wind arose from the south, strong and deadly, bringing with it vast columns of whirling sand, which entirely covered up the troops and caused them wholly to disappear," wrote Herodotus.

A century after Herodotus wrote his account, Alexander the Great made his own pilgrimage to the oracle of Amun, and in 332 B.C. he won the oracle's confirmation that he was the divine son of Zeus, the Greek god equated with Amun.

Video on the Lost Army of Cambyses. Another video.

UPDATE: Rogue Classicism is skeptical.

November 12, 2009

mtDNA haplogroup H and maximal oxygen uptake

Mitochondrion. 2009 Nov 6. [Epub ahead of print]

Human mitochondrial haplogroup H: the highest VO(2max) consumer. Is it a paradox?

Martínez-Redondo D et al.

Mitochondrial background has been demonstrated to influence maximal oxygen uptake (VO(2max), in mL.kg(-1).min(-1)), but this genetic influence can be compensated for by regular exercise. A positive correlation among electron transport chain (ETC) coupling, ATP and reactive oxygen species (ROS) production has been established, and mitochondrial variants have been reported to show differences in their ETC performance. In this study, we examined in detail the VO(2max) differences found among mitochondrial haplogroups. We recruited 81 healthy male Spanish Caucasian individuals and determined their mitochondrial haplogroup. Their VO(2max) was determined using incremental cycling exercise (ICE). VO(2max) was lower in J than in non-J haplogroup individuals (P=0.04). The H haplogroup was responsible for this difference (VO(2max); J vs. H; P=0.008) and this group also had significantly higher mitochondrial oxidative damage (mtOD) than the J haplogroup (P=0.04). In agreement with these results, VO(2max) and mtOD were positively correlated (P=0.01). Given that ROS production is the major contributor to mtOD and consumes four times more oxygen per electron than the ETC, our results strongly suggest that ROS production is responsible for the higher VO(2max) found in the H variant. These findings not only contribute to a better understanding of the mechanisms underneath VO(2max), but also help to explain some reported associations between mitochondrial haplogroups and mtOD with longevity, sperm motility, premature aging and susceptibility to different pathologies.

Link

November 11, 2009

Spouse selection in Sardinia

American Journal of Physical Anthropology doi:10.1002/ajpa.21150

Spouse selection by health status and physical traits. Sardinia, 1856-1925

M. Manfredini et al.

Abstract

Military medical information and data from civil registers of death and marriage have been used to study the role of physical characteristics and health conditions in explaining access to marriage for the male population of Alghero, a small city located in Sardinia Island (Italy), at the turn of 19th century. Literature data about contemporary populations have already demonstrated the influence of somatic traits in the mate choice. The results presented here show that men with low height and poor health status at the age of 20 were negatively selected for marriage. This holds true also in a society where families often arranged marriages for their children. This pattern of male selection on marriage was found to be particularly marked among the richest and wealthiest SES groups. Our hypothesis is that this social group carefully selected for marriage those individuals who were apparently healthier and therefore more likely to guarantee good health status and better life conditions to offspring. In evolutionary terms, the mate choice component of sexual selection suggests that the height of prospective partners could be claimed as one of the determinants, along with other environmental causes, of the observed higher stature of men belonging to the wealthiest social strata of the Alghero population.

Link

November 10, 2009

Ottoman terror in 15th c. Croatia

Peaceful co-existence, Islamic tolerance, Ottoman benevolence in action...

American Journal of Physical Anthropology doi:10.1002/ajpa.21152

The harsh life on the 15th century Croatia-Ottoman Empire military border: Analyzing and identifying the reasons for the massacre in epin

Mario laus et al.

Abstract

Excavation of the historic period cemetery in epin, Croatia revealed the presence of a large number of perimortem injuries distributed among males, females, and subadults. Archaeological and historical data suggest these individuals were victims of a raid carried out by Turkish akinji light cavalry in 1441. Comparisons with the frequencies of perimortem trauma in 12 other, temporally congruent skeletal series from the Balkans (n = 2,123 skeletons) support this assumption. The role of the akinji in the Ottoman army was twofold: to supply war captives, and to terrorize and disperse local populations before the advance of regular troops. This article tests the hypothesis that the purpose of the 1441 raid was the latter. To accomplish this, perimortem trauma in the series were analyzed by sex, age, location, and depth of the injury. A total of 82 perimortem injuries were recorded in 12 males, 7 females, and 3 subadults. The demographic profile of the victims suggests that young adults were specifically targeted in the attack. Significant sex differences are noted in the number, distribution, and pattern of perimortem trauma. Females exhibit significantly more perimortem injuries per individual, and per bone affected, than males. The morphology and pattern of perimortem trauma in females is suggestive of gratuitous violence. Cumulatively, analysis of the osteological data suggest that the objective of the 1441 akinji raid was to spread terror and panic in the epin area, either as revenge for recent military setbacks, or as part of a long-term strategy intended to depopulate the area around Osijek.