bioRxiv http://dx.doi.org/10.1101/018770
The complex admixture history and recent southern origins of Siberian populations
Irina Pugach , Rostislav Matveev , Viktor Spitsyn , Sergey Makarov , Innokentiy Novgorodov , Vladimir Osakovsky , Mark Stoneking , Brigitte Pakendorf
Although Siberia was inhabited by modern humans at an early stage, there is still debate over whether this area remained habitable during the extremely cold period of the Last Glacial Maximum or whether it was subsequently repopulated by peoples with a recent shared ancestry. Previous studies of the genetic history of Siberian populations were hampered by the extensive admixture that appears to have taken place among these populations, since commonly used methods assume a tree-like population history and at most single admixture events. We therefore developed a new method based on the covariance of ancestry components, which we validated with simulated data, in order to investigate this potentially complex admixture history and to distinguish the effects of shared ancestry from prehistoric migrations and contact. We furthermore adapted a previously devised method of admixture dating for use with multiple events of gene flow, and applied these methods to whole-genome genotype data from over 500 individuals belonging to 20 different Siberian ethnolinguistic groups. The results of these analyses indicate that there have indeed been multiple layers of admixture detectable in most of the Siberian populations, with considerable differences in the admixture histories of individual populations, and with the earliest events dated to not more than 4500 years ago. Furthermore, most of the populations of Siberia included here, even those settled far to the north, can be shown to have a southern origin. These results provide support for a recent population replacement in this region, with the northward expansions of different populations possibly being driven partly by the advent of pastoralism, especially reindeer domestication. These newly developed methods to analyse multiple admixture events should aid in the investigation of similarly complex population histories elsewhere.
Link

Showing posts with label Turkic. Show all posts
Showing posts with label Turkic. Show all posts
February 26, 2015
Estonian biocentre high coverage Y chromosome sequences and Turkic data
Courtesy of the good people of the Estonian biocentre:
- 307 high coverage human Y chrmosome sequences. Paper to be published soon.
- The Genetic Legacy of the Expansion of Turkic-Speaking Nomads Across Eurasia. Paper in press.
The Y chromosome data seems particularly exciting (there is a spreadsheet of populations in the download directory). One of the weaknesses of the 1000 Genomes data was that it didn't have any populations between Tuscany and East/South Asia, and the new dataset seems to rectify that.
The Turkic dataset is probably the one used for the preprint The Genetic Legacy of the Expansion of Turkic-Speaking Nomads Across Eurasia. Since I overlooked this when it came out last summer, I'll post about it when the paper is published in a journal.
The Turkic dataset is probably the one used for the preprint The Genetic Legacy of the Expansion of Turkic-Speaking Nomads Across Eurasia. Since I overlooked this when it came out last summer, I'll post about it when the paper is published in a journal.
February 16, 2015
Turkic language family time depth: 204BC

The regular-sound-change tree estimates a mean divergence time between the outgroup Chuvash and other Turkic languages of 204 BCE, with a 95% credible interval of 605 BCE to 81 CE. This compares to proposals from glottochronological analyses that suggest dates of 30 BCE to 0 CE [21] and 500 BCE to 50 CE from historical data [18, 21 and 22]. The sporadic-sound-change model estimates the mean age of the tree to be more than two millennia older (2408 BCE, 95% CI = 3994–1279 BCE), because it wrongly assumes that the many occurrences of regular sound change along the outgroup Chuvash branch are multiple instances of independent phonological change.Current Biology Volume 25, Issue 1, 5 January 2015, Pages 1–9
Detecting Regular Sound Changes in Linguistics as Events of Concerted Evolution
Daniel J. Hruschka et al.
Summary
Background
Concerted evolution is normally used to describe parallel changes at different sites in a genome, but it is also observed in languages where a specific phoneme changes to the same other phoneme in many words in the lexicon—a phenomenon known as regular sound change. We develop a general statistical model that can detect concerted changes in aligned sequence data and apply it to study regular sound changes in the Turkic language family.
Results
Linguistic evolution, unlike the genetic substitutional process, is dominated by events of concerted evolutionary change. Our model identified more than 70 historical events of regular sound change that occurred throughout the evolution of the Turkic language family, while simultaneously inferring a dated phylogenetic tree. Including regular sound changes yielded an approximately 4-fold improvement in the characterization of linguistic change over a simpler model of sporadic change, improved phylogenetic inference, and returned more reliable and plausible dates for events on the phylogenies. The historical timings of the concerted changes closely follow a Poisson process model, and the sound transition networks derived from our model mirror linguistic expectations.
Conclusions
We demonstrate that a model with no prior knowledge of complex concerted or regular changes can nevertheless infer the historical timings and genealogical placements of events of concerted change from the signals left in contemporary data. Our model can be applied wherever discrete elements—such as genes, words, cultural trends, technologies, or morphological traits—can change in parallel within an organism or other evolving group.
Link
October 26, 2013
Afghan mega-paper (Di Cristofaro et al.)
The admixture results nicely presented on a map:

The authors note that none of the ancestral components peaks in Central Asia, concluding that this region has been a destination rather than a source of population movements. I certainly agree that Central Asia has a lot of recent history affecting it from virtually all directions. On the other hand, we should be cautious about interpreting geographical clines in terms of directionality of population movement; a good example is Sardinia which often emerges as a "focus" of Mediterranean ancestry, but this does not mean that it is the origin of such ancestry. It would certainly be interesting to remove the layers of more recent ancestry from Central Asia to see what was there before the last few thousand years.
The PCA based on autosomal data:

The Y-chromosome haplogroup data can be found in Figure S7. The authors comment:
PLoS ONE 8(10): e76748. doi:10.1371/journal.pone.0076748
Afghan Hindu Kush: Where Eurasian Sub-Continent Gene Flows Converge
Julie Di Cristofaro et al.
Despite being located at the crossroads of Asia, genetics of the Afghanistan populations have been largely overlooked. It is currently inhabited by five major ethnic populations: Pashtun, Tajik, Hazara, Uzbek and Turkmen. Here we present autosomal from a subset of our samples, mitochondrial and Y- chromosome data from over 500 Afghan samples among these 5 ethnic groups. This Afghan data was supplemented with the same Y-chromosome analyses of samples from Iran, Kyrgyzstan, Mongolia and updated Pakistani samples (HGDP-CEPH). The data presented here was integrated into existing knowledge of pan-Eurasian genetic diversity. The pattern of genetic variation, revealed by structure-like and Principal Component analyses and Analysis of Molecular Variance indicates that the people of Afghanistan are made up of a mosaic of components representing various geographic regions of Eurasian ancestry. The absence of a major Central Asian-specific component indicates that the Hindu Kush, like the gene pool of Central Asian populations in general, is a confluence of gene flows rather than a source of distinctly autochthonous populations that have arisen in situ: a conclusion that is reinforced by the phylogeography of both haploid loci.
Link

The authors note that none of the ancestral components peaks in Central Asia, concluding that this region has been a destination rather than a source of population movements. I certainly agree that Central Asia has a lot of recent history affecting it from virtually all directions. On the other hand, we should be cautious about interpreting geographical clines in terms of directionality of population movement; a good example is Sardinia which often emerges as a "focus" of Mediterranean ancestry, but this does not mean that it is the origin of such ancestry. It would certainly be interesting to remove the layers of more recent ancestry from Central Asia to see what was there before the last few thousand years.
The PCA based on autosomal data:

The Y-chromosome haplogroup data can be found in Figure S7. The authors comment:
94% of the chromosomes are distributed within the following 9 main haplogroups: R-M207 (34%), J-M304 (16%), C-M130 (15%), L-M20 (6%), G-M201 (6%), Q-M242 (6%), N-M231 (4%), O-M175 (4%) and E-M96 (3%). Within the core haplogroups observed in the Afghan populations, there are sub-haplogroups that provide more refined insights into the underlying structure of the Y-chromosome gene pool. One of the important sub-haplogroups includes the C3b2b1-M401 lineage that is amplified in Hazara, Kyrgyz and Mongol populations. Haplogroup G2c-M377 reaches 14.7% in Pashtun, consistent with previous results [31], whereas it is virtually absent from all other populations. J2a1-Page55 is found in 23% of Iranians, 13% of the Hazara from the Hindu Kush, 11% of the Tajik and Uzbek from the Hindu Kush, 10% of Pakistanis, 4% of the Turkmen from the Hindu Kush, 3% of the Pashtun and 2% of the Kyrgyz and Mongol populations. Concerning haplogroup L, L1c-M357 is significantly higher in Burusho and Kalash (15% and 25%) than in other populations. L1a-M76 is most frequent in Balochi (20%), and is found at lower levels in Kyrgyz, Pashtun, Tajik, Uzbek and Turkmen populations. Q1a2-M25 lineage is characteristic of Turkmen (31%), significantly higher than all other populations. Haplogroup R1a1a-M198/M17 is characterized by its absence or very low frequency in Iranian, Mongol and Hazara populations and its high frequency in Pashtun and Kyrgyz populations.
PLoS ONE 8(10): e76748. doi:10.1371/journal.pone.0076748
Afghan Hindu Kush: Where Eurasian Sub-Continent Gene Flows Converge
Julie Di Cristofaro et al.
Despite being located at the crossroads of Asia, genetics of the Afghanistan populations have been largely overlooked. It is currently inhabited by five major ethnic populations: Pashtun, Tajik, Hazara, Uzbek and Turkmen. Here we present autosomal from a subset of our samples, mitochondrial and Y- chromosome data from over 500 Afghan samples among these 5 ethnic groups. This Afghan data was supplemented with the same Y-chromosome analyses of samples from Iran, Kyrgyzstan, Mongolia and updated Pakistani samples (HGDP-CEPH). The data presented here was integrated into existing knowledge of pan-Eurasian genetic diversity. The pattern of genetic variation, revealed by structure-like and Principal Component analyses and Analysis of Molecular Variance indicates that the people of Afghanistan are made up of a mosaic of components representing various geographic regions of Eurasian ancestry. The absence of a major Central Asian-specific component indicates that the Hindu Kush, like the gene pool of Central Asian populations in general, is a confluence of gene flows rather than a source of distinctly autochthonous populations that have arisen in situ: a conclusion that is reinforced by the phylogeography of both haploid loci.
Link
June 21, 2013
Sakha origins

An interesting quote from the paper:
Although the genetic heritage of the native populations of Sakha is mostly of East Asian ancestry, analyses of autosomal SNP data as well as haploid loci also show a minor West Eurasian genetic component. The patchy presence of the “European” (blue) component in the ADMIXTURE plot (Figure 6), most pronounced in Yukaghirs, probably testifies to recent admixture with Europeans. In addition, the presence of European-specific paternal lineages R1a-M458, I1 and I2a among Yakuts, Dolgans, Evenks and Yukaghirs likely points to a recent gene flow from East Europeans. Although only individuals with self-reported unadmixed ancestry for at least two generations were included in the study of haploid loci, mistakes in ethnic self-identification cannot be entirely excluded. One of the main sources of gene flow has likely been Russians who accounted for 37.8% of the population of Sakha in 2010 [61]. The migration of Russians (at first mainly men) to eastern Siberia started already in the 17th century, when Yakutia was incorporated into the Russian Empire [62].But:
The mtDNA haplogroup J detected in the remains from a Yakut burial site dated to the beginning of the 17th century [41], long before the beginning of the settlement of Russian families in the 18th century [63], clearly points to more ancient gene flow from western Eurasia. The presence of haplogroups H8, H20 and HV1a1a among the Yakuts, Dolgans and Evenks (Figure 1) also suggests gene flow other than from Russians, because these haplogroups are rare (H8 and H20) or even absent (HV1a1a) among Russians [64-67], but are common among southern Siberian populations as well as in the Caucasus, the Middle and Near East [19,68-70]. Moreover, the HVSI haplotypes of H8, H20a and HV1a1a in our sample exactly match those in the Buryats from the Buryat Republic [19]. Similarly, the Ychromosome haplogroup J in Dolgans and Evens very likely testifies to gene flow through South Siberia, as it is present among native South Siberian populations [47,71]. The scenario of ancient gene flow from West Eurasia is supported by ancient DNA data, which show that in the Bronze and Iron Ages, South Siberia, including the Altai region, was an area of overwhelmingly predominant western Eurasian settlement [72,73], and the Indo-European migration even reached northeastern Mongolia [74]. To summarize, the West Eurasian genetic component in Sakha may originate from recent admixture with East Europeans, whereas more ancient gene flow from West Eurasia through Central Asia and South Siberia is also probable.
BMC Evolutionary Biology 2013, 13:127 doi:10.1186/1471-2148-13-127
Autosomal and uniparental portraits of the native populations of Sakha (Yakutia): implications for the peopling of Northeast Eurasia
Sardana A Fedorova et al.
Background
Sakha -- an area connecting South and Northeast Siberia -- is significant for understanding the history of peopling of Northeast Eurasia and the Americas. Previous studies have shown a genetic contiguity between Siberia and East Asia and the key role of South Siberia in the colonization of Siberia.
Results
We report the results of a high-resolution phylogenetic analysis of 701 mtDNAs and 318 Y chromosomes from five native populations of Sakha (Yakuts, Evenks, Evens, Yukaghirs and Dolgans) and of the analysis of more than 500,000 autosomal SNPs of 758 individuals from 55 populations, including 40 previously unpublished samples from Siberia. Phylogenetically terminal clades of East Asian mtDNA haplogroups C and D and Y-chromosome haplogroups N1c, N1b and C3, constituting the core of the gene pool of the native populations from Sakha, connect Sakha and South Siberia. Analysis of autosomal SNP data confirms the genetic continuity between Sakha and South Siberia. Maternal lineages D5a2a2, C4a1c, C4a2, C5b1b and the Yakut-specific STR sub-clade of Y-chromosome haplogroup N1c can be linked to a migration of Yakut ancestors, while the paternal lineage C3c was most likely carried to Sakha by the expansion of the Tungusic people. MtDNA haplogroups Z1a1b and Z1a3, present in Yukaghirs, Evens and Dolgans, show traces of different and probably more ancient migration(s). Analysis of both haploid loci and autosomal SNP data revealed only minor genetic components shared between Sakha and the extreme Northeast Siberia. Although the major part of West Eurasian maternal and paternal lineages in Sakha could originate from recent admixture with East Europeans, mtDNA haplogroups H8, H20a and HV1a1a, as well as Y-chromosome haplogroup J, more probably reflect an ancient gene flow from West Eurasia through Central Asia and South Siberia.
Conclusions
Our high-resolution phylogenetic dissection of mtDNA and Y-chromosome haplogroups as well as analysis of autosomal SNP data suggests that Sakha was colonized by repeated expansions from South Siberia with minor gene flow from the Lower Amur/Southern Okhotsk region and/or Kamchatka. The minor West Eurasian component in Sakha attests to both recent and ongoing admixture with East Europeans and an ancient gene flow from West Eurasia.

November 03, 2012
Recent admixture in Altaic populations: a legacy of Empire?
Continuing my experiments with ALDER, I took every single Altaic population publicly available, i.e., the following 25 populations:
I then ran ALDER for all 25 Altaic populations using any of the 3*3 West/East Eurasian reference pairs, or a total of 25*3*3= 225 runs. I retained only those 2-ref admixture analyses for which ALDER reported "success" with no warnings.
I then converted reported times to calendar dates: a generation of 29 years was assumed; lacking information about the age of the sampled individuals, I assumed that the "present" is 1980; finally, I report the earliest and latest -/+ limits of any confidence interval, as well as the median of all estimates.
The results can be seen below; for 11 of the 25 populations there was at least one test which was successful with no warnings. This does not mean that the other populations are unadmixed, but the following cases appear to be most "well-behaved":

Now, these appear to make excellent sense.
Of the Dolgans:
Of the Evenks:
Of the Nogais:
Not much needs to be said for the admixture signal in the Uygur, Uzbek, Kyrgyz, and Mongols which collectively ranges from 1260-1500AD. This was a period of Mongol power when Mongolian and Turkic speaking peoples assumed control over Central Asia and replaced to a great degree the previous inhabitants of the area.
The origin of the Balkars is less certain, because they are an old Turkic group that settled in the Caucasus, but the admixture (830-1220AD) date seems plausible. So does, of course, that of the Turks from Caesaria (990-1260AD) which parallels those of my recent experiment, and can be associated with the takeover of Anatolia following the Battle of Manzikert. Finally, I don't have a read explanation for the 11-12th century signal of admixture in the Siberian Altai and Buryat, but presumably it has something to do with the expansions of Altaic peoples around that time that were also felt in the west during this period; presumably, this involved some type of mixture with Caucasoid groups in Siberia.
The admixture dates are quite helpful in helping us better interpret other signals of admixture such as those of ADMIXTURE analyses (e.g., globe13). For example, the Dolgan have 13.1% North_European in that experiment, and the Altai have 13.2%, but apparently this occurred centuries apart and may have involved different groups of West Eurasian people.
In conclusion, ALDER seems to find some quite plausible dates for major admixture episodes in the history of Altaic populations that are compatible with fairly recent historical events.
Altai, Balkars_Y, Buryat, Chuvashs_16, Daur, Dolgan, Evenk_15, Hezhen, Kumyks_Y, Kyrgyz_Bishkek_Ho, Mongol, Mongola, Nogais_Y, Oroqen, Tu, Turkish_Aydin_Ho, Turkish_Istanbul_Ho, Turkish_Kayseri_Ho, Turkmens_Y, Turks, Tuva, Uygur, Uzbeks, Xibo, YakutI also took three West Eurasian populations unlikely to have historical East Asian admixture (French, French_Basque, and Sardinians), and three East Eurasian populations unlikely to have historical West Eurasian admixture (Dai, She, Miaozu). I merged all of the above in PLINK with a --geno 0.03 flag, and extracting SNPs present in the Rutgers recombination map for Illumina chips (a total of 524,822 SNPs).
I then ran ALDER for all 25 Altaic populations using any of the 3*3 West/East Eurasian reference pairs, or a total of 25*3*3= 225 runs. I retained only those 2-ref admixture analyses for which ALDER reported "success" with no warnings.
I then converted reported times to calendar dates: a generation of 29 years was assumed; lacking information about the age of the sampled individuals, I assumed that the "present" is 1980; finally, I report the earliest and latest -/+ limits of any confidence interval, as well as the median of all estimates.
The results can be seen below; for 11 of the 25 populations there was at least one test which was successful with no warnings. This does not mean that the other populations are unadmixed, but the following cases appear to be most "well-behaved":

Now, these appear to make excellent sense.
Of the Dolgans:
There also existed a group of Russian settlers on the River Heta, who, by the end of the 19th century, had become Dolganized and had gradually adopted the way of life of nomadic reindeer breeders. ... The tribes forming the nucleus of the Dolgans migrated from the banks of the River Lena at the end of the 17th century. One of the reasons for migration was the fact that Russian goods, flour, for instance, were coming to the Taimyr Peninsula by the boats on the Lena.The 1770-1860AD range for the admixture appears to coincide with the period where the Dolgans came under Russian influence.
Of the Evenks:
The history of the Evenks' habitation can be traced in detail from the 17th century on. At that time the Evenks left several of their previous territories, for instance, the River Angara, when the Yakut, the Buryat and the Russians appeared in the province. The Evenks had especially bad relations with the Yakuts, who had settled in the river basin of the Lena in the 13th century. In the 18th and 19th centuries the Evenks living there adopted the Yakut language. In the Baikal area the Evenks began to speak the Buryat and the Mongolian languages, and even converted to lamaism. The southern Evenk -- the Manegir, the Birar, the Solon -- were influenced by the Manchu, Daur and Chinese cultures. The arable lands in Siberia were occupied by Russian settlers, migrating there in the 17th century, and those Evenks, living in the vicinity on the upper reaches of the Lena and near Baikal, were russified.Again, the 1630-1800AD admixture range seems consistent with the time when Evenks came into contact with Russians.
Of the Nogais:
In the first half of the 17th century a number of Nogay tribes were nomadic on the steppes between the Danube and the Caspian. The invasion of the warlike Kalmyks forced several of the Nogay tribes to leave their home steppes and withdraw to the foothills of the North Caucasus. By the River Kuban they met with the Cherkess. In the Moscow chronicles from the 16th and 17th centuries there are several mentions of the Nogay, including the two Nogay Hordes, the Great and the Small. The former roamed beyond the River Volga, the latter somewhat to the west. Both had numerous military encounters with the Russians. In the 17th century some of the Nogay chiefs entered into an alliance with Moscow and fought at times together with the Russians against the Kabardians, the Kalmyks and peoples of Dagestan.The 1610-1730AD range intersects the period when the Nogais settled in the North Caucasus and interacted with North Caucasians and Russians.
Not much needs to be said for the admixture signal in the Uygur, Uzbek, Kyrgyz, and Mongols which collectively ranges from 1260-1500AD. This was a period of Mongol power when Mongolian and Turkic speaking peoples assumed control over Central Asia and replaced to a great degree the previous inhabitants of the area.
The origin of the Balkars is less certain, because they are an old Turkic group that settled in the Caucasus, but the admixture (830-1220AD) date seems plausible. So does, of course, that of the Turks from Caesaria (990-1260AD) which parallels those of my recent experiment, and can be associated with the takeover of Anatolia following the Battle of Manzikert. Finally, I don't have a read explanation for the 11-12th century signal of admixture in the Siberian Altai and Buryat, but presumably it has something to do with the expansions of Altaic peoples around that time that were also felt in the west during this period; presumably, this involved some type of mixture with Caucasoid groups in Siberia.
The admixture dates are quite helpful in helping us better interpret other signals of admixture such as those of ADMIXTURE analyses (e.g., globe13). For example, the Dolgan have 13.1% North_European in that experiment, and the Altai have 13.2%, but apparently this occurred centuries apart and may have involved different groups of West Eurasian people.
In conclusion, ALDER seems to find some quite plausible dates for major admixture episodes in the history of Altaic populations that are compatible with fairly recent historical events.
rolloff and ALDER analysis of Turks
I carried out rolloff analysis of the Behar et al. (2010) sample of Turks together with the sample of Uzbeks from the same, and the Yunusbayev et al. (2011) sample of Armenians. A --geno 0.03 flag was applied for merging and SNPs available in the Rutgers recombination map for Illumina chips were used.
The exponential decay can be seen below:

The signal of admixture seems pretty clear and extends up to several cM. Of course, as always, this does not mean that exactly these two populations mixed to form the Turks sample, but it does mean that they are reasonable standins.
The jackknife gives an admixture time estimate of 27.622 +/- 5.348 generations or 800 +/- 160 years, which of course makes perfect historical sense as it is a date between the first arrival of the Seljuks in Anatolia and the final consolidation of power by the Ottomans. Note also that this probably applies principally to this particular sample (which I believe is from Cappadoccia) and there were perhaps different admixture dynamics elsewhere.
I had started this analysis before the announcement of ALDER, but since it is very fast, I decided to give it a go as well. Below is the raw output:
*** Admixture test summary ***
Weighted LD curves are fit starting at 1.45 cM
Pre-test: Does Turks have a 1-ref weighted LD curve with Armenians_Y?
1-ref decay z-score: 0.09
1-ref amp_exp z-score: -0.01
NO: curve is not significant
Pre-test: Does Turks have a 1-ref weighted LD curve with Uzbeks?
1-ref decay z-score: 6.56
1-ref amp_exp z-score: 5.02
YES: curve is significant
Does Turks have a 2-ref weighted LD curve with Armenians_Y and Uzbeks?
2-ref decay z-score: 5.61
2-ref amp_exp z-score: 5.58
YES: curve is significant
Do 2-ref and 1-ref curves have consistent decay rates?
1-ref Armenians_Y - 2-ref z-score: 0.01 ( 13%)
1-ref Uzbeks - 2-ref z-score: 0.69 ( 11%)
1-ref Uzbeks - 1-ref Armenians_Y z-score: -0.00 ( -1%)
YES: decay rates are consistent
Test FAILS (z=5.58, p=2.4e-08) for Turks with {Armenians_Y, Uzbeks} weights
DATA: failure 2.4e-08 Turks Armenians_Y Uzbeks 5.58 -0.01 5.02 13% 23.92 +/- 4.26 0.00002930 +/- 0.00000525 27.18 +/- 302.36 -0.00000082 +/- 0.00013129 26.84 +/- 4.09 0.00002316 +/- 0.00000461
DATA: test status p-value test pop ref A ref B 2-ref z-score 1-ref z-score A 1-ref z-score B max decay diff % 2-ref decay 2-ref amp_exp 1-ref decay A 1-ref amp_exp A 1-ref decay B 1-ref amp_exp B
Finally, the lower bound of the admixture fraction for Turks with an Uzbek reference is estimated as:
Mixture fraction % lower bound (assuming admixture): 29.8 +/- 4.0
The exponential decay can be seen below:

The signal of admixture seems pretty clear and extends up to several cM. Of course, as always, this does not mean that exactly these two populations mixed to form the Turks sample, but it does mean that they are reasonable standins.
The jackknife gives an admixture time estimate of 27.622 +/- 5.348 generations or 800 +/- 160 years, which of course makes perfect historical sense as it is a date between the first arrival of the Seljuks in Anatolia and the final consolidation of power by the Ottomans. Note also that this probably applies principally to this particular sample (which I believe is from Cappadoccia) and there were perhaps different admixture dynamics elsewhere.
I had started this analysis before the announcement of ALDER, but since it is very fast, I decided to give it a go as well. Below is the raw output:
*** Admixture test summary ***
Weighted LD curves are fit starting at 1.45 cM
Pre-test: Does Turks have a 1-ref weighted LD curve with Armenians_Y?
1-ref decay z-score: 0.09
1-ref amp_exp z-score: -0.01
NO: curve is not significant
Pre-test: Does Turks have a 1-ref weighted LD curve with Uzbeks?
1-ref decay z-score: 6.56
1-ref amp_exp z-score: 5.02
YES: curve is significant
Does Turks have a 2-ref weighted LD curve with Armenians_Y and Uzbeks?
2-ref decay z-score: 5.61
2-ref amp_exp z-score: 5.58
YES: curve is significant
Do 2-ref and 1-ref curves have consistent decay rates?
1-ref Armenians_Y - 2-ref z-score: 0.01 ( 13%)
1-ref Uzbeks - 2-ref z-score: 0.69 ( 11%)
1-ref Uzbeks - 1-ref Armenians_Y z-score: -0.00 ( -1%)
YES: decay rates are consistent
Test FAILS (z=5.58, p=2.4e-08) for Turks with {Armenians_Y, Uzbeks} weights
DATA: failure 2.4e-08 Turks Armenians_Y Uzbeks 5.58 -0.01 5.02 13% 23.92 +/- 4.26 0.00002930 +/- 0.00000525 27.18 +/- 302.36 -0.00000082 +/- 0.00013129 26.84 +/- 4.09 0.00002316 +/- 0.00000461
DATA: test status p-value test pop ref A ref B 2-ref z-score 1-ref z-score A 1-ref z-score B max decay diff % 2-ref decay 2-ref amp_exp 1-ref decay A 1-ref amp_exp A 1-ref decay B 1-ref amp_exp B
The age estimate appears to be very similar, and most curves appear to be significant, except the one with Armenians_Y. This makes good sense. From Loh et al. (2012):
Also, if a reference A' shares some of the same admixture history as C or is simply very closely related to C, the pre-test will typically identify long-range correlated LD and deem A' an unsuitable reference to use for testing admixture.In our case, A'=Armenians and C=Turks. We can be fairly sure that Armenians lack the same admixture history as Turks (because they were not affected by Central Asian Turkic invasions), but we can try a 1-ref analysis of Armenians with Uzbeks to substantiate it. The admixture lower bound estimate is a huge interval 7.6 +/- 88.2 and the jackknife is unable to estimate the admixture time. Thus, more plausibly, the second explanation applies, and because Armenians_Y are very closely related to Turks, they are deemed as an inappropriate reference to test admixture.
Finally, the lower bound of the admixture fraction for Turks with an Uzbek reference is estimated as:
Mixture fraction % lower bound (assuming admixture): 29.8 +/- 4.0
This is a very interesting number. We can be fairly sure that Central Asian Turkic people who invaded Anatolia carried with them an East Eurasian component, but in what proportion to their West Eurasian one? The East Eurasian element in Turks has been rather consistently estimated at ~5-7% with various methods, so perhaps this formed the minority element in the Turkic people who arrived in Anatolia.
On the other hand, this case is rather muddled by the occurrence of by-directional gene flow: Uzbeks may have West Eurasian ancestry of ultimate West Asian origin, just as Turks have Central Asian ancestry. And, indeed, when we estimate the admixture fraction of Uzbeks with the Turks as a reference, we obtain:
Mixture fraction % lower bound (assuming admixture): 46.7 +/- 2.4
The age estimate for this is ~16 +/- 2 generations = 460 +/- 60 years. Very similar time estimates appear when Armenians are used as a West Eurasian reference. So, this might indicate that the Uzbek population was formed by admixture after the Anatolian Turks were so formed.
I see no easy way to solve the problem of estimating admixture proportions when both extant populations have been both donors and recipients of gene flow, but in any case, these numbers are something to think about.
Analysis of Turks with a variety of Turkic and East Asian populations
I subsequently formed a new dataset by merging the sample of Turks with a variety of Turkic and East Asian populations (same procedure for SNP choice).

For the calendar year calculation, I arbitrarily set the birthdate of the modern sampled individuals at 1980; I have no idea on the age profile of the individuals comprising the Behar et al. sample of Turks. I have also used a mindis=0.5cM which facilitated the convenient automated extraction of the dates from the ALDER output and also gave a level playing field for all the reference populations. The age picked by ALDER using its own adaptive threshold did not usually differ from the reported one by more than a few generations.
The results indicate two things:
Analysis of Turks with a variety of Turkic and East Asian populations
I subsequently formed a new dataset by merging the sample of Turks with a variety of Turkic and East Asian populations (same procedure for SNP choice).

For the calendar year calculation, I arbitrarily set the birthdate of the modern sampled individuals at 1980; I have no idea on the age profile of the individuals comprising the Behar et al. sample of Turks. I have also used a mindis=0.5cM which facilitated the convenient automated extraction of the dates from the ALDER output and also gave a level playing field for all the reference populations. The age picked by ALDER using its own adaptive threshold did not usually differ from the reported one by more than a few generations.
The results indicate two things:
- The % of admixture depends on the choice of population, with highest amount using Uzbeks as a reference, and lowest using the far Asian populations from China. This indicates our uncertainty regarding the East/West Eurasian-ness of the people who settled in Anatolia.
- Admixture times, on the other hand appear to be fairly constant and appear to frame an important watershed moment of Anatolian history, the Battle of Manzikert which paved the way for the eventual Turkification of the peninsula. The Turkmen sample appears as an outlier in this respect, which might indicate that limited migration of Turkmen tribes may have occurred at a later date.
Admixture in the Chuvash and the Uygur
I took the Behar et al. (2010) sample of Chuvash, excluding GSM536731 which has atypical ancestry and merged it with the Li et al. HGDP French_Basque and Dai. The latter two populations don't show evidence of admixture according to both the f3-statistic and ALDER (Loh et al. 2012). (I used a --geno 0.03 flag in PLINK and extracted a subset of SNPs including in the Rutgers recombination map for Illumina chips).
The f3-statistic f3(Chuvashs_16; French_Basque, Dai) was equal to -0.011311 (Z=-31.308), indicative of admixture.
I then ran an ALDER analysis:
Test SUCCEEDS (z=4.85, p=1.2e-06) for Chuvashs_16 with {French_Basque, Dai} weights
DATA: success (warning: decay rates inconsistent) 1.2e-06 Chuvashs_16 French_Basque Dai 4.85 3.78 5.18 50% 40.27 +/- 5.80 0.00032377 +/- 0.00006676 28.21 +/- 7.47 0.00004231 +/- 0.00000962 47.08 +/- 4.53 0.00016628 +/- 0.00003212
DATA: test status p-value test pop ref A ref B 2-ref z-score 1-ref z-score A 1-ref z-score B max decay diff % 2-ref decay 2-ref amp_exp 1-ref decay A 1-ref amp_exp A 1-ref decay B 1-ref amp_exp B
The f3-statistic f3(Chuvashs_16; French_Basque, Dai) was equal to -0.011311 (Z=-31.308), indicative of admixture.
I then ran an ALDER analysis:
Test SUCCEEDS (z=4.85, p=1.2e-06) for Chuvashs_16 with {French_Basque, Dai} weights
DATA: success (warning: decay rates inconsistent) 1.2e-06 Chuvashs_16 French_Basque Dai 4.85 3.78 5.18 50% 40.27 +/- 5.80 0.00032377 +/- 0.00006676 28.21 +/- 7.47 0.00004231 +/- 0.00000962 47.08 +/- 4.53 0.00016628 +/- 0.00003212
DATA: test status p-value test pop ref A ref B 2-ref z-score 1-ref z-score A 1-ref z-score B max decay diff % 2-ref decay 2-ref amp_exp 1-ref decay A 1-ref amp_exp A 1-ref decay B 1-ref amp_exp B
This indicates that the Chuvash can be seen as admixed, but with inconsistent decays: the one with the French Basque (=28.21) is younger than the one with the Dai (=47.08). I think this makes fairly good sense, because the Chuvash are descended from people who came to Europe during the 1st millennium AD and must have later mixed with Europeans, perhaps with eastern Slavs as these made their way eastward during the 2nd millennium AD.
I then carried out similar analyses on the HGDP Uygur. As expected f3(Uygur; French_Basque, Dai) = -0.023917 (Z = -60.362), indicative of admixture. The ALDER analysis:
Test SUCCEEDS (z=6.85, p=7.4e-12) for Uygur with {French_Basque, Dai} weights
DATA: success 7.4e-12 Uygur French_Basque Dai 6.85 4.47 7.39 15% 20.56 +/- 3.00 0.00036760 +/- 0.00003660 22.59 +/- 5.06 0.00010920 +/- 0.00002025 19.46 +/- 2.64 0.00007864 +/- 0.00000710
DATA: test status p-value test pop ref A ref B 2-ref z-score 1-ref z-score A 1-ref z-score B max decay diff % 2-ref decay 2-ref amp_exp 1-ref decay A 1-ref amp_exp A 1-ref decay B 1-ref amp_exp B
Test SUCCEEDS (z=6.85, p=7.4e-12) for Uygur with {French_Basque, Dai} weights
DATA: success 7.4e-12 Uygur French_Basque Dai 6.85 4.47 7.39 15% 20.56 +/- 3.00 0.00036760 +/- 0.00003660 22.59 +/- 5.06 0.00010920 +/- 0.00002025 19.46 +/- 2.64 0.00007864 +/- 0.00000710
DATA: test status p-value test pop ref A ref B 2-ref z-score 1-ref z-score A 1-ref z-score B max decay diff % 2-ref decay 2-ref amp_exp 1-ref decay A 1-ref amp_exp A 1-ref decay B 1-ref amp_exp B
suggests a very recent admixture on both the European and East Asian side. It seems fairly clear that whatever admixture was taking place in Central Asia, perhaps for thousands of years, the present-day Ugyur were formed, at least in part, by a fairly recent, perhaps post-Mongol admixture event.
September 22, 2012
Structural stability and ancient connections between languages

Using a large database and many alternative methods Dediu and Levinson show that both positions are right: there are universal tendencies for some features to be more stable than others, but individual language families have their own distinctive profile. These distinctive profiles can then be used to probe ancient relations between what are today independent language families.
"Using this technique we find for instance probable connections between the languages of the Americas and those of NE Eurasia, presumably dating back to the peopling of the Americas 12,000 years or more ago," Levinson explains. "We also find likely connections between most of the Eurasian language families, presumably pre-dating the split off of Indo-European around 9000 years ago."
From the paper:
Quite convincing is the evidence that Core Eurasian families (comprising Altaic – or Mongolic + Turkic –, Dravidian, Indo-European, Uralic and the Caucasian families) might form a group (p=0.0013, 5 methods, and , p=0.094, 4 methods, when controlling for geography).The authors were also able to reject the "broad" Afroasiatic group "comprising Afro-Asiatic, Indo-European, Dravidian and Uralic". I think this makes some sense, since Afroasiatic is basically an African language family with a Near Eastern offshoot, so I did not expect it to group with the Eurasian language families.
The Core Eurasian group seems very interesting in light of accumulating evidence about contacts between human groups across Eurasia. Such a group is pushing the limits of what can be inferred using linguistic data, and, perhaps, archaeogenetics might provide some evidence that might be used to plausibly argue for such a relatively broad group.
PLoS ONE 7(9): e45198. doi:10.1371/journal.pone.0045198
Abstract Profiles of Structural Stability Point to Universal Tendencies, Family-Specific Factors, and Ancient Connections between Languages
Dan Dediu, Stephen C. Levinson
Language is the best example of a cultural evolutionary system, able to retain a phylogenetic signal over many thousands of years. The temporal stability (conservatism) of basic vocabulary is relatively well understood, but the stability of the structural properties of language (phonology, morphology, syntax) is still unclear. Here we report an extensive Bayesian phylogenetic investigation of the structural stability of numerous features across many language families and we introduce a novel method for analyzing the relationships between the “stability profiles” of language families. We found that there is a strong universal component across language families, suggesting the existence of universal linguistic, cognitive and genetic constraints. Against this background, however, each language family has a distinct stability profile, and these profiles cluster by geographic area and likely deep genealogical relationships. These stability profiles seem to show, for example, the ancient historical relationships between the Siberian and American language families, presumed to be separated by at least 12,000 years, and possible connections between the Eurasian families. We also found preliminary support for the punctuated evolution of structural features of language across families, types of features and geographic areas. Thus, such higher-level properties of language seen as an evolutionary system might allow the investigation of ancient connections between languages and shed light on the peopling of the world.
Link
July 26, 2012
A look at Y chromosomes of Romania via Count Dracula
In short: researchers tried to see whether they could identify a specific Y chromosome lineage associated with the House of Basarab in Romania, the most famous member of which is Vlad the Impaler, an inspiration for the mythical Count Dracula. To do this, they tested Basarab-surnamed individuals, as well as the general Romanian population.
The whole exercise was, in a sense, a failure, since it neither disclosed a Basarab-specific lineage, nor resolved the historical question about the origin of the House of Basarab (Vlach or Cuman). But, it gave us some wonderful new data on Romania that is, of course, quite welcome.
This seems like a good candidate for a future ancient DNA study, assuming of course, that Vlad and his family are still in their final resting place, and there are brave enough researchers to disturb them (j/k).
On a more serious note, the authors correctly state that even if the Basarab house was originally Turkic, they could still have carried West Eurasian chromosomes, since incoming Turkic groups in Europe were not purely Mongoloid like their more remote ancestors. On the other hand, I note that most of the Basarab-surnamed individuals belonged to E-V13, I-P37.2, J-M241 all of which are almost certainly native Romanian. If one of them carries the original chromosome, then the odds are in favor of a Romanian origin, although nothing short of ancient DNA work can resolve the issue, assuming that's possible.
Table S1 contains the new Romanian data, and Table S2 data from surrounding populations (Hungary, Bulgaria, Ukraine).
PLoS ONE 7(7): e41803. doi:10.1371/journal.pone.0041803
Y-Chromosome Analysis in Individuals Bearing the Basarab Name of the First Dynasty of Wallachian Kings
Begoña Martinez-Cruz et al.
Vlad III The Impaler, also known as Dracula, descended from the dynasty of Basarab, the first rulers of independent Wallachia, in present Romania. Whether this dynasty is of Cuman (an admixed Turkic people that reached Wallachia from the East in the 11th century) or of local Romanian (Vlach) origin is debated among historians. Earlier studies have demonstrated the value of investigating the Y chromosome of men bearing a historical name, in order to identify their genetic origin. We sampled 29 Romanian men carrying the surname Basarab, in addition to four Romanian populations (from counties Dolj, N = 38; Mehedinti, N = 11; Cluj, N = 50; and Brasov, N = 50), and compared the data with the surrounding populations. We typed 131 SNPs and 19 STRs in the non-recombinant part of the Y-chromosome in all the individuals. We computed a PCA to situate the Basarab individuals in the context of Romania and its neighboring populations. Different Y-chromosome haplogroups were found within the individuals bearing the Basarab name. All haplogroups are common in Romania and other Central and Eastern European populations. In a PCA, the Basarab group clusters within other Romanian populations. We found several clusters of Basarab individuals having a common ancestor within the period of the last 600 years. The diversity of haplogroups found shows that not all individuals carrying the surname Basarab can be direct biological descendants of the Basarab dynasty. The absence of Eastern Asian lineages in the Basarab men can be interpreted as a lack of evidence for a Cuman origin of the Basarab dynasty, although it cannot be positively ruled out. It can be therefore concluded that the Basarab dynasty was successful in spreading its name beyond the spread of its genes.
July 22, 2012
Clarifying the phylogeny of Y-chromosome haplogroup C3c

From the paper:
In our study, the highest frequencies of subhaplogroup C3c1-(M77, M86) were observed in Tungusic-speaking people of North-Eastern Asia, such as Evens and Evenks, as well as in Turkic-speaking Altaian Kazakhs and Mongolic-speaking Kalmyks. These results are in agreement with previous observations based on separate or joint genotyping of M77 and M86 markers.3,9,12,16The authors apply the evolutionary mutation rate -although they acknowledge that molecular dating is controversial- to obtain ages of 9.9 (C3c), 6.5 (C3c1), and 4.5 (C3c*). While I don't trust the ability of Y-STR-based molecular dating to provide reasonably accurate age estimates, I would not be surprised if C3c1 was somehow implicated in the deeper origins of the Altaic language family, at least in the "narrow-sense" (Mongolian-Tungusic-Turkic).
C3c* haplotypes were detected in aboriginal populations of North- Eastern Asia—Koryaks (28.2%) and Evens (1.6%) from the Sea of Okhotsk coast (Magadan region) and West Evenks (2.4%) from Central Siberia (Evenki Autonomous District) (Table 1). Earlier, two Evenk individuals from southern part of Yakutia, one Yakut-speaking Evenk and one Yukaghir were found to belong to C3c*.2,3 Therefore, the geographic distribution of subhaplogroup C3c* is limited to the eastern part of Siberia.
J Hum Genet. 2012 Jul 19. doi: 10.1038/jhg.2012.93. [Epub ahead of print]
On the Y-chromosome haplogroup C3c classification.
Malyarchuk BA, Derenko M, Denisova G.
Abstract As there are ambiguities in classification of the Y-chromosome haplogroup C3c, relatively frequent in populations of Northern Asia, we analyzed all three haplogroup-defining markers M48, M77 and M86 in C3-M217-individuals from Siberia, Eastern Asia and Eastern Europe. We have found that haplogroup C3c is characterized by the derived state at M48, whereas mutations at both M77 and M86 define subhaplogroup C3c1. The branch defined by M48 alone would belong to subhaplogroup C3c*, characteristic for some populations of Central and Eastern Siberia, such as Koryaks, Evens, Evenks and Yukaghirs. Subhaplogroup C3c* individuals could be considered as remnants of the Neolithic population of Siberia, based on the age of C3c*-short tandem repeat variation amounting to 4.5±2.4 thousand years.
Link
March 31, 2012
Three quarters of Kerey clan men belong to Genghis Khan Y chromosome cluster
From the paper:
More:
Human Biology: Vol. 84: Iss. 1, Article 4.
The Y-chromosome C3* star-cluster attributed to Genghis Khan's descendants is present at high frequency in the Kerey clan from Kazakhstan
Serikbai Abilev et al.
In order to verify the possibility that the Y-chromosome C3* star-cluster attributed to Genghis Khan and his patrilineal descendants is relatively frequent in the Kereys, who are the dominant clan in Kazakhstan and in Central Asia as a whole, polymorphism of the Y-chromosome was studied in Kazakhs, represented mostly by members of the Kerey clan. The Kereys showed the highest frequency (76.5%) of individuals carrying the Y-chromosome variant known as C3* star-cluster ascribed to the descendants of Genghis Khan. C3* star-cluster haplotypes were found in two sub-clans, Abakh-Kereys and Ashmaily-Kereys, diverged about 20-22 generations ago according to the historical data. Median network of the Kerey star-cluster haplotypes at 17 STR loci displays a bipartite structure, with two subclusters defined by the only difference at DYS448 locus. It is noteworthy that there is a strong correspondence of these subclusters with the Kerey sub-clans affiliation. The data obtained suggest that the Kerey clan appears to be the largest known clan in the world descending from a common Y-chromosome ancestor. Possible ways of Genghis Khan‟s relation to the Kereys are discussed.
Link
According to the historical data, the split between two sub-clans of the Kereys occurred about 20-22 generations ago (Khalidullin 2005). Estimation of divergence time (TD) of two groups of 15 STR haplotypes (except for DYS385a,b loci) found in the Kereys sub-clans demonstrates that TD value equal to 630 ± 190 years (or approximately 21 ± 6 generations) is resulted when a mean of per-locus, per-generation mutation rate of 0.0033 and a 30-year generation time are used. Note that similar value of mutation rate (0.00324) has been calculated as optimal for 15 STR haplotypes by Busby et al. (2011) who have investigated the question on how average squared distance (ASD) estimates change within haplotype sets when using different combinations of Y-chromosome STRs. This mutation rate belongs to a class of so called genealogical STR mutation rates revealed by direct observation in father/son pairs (Kayser et al. 2000; Goedbloed et al. 2009).The correspondence between the split time of the Kerey sub-clans and the age estimate of their Y-STR divergence is quite interesting and provides an independent historical argument for the correspondence between the C3* star cluster and Genghis Khan (or at least his direct patrilineal kin). Note that the star cluster's age matches G. K. only using a genealogical mutation rate, and not the widely (mis)used "effective mutation rate. The timeframe is recent enough to render any saturation effects from non-linearity (as described by Busby et al.) relatively unimportant.
More:
The data reported above, taken together with the known arguments in favor of the
possible Genghis Khan‟s descent of Y-chromosome C3* star-cluster (Zerjal et al. 2003), allow us to suggest two hypotheses.
(1) The star-cluster is not directly related to the descendants of Genghis Khan, but rather is associated with the Kerait clan members. Mongol conquest with participation of the Keraits as special Khan‟s military forces allowed them to disseminate the Kerait-specific Y-chromosomes in the vast area inhabited by various peoples.
(2) Genghis Khan by himself belonged to the Keraits. This is supported by the following historical evidence (Man 2004; Khalidullin 2005). The Keraits inhabited the banks of the Onon River, where the camp of Genghis Khan‟s father Yesukhei was located. Yesukhei was declared as a blood brother of the Keraits‟ Khan Toghrul (Wang Khan). Toghrul then declared Genghis Khan his son-in-law. Fraternization of the Genghis Khan family with the Keraits‟ Khan suggests that a real blood relationship, though probably not approved officially, existed between them.
Human Biology: Vol. 84: Iss. 1, Article 4.
The Y-chromosome C3* star-cluster attributed to Genghis Khan's descendants is present at high frequency in the Kerey clan from Kazakhstan
Serikbai Abilev et al.
In order to verify the possibility that the Y-chromosome C3* star-cluster attributed to Genghis Khan and his patrilineal descendants is relatively frequent in the Kereys, who are the dominant clan in Kazakhstan and in Central Asia as a whole, polymorphism of the Y-chromosome was studied in Kazakhs, represented mostly by members of the Kerey clan. The Kereys showed the highest frequency (76.5%) of individuals carrying the Y-chromosome variant known as C3* star-cluster ascribed to the descendants of Genghis Khan. C3* star-cluster haplotypes were found in two sub-clans, Abakh-Kereys and Ashmaily-Kereys, diverged about 20-22 generations ago according to the historical data. Median network of the Kerey star-cluster haplotypes at 17 STR loci displays a bipartite structure, with two subclusters defined by the only difference at DYS448 locus. It is noteworthy that there is a strong correspondence of these subclusters with the Kerey sub-clans affiliation. The data obtained suggest that the Kerey clan appears to be the largest known clan in the world descending from a common Y-chromosome ancestor. Possible ways of Genghis Khan‟s relation to the Kereys are discussed.
Link
March 28, 2012
A rare look at the Y chromosomes of Afghanistan
I often bemoan the fact that some of the regions of the world that are most interesting to the student of prehistory (e.g., Mesopotamia and the Iranian Plateau) seem to also be the ones with more than their fair share of political trouble, hindering efforts to study them with the newest set of tools. Afghanistan is certainly one case that hasn't been quite the most welcoming of places in recent decades.
The country is transitional between the Iranic speaking world of Iran and the Indo-Aryan speaking world of South Asia, as well as between the Indo-Iranian world and the (mostly) Turkic-speaking world of Central Asia. Hence, the absence of data for that country has been acutely felt for all those who are trying to understand "what happened" in Eurasia.
The appearance of a new paper by the Genographic Project is a welcome sight, and a good example of what is best about this Project. I haven't been exactly a fan of the Genographic's interpretation of their own data, but kudos to them for getting them in the first place.
From the paper:
 -The PCA analysis (left) showcases wonderfully the correspondence between different haplogroups and the three main regions of the Near East (green), South Asia (yellow), and Central Asia (purple).
It is a real shame that the newer markers available within the most prominent R-M17 haplogroup were not tested:
From the paper:
Looking at the Y-haplogroup composition:

A few points of interest:
Hopefully, the data can be re-used down the road once the phylogeny of different haplogroups (and R1a in particular) is better understood. As I've stated before on this blog, I take Y-STR based age estimates with a huge grain of salt, so I would not put much faith in any of the ones presented in this paper.
Related: Firasat et al. (2006), Y-chromosomes of Afghanistan, Lashgary et al. (2011), Regueiro et al. (2006).
PLoS ONE doi:10.1371/journal.pone.0034288
Afghanistan's Ethnic Groups Share a Y-Chromosomal Heritage Structured by Historical Events
Marc Haber et al.
Abstract
Afghanistan has held a strategic position throughout history. It has been inhabited since the Paleolithic and later became a crossroad for expanding civilizations and empires. Afghanistan's location, history, and diverse ethnic groups present a unique opportunity to explore how nations and ethnic groups emerged, and how major cultural evolutions and technological developments in human history have influenced modern population structures. In this study we have analyzed, for the first time, the four major ethnic groups in present-day Afghanistan: Hazara, Pashtun, Tajik, and Uzbek, using 52 binary markers and 19 short tandem repeats on the non-recombinant segment of the Y-chromosome. A total of 204 Afghan samples were investigated along with more than 8,500 samples from surrounding populations important to Afghanistan's history through migrations and conquests, including Iranians, Greeks, Indians, Middle Easterners, East Europeans, and East Asians. Our results suggest that all current Afghans largely share a heritage derived from a common unstructured ancestral population that could have emerged during the Neolithic revolution and the formation of the first farming communities. Our results also indicate that inter-Afghan differentiation started during the Bronze Age, probably driven by the formation of the first civilizations in the region. Later migrations and invasions into the region have been assimilated differentially among the ethnic groups, increasing inter-population genetic differences, and giving the Afghans a unique genetic diversity in Central Asia.
Link
The country is transitional between the Iranic speaking world of Iran and the Indo-Aryan speaking world of South Asia, as well as between the Indo-Iranian world and the (mostly) Turkic-speaking world of Central Asia. Hence, the absence of data for that country has been acutely felt for all those who are trying to understand "what happened" in Eurasia.
The appearance of a new paper by the Genographic Project is a welcome sight, and a good example of what is best about this Project. I haven't been exactly a fan of the Genographic's interpretation of their own data, but kudos to them for getting them in the first place.
From the paper:
Pashtuns are the largest ethnic group in Afghanistan, accounting for about 42 percent of the population, with Tajiks (27%), Hazaras (9%), Uzbeks (9%), Aimaqs (4%), Turkmen people (3%), Baluch (2%), and other groups (4%) making up the remainder [6]. In the present study, eight ethnic groups were examined, with a focus on the largest four groups: - The Pashtuns, traditionally lived a seminomadic lifestyle, they reside mainly in southern and eastern Afghanistan and in western Pakistan. They speak Pashto which is a member of the Eastern Iranian languages. - The Tajiks are a Persian-speaking ethnic group which are closely related to the Persians of Iran. In Afghanistan, they are the largest Tajik population outside their homeland to the north in Tajikistan. - The Hazara population speaks Persian with some Mongolian words. They believe they are descendants of Genghis Khan's army that invaded during the twelfth century. - The Uzbeks are a Turkic speaking group that have been living a sedentary farming lifestyle in Northern Afghanistan.The main features of the Y-chromosome gene pool:
Genotyping revealed 32 halpogroups present in Afghanistan's ethnic groups among our samples. Haplogroups R1a1a-M17, C3-M217, J2-M172, and L-M20 were the most frequent when Afghan ethnic groups were pooled, together comprising >66% of the chromosomes. Absolute and relative haplogroup frequencies are tabulated in Table S4.

It is a real shame that the newer markers available within the most prominent R-M17 haplogroup were not tested:
The prevailing Y-chromosome lineage in Pashtun and Tajik (R1a1a-M17), has the highest observed diversity among populations of the Indus Valley [46]. R1a1a-M17 diversity declines toward the Pontic-Caspian steppe where the mid-Holocene R1a1a7-M458 sublineage is dominant [46]. R1a1a7-M458 was absent in Afghanistan, suggesting that R1a1a-M17 does not support, as previously thought [47], expansions from the Pontic Steppe [3], bringing the Indo-European languages to Central Asia and India.Nonetheless, I can't really disagree with the dismissal of the R-M17/Indo-European theory. R-M17 is simply too populous in South Asia to be the genetic legacy of "Indo-Europeans": (i) under an elite-dominance model, its frequency is way too high (compared to well-attested examples of elite dominance, e.g., Hungary or Turkey where the genetic legacy of the elite element is in the minority), (ii) under a folk migration model, it is difficult to understand why a hypothetical migrating Indo-European people would have such an overwhelming influence in the region while at the same time hardly influencing at all other densely occupied agricultural landscapes of the Eurasian steppe periphery; moreover, no autosomal signal corresponding to a migration from eastern Europe to South Asia really exists -the main cline of variation links South with West Asia, not Europe- and the small signal that does exist does not really correspond to observed levels of R-M17.
From the paper:
The E1b1b1-M35 lineages in some Pakistani Pashtun were previously traced to a Greek origin brought by Alexander's invasions [48]. However, RM network of E1b1b1-M35 found that Afghanistan's lineages are correlated with Middle Easterners and Iranians but not with populations from the Balkans.Greek populations are not homogeneous in their haplogroup E frequencies, so it would be useful to consider the possibility that the lack of this frequent Southeastern European haplogroup in South Asia may not reflect a complete lack of Greek influence in this region, but rather, an influence from a structured ancient Greek population.
Looking at the Y-haplogroup composition:

- The clear link between C/N/O with Central Asia
- A clear difference between Persian and Pashto speakers in terms of inverse J2a/R1a frequences
- The paucity of J1 chromosomes (only 1 Tajik) testifies to the absence of relatively recent Middle Eastern influences associated with the spread of Islam; consistent with the absence of the autosomal "Southwest Asian" component in South/Central Asia.
- Paucity of R1b, except in a couple Uzbeks and a Tajik; I have argued before that R1a had an early distribution in the arc of flatlands north and east of the Caspian, while R1b a complementary distribution in the smaller arc of the highlands west and south of it, out of which the Tocharians may have originated.
- The small Nurestani sample comprises of J2a, R1a, and R2; these are linguistic relatives of the Kalash of Pakistan who -unlike the latter- were converted to Islam in the 19th century.
Hopefully, the data can be re-used down the road once the phylogeny of different haplogroups (and R1a in particular) is better understood. As I've stated before on this blog, I take Y-STR based age estimates with a huge grain of salt, so I would not put much faith in any of the ones presented in this paper.
Related: Firasat et al. (2006), Y-chromosomes of Afghanistan, Lashgary et al. (2011), Regueiro et al. (2006).
PLoS ONE doi:10.1371/journal.pone.0034288
Afghanistan's Ethnic Groups Share a Y-Chromosomal Heritage Structured by Historical Events
Marc Haber et al.
Abstract
Afghanistan has held a strategic position throughout history. It has been inhabited since the Paleolithic and later became a crossroad for expanding civilizations and empires. Afghanistan's location, history, and diverse ethnic groups present a unique opportunity to explore how nations and ethnic groups emerged, and how major cultural evolutions and technological developments in human history have influenced modern population structures. In this study we have analyzed, for the first time, the four major ethnic groups in present-day Afghanistan: Hazara, Pashtun, Tajik, and Uzbek, using 52 binary markers and 19 short tandem repeats on the non-recombinant segment of the Y-chromosome. A total of 204 Afghan samples were investigated along with more than 8,500 samples from surrounding populations important to Afghanistan's history through migrations and conquests, including Iranians, Greeks, Indians, Middle Easterners, East Europeans, and East Asians. Our results suggest that all current Afghans largely share a heritage derived from a common unstructured ancestral population that could have emerged during the Neolithic revolution and the formation of the first farming communities. Our results also indicate that inter-Afghan differentiation started during the Bronze Age, probably driven by the formation of the first civilizations in the region. Later migrations and invasions into the region have been assimilated differentially among the ethnic groups, increasing inter-population genetic differences, and giving the Afghans a unique genetic diversity in Central Asia.
Link
March 16, 2012
TreeMix analysis of North Eurasians (and an African surprise)
I have used my K12b dataset to isolate a set of 537 individuals who had less than 10% membership in the South Asian, Northwest African, Southeast Asian, South Asian, East African, Gedrosia, South Asian, East African, Southwest_Asian, and Sub_Saharan components. Hence, the remaining 537 individuals had 90%+ membership in the remaining Atlantic_Med, North_European, Caucasus, Siberian, and East_Asian components.


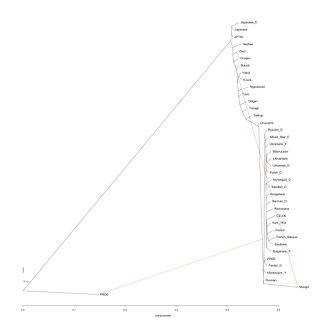


 The aforementioned (French_Basque,Sardinian)-to-Yoruba (64%), (Buryat,*)-to-Mongol (85%), Nganasan-to-Selkup (68%), 90% (Buryat, *)-to-Tuva persist, 18% Oroqen-to-(Yakut, Evenk), persist, and a new 16% Nganasan-to-Oroqen edge appears. Interestingly, this has allowed the Oroqen and Hezhen to now form their own clade, which makes sense as these are both Tungusic speakers from northeastern China. The other Tungusic population, the Evenk group with the Turkic Yakut: what they share in common is that they both share origins close to Lake Baikal in Siberia.
7 migration edges:
 The aforementioned (French_Basque,Sardinian)-to-Yoruba (64%), (Buryat,*)-to-Mongol (85%), Nganasan-to-Selkup (68%), 90% (Buryat, *)-to-Tuva persist, 18% Oroqen-to-(Yakut, Evenk), 16% Nganasan-to-Oroqen edges persist, and there is a new 81% Evenk-to-Yukagir edge. The remainder of the Yukagirs' ancestry is derived from the West Eurasian tree. The Yukagir language is rather mysterious, with some links to Uralic having been postulated. Here it pays off to look at the population portraits, since it is apparent that -unlike the Selkup- their West Eurasian ancestry is limited to a few individuals.
It is fairly interesting that Russian anthropologists placed the Yukagirs in the Baikal group of the Central Asian race, the same as the Evenks, who are their biggest donors. So, Yakuts, Evenks, and Yukagirs all seem to share the same Baikal-type of origin.
8 migration edges:


- The Atlantic_Med component is frequent in northwestern Europe
- The North_European component is dominant in northeastern Europe and forays into Siberia
- The Caucasus component is dominant in the Caucasus and forays into Central Asia
- The Siberian component is dominant in North Asia and forays into Europe
- The East_Asian component is frequent in East Asia and forays into North Asia
Russian_D, Polish_D, German_D, Finnish_D, Swedish_D, Mixed_Slav_D, Norwegian_D, Lithuanian_D, Japanese_D, Daur, French, French_Basque, Hezhen, Japanese, Oroqen, Russian, Sardinian, Yakut, CEU30, JPT30, Belorussian, Chuvashs, Hungarians, Lithuanians, Romanians, Selkup, Evenk, Tuva, Yukagir, Nganassan, Dolgan, Buryat, Mongol, FIN30, Kent_1KG, Bulgarians_Y, Ukranians_Y, Mordovians_Y
Additionally, a sample of 30 Yoruba from the HapMap-3 was used as an outgroup.
TreeMix analysis
The TreeMix analysis was performed with default parameters, and allowing for a different number of migration edges.
Nomenclature: The direction of gene flow is best seen in the figure and/or associated treeout files.
For the text, I will put in (), the common ancestor of two populations, e.g., (French_Basque,Sardinian) and also as (X, *) the tree rooted at a particular node X, e.g., (Buryat, *)
0 migration edges:

The West and East Eurasian clusters are identified, with some populations with likely admixture being placed closer to the Eurasian root.
1 migration edge:

64% from (Sardinians/Basques) to Yoruba; this is difficult to interpret, but there has been evidence in the past that Africans and West Eurasians share more ancestry than Africans and East Asians do. In the linked post, I proposed a major episode of back-migration into Africa, and it is perhaps this that is being captured by this migration edge: Sardinians/Basques are the only two South-West Eurasian populations included, and any back-migration into Africa must have originated in the southern parts of West Eurasia.
Such a high level of back-migration may in fact be plausible, since Yoruba are a predominantly Y-haplogroup E bearing population, and the origin of the DE clade of the human Y-chromosome phylogeny is up in the air with both an African and Eurasian case having been advanced. Personally, I favor the Eurasian case, since within the CT clade, we have two subclades: CF (Eurasian) and DE (Eurasian/African).
Such a high level of back-migration may in fact be plausible, since Yoruba are a predominantly Y-haplogroup E bearing population, and the origin of the DE clade of the human Y-chromosome phylogeny is up in the air with both an African and Eurasian case having been advanced. Personally, I favor the Eurasian case, since within the CT clade, we have two subclades: CF (Eurasian) and DE (Eurasian/African).
Interestingly, John Hawks has recently discovered an unanticipated excess of "Neandertal ancestry" in Yoruba. This may also point to a back-migration into Africa and/or admixture of a group of Africans related to Eurasians (whom I've called Afrasians), with groups of Africans (Palaeoafricans) that split before the H. sapiens/H. neandertalensis common ancestor.
There is, however, another detail in the figure that may have escaped your notice: there is now about 0.5 worth of drift in the figure (left-to-right) as opposed to only 0.12 in the tree without migration edges. So, perhaps what we are seeing is indeed the first sign of admixture between modern and archaic humans in Africa, which has been made more likely by recent anthropological discoveries.
It's not clear to me whether TreeMix has stumbled onto something important or not, but it is certainly worth keeping in mind that the above model fits the data better than the simple tree model. Moreover, TreeMix attempts to reverse the polarity of migration edges, and -apparently- the (Sardinian, French_Basque)-to-Yoruba edge is preferable to the reverse.
So, we should keep our minds open to the possibility that the greater similarity of West Eurasians to Africans is not the result of multiple Out-of-Africa waves, one of which affected only West Eurasians, but of an Into-Africa back-migration from West Eurasia.
So far, tree-based models have focused on how diverse African groups are, and hence, the reduced diversity of Eurasians has been interpreted as an Out-of-Africa bottleneck that carried a subset of African variation into Eurasia.
But, there is an alternative interpretation of the evidence, namely that African groups are diverse because they carry a superset of ancient Into-Africa variation, with the African-specific part of their variation being the result of admixture with pre-existing African hominins. Such a scenario cannot be captured by tree models, but is apparently considered and not rejected by TreeMix which allows for lateral gene flow. Let's wait and see what new things come from full genome sequencing.
So, we should keep our minds open to the possibility that the greater similarity of West Eurasians to Africans is not the result of multiple Out-of-Africa waves, one of which affected only West Eurasians, but of an Into-Africa back-migration from West Eurasia.
So far, tree-based models have focused on how diverse African groups are, and hence, the reduced diversity of Eurasians has been interpreted as an Out-of-Africa bottleneck that carried a subset of African variation into Eurasia.
But, there is an alternative interpretation of the evidence, namely that African groups are diverse because they carry a superset of ancient Into-Africa variation, with the African-specific part of their variation being the result of admixture with pre-existing African hominins. Such a scenario cannot be captured by tree models, but is apparently considered and not rejected by TreeMix which allows for lateral gene flow. Let's wait and see what new things come from full genome sequencing.
2 migration edges:

The (French_Basque/Sardinian)-to-Yoruba edge persists (64%) and a new edge was added from (Buryat, *)-to-Mongol (85%). The "Mongol" sample consists of Siberian Mongols described by Rasmussen et al. (2010). An inspection of their K12b population portrait indicates that they do, in fact, have West Eurasian admixture, which according to the K12b spreadsheet amounts to about 18% in total.
3 migration edges:

The aforementioned (French_Basque/Sardinian)-to-Yoruba (64%) and (Buryat,*)-toMongol (85%) edges persist, and now we have a 68% Nganasan-to-Selkup edge.
These are the two Siberian Uralic populations in the dataset. This seems to parallel the K12b results, as Selkups have a North_European element which the Nganasans (Uralic speakers from the Arctic coast of Central Siberia lack), so we are seeing the hybridity of the Selkups here, who, like the Mongol sample are partly of West Eurasian ancestry.
4 migration edges:

The aforementioned (French_Basque,Sardinian)-to-Yoruba (64%), (Buryat,*)-to-Mongol (84%), and Nganasan-to-Selkup (68%) persist, and now we have a 89% (Buryat, *)-to-Tuva edge. According to the K12b the Tuva have 13.3% West Eurasian admixture, so again we have reasonably good agreement between TreeMix and ADMIXTURE.
Interestingly, the non-"eastern" component of Selkups and Tuvans now forms a clade. It seems that a Nganasan-like and a (Buryat, *)-like population have converged into southern Siberia, absorbed a common local element and became the Selkup and Tuva respectively.
5 migration edges:

The aforementioned (French_Basque,Sardinian)-to-Yoruba (64%), (Buryat,*)-to-Mongol (85%), Nganasan-to-Selkup (68%) persist, and 90% (Buryat, *)-to-Tuva persist, and now we have a new 18% Oroqen-to-(Yakut, Evenk) edge. The Oroqen and the Evenk are Tungusic speakers, whereas the Yakut are Turkic people from northeastern Siberia, having migrated there from the vicinity of Lake Baikal during the last millennium.
6 migration edges:
6 migration edges:

7 migration edges:

It is fairly interesting that Russian anthropologists placed the Yukagirs in the Baikal group of the Central Asian race, the same as the Evenks, who are their biggest donors. So, Yakuts, Evenks, and Yukagirs all seem to share the same Baikal-type of origin.
8 migration edges:

There is now a 64% Sardinian-to-Yoruba edge, a 16% Oroqen-to-Yukagir edge, 20% (Buryat, *)-to-(Yakut, Evenk), and a 24% Nganasan-to-Chuvash edge, 29% Oroqen-to-(Yakut,Evenk) edge, 88% (Buryat, *)-to-Tuva, 62% Nganasan-to-Selkup, 85% (Buryat, *)-to-Mongol.
The tree has been rather re-organized, with two main Siberian groups identified: an eastern group (Hezhen, Daur, Oroqen, Buryat), and a central group (Yukagir, Dolgan, Nganasan, Yakut, Evenk, Selkup). The Chuvash, predominantly Europeoid Turkic speakers from Russia show evidence of gene flow from the central group as well, whereas the Selkup, Uralic speakers from Siberia, who belong to the central group, show evidence of gene flow from Europe.
9 migration edges:

64% (French_Basque,Sardinian)-to-Yoruba, 85% (Buryat, *)-to-Mongol, 68% Nganasan-to-Selkup, 92% (Buryat,*)-to-Tuva, 14% Oroqen-to-(Yakut,Evenk), 14% Nganasan-to-Oroqen, 82% Yakut-to-Yukagir, 90% Evenk-to-Dolgan, 13% Hezhen-to-(Nganasan, *).
10 migration edges:

64% (French_Basque, Sardinian)-to-Yoruba, (85% Nganasan, *)-to-Mongol, 68% Nganasan-to-Selkup, 92% (Nganasan,*)-to-Tuva, 15% Oroqen-to-(Yakut,Evenk), 15% Nganasan-to-Oroqen, 82% Yakut-to-Yukagir, 90% Evenk-to-Dolgan, 43% Hezhen-to-Buryat, 14% Sardinian-to-Bulgarian.
I will stop at this point. I may add more migration edges later to this post, but I'm tired of typing this stuff.
You can download all the plots and *.treeout files here.
UPDATE (March 20): I have repeated the experiment with HGDP San, rather than Yoruba as the outrgroup:

There is now a 63% migration edge from (Basque, Sardinian) to San.
UPDATE (March 20): I have repeated the experiment with HGDP San, rather than Yoruba as the outrgroup:

There is now a 63% migration edge from (Basque, Sardinian) to San.
February 16, 2012
First look at Turkish and Kyrgyz data from Hodoğlugil & Mahley (2012)
The authors of the recent paper on Turkish population structure were kind enough to share their data with me. I will be sure to use this data in future experiments, such as the ChromoPainter and fastIBD analysis of Balkans/West Asia, as well as a ChromoPainter analysis of Altaic speakers, following on the footsteps of my recent analysis of Afroasiatic speakers.
PCA
As a first step, after processing the new data, I carried out a PCA analysis (in smartpca with no outlier removal iterations), combined with various Turkic groups, as well as a few neighbors of Anatolian Turks, combining data from the literature and the Dodecad Project.

The Turkic cline from East to West Eurasia, observed by myself and others in various experiments is again evident.
The blowup of the above, focusing on the West Eurasian portion (top right) is easier to read:

As always, population labels are placed in the average position of each population. So, for example, the Behar et al. Iranians_19 sample is shifted to the left, because of the existence of a few African admixed individuals in this sample. The Iranian_D sample of Project participants seem to lack this admixture.
Also, note that since there is no South Asian reference in this first experiment, Iranians overlap with Turks along the first two dimensions. As we've seen in the Dodecad Project, both Iranians and Anatolian Turks are "eastward-shifted" relative to other West Eurasians, but the former have a strong South Asian- and the latter a Central Asian- tendency.
The new Kyrgyz sample falls between the Kazakh and the Altai along the cline, and is more "eastern" compared to the Uygurs and Uzbeks, and more "western" compared to Altai, Tuva, and Dolgans.
Kayseri and Istanbul Turks overlap with Behar et al. Turks as well as the Turkish_D sample. The Aydin sample appears to be more heterogenous, with a more eastern overall center of weight. More on this below.
ADMIXTURE
I also carried out a K=3 ADMIXTURE analysis of the dataset.

Below are the population portraits for the three new Turkish samples, as well as the Kyrgyz sample:


It is obvious that many Turks have low levels of Asian admixture, lacking in their geographical neighbors, but this is quite variable on an individual basis.
UPDATE (17 Feb):
I have also assessed the new data with the K12b calculator. Below are the normalized median proportions.

PCA
As a first step, after processing the new data, I carried out a PCA analysis (in smartpca with no outlier removal iterations), combined with various Turkic groups, as well as a few neighbors of Anatolian Turks, combining data from the literature and the Dodecad Project.

The Turkic cline from East to West Eurasia, observed by myself and others in various experiments is again evident.
The blowup of the above, focusing on the West Eurasian portion (top right) is easier to read:

As always, population labels are placed in the average position of each population. So, for example, the Behar et al. Iranians_19 sample is shifted to the left, because of the existence of a few African admixed individuals in this sample. The Iranian_D sample of Project participants seem to lack this admixture.
Also, note that since there is no South Asian reference in this first experiment, Iranians overlap with Turks along the first two dimensions. As we've seen in the Dodecad Project, both Iranians and Anatolian Turks are "eastward-shifted" relative to other West Eurasians, but the former have a strong South Asian- and the latter a Central Asian- tendency.
The new Kyrgyz sample falls between the Kazakh and the Altai along the cline, and is more "eastern" compared to the Uygurs and Uzbeks, and more "western" compared to Altai, Tuva, and Dolgans.
Kayseri and Istanbul Turks overlap with Behar et al. Turks as well as the Turkish_D sample. The Aydin sample appears to be more heterogenous, with a more eastern overall center of weight. More on this below.
ADMIXTURE
I also carried out a K=3 ADMIXTURE analysis of the dataset.

Below are the population portraits for the three new Turkish samples, as well as the Kyrgyz sample:


UPDATE (17 Feb):
I have also assessed the new data with the K12b calculator. Below are the normalized median proportions.

Subscribe to:
Posts (Atom)