April 30, 2009

Tishkoff et al. on genetic structure of Africans and African Americans

(
(Updated May 1)

The importance of this new paper from the Tishkoff Lab cannot be emphasized enough. It is probably the most comprehensive study of African genetic variation to date. The supplementary material (pdf) is itself 102 pages long and should keep you busy reading for a while (free for non-subscribers).

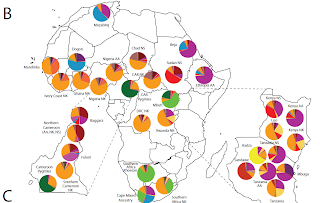
What this study has found in a nutshell is that "black" Africans belong to 14 distinct clusters. Black Americans belong overwhelmingly to the Niger-Kordofanian cluster, consistent with their origin largely from Western Africa.

The paper covers the levels of diversity in different African populations, finding that:
Within Africa, genetic diversity estimated from expected heterozygosity significantly correlates with estimates from microsatellite variance (fig. S4) (4) and varies by linguistic, geographic, and subsistence classifications (fig. S5). Three hunter-gatherer populations (Baka and Bakola Pygmies and San) were among the five populations with the highest levels of genetic diversity based on variance estimates (fig. S2A) (4). In addition, more private alleles exist in Africa than other regions (fig. S6A). Consistent with bi-directional gene flow (14), African and Middle Eastern populations shared the greatest number of alleles absent from all other populations(fig. S6B). Within Africa, the most private alleles were in southern Africa, reflecting those in southern African Khoesan (SAK) San and !Xun/Khwe populations (fig. S6C) (12). Eastern and Saharan Africans shared the most alleles absent from other African populations examined (fig. S6D).


As I have stated many times before, Bantu speakers have recently expanded from their cradle and contributed genetically to almost all other Africans, while remaining relatively pure in their own homeland:
High levels of heterogeneous ancestry (i.e. multiple cluster assignments) were observed in nearly all African individuals, with the exception of western and central African Niger-Kordofanian speakers (medium orange), who are relatively homogeneous at large K values (Fig. 5C and fig. S13). Considerable Niger-Kordofanian ancestry (shades of orange) was observed in nearly all populations, reflecting the recent spread of Bantu-speakers across equatorial, eastern, and southern Africa (26) and subsequent admixture with local populations (27).

Similarly, the high levels of diversity in East Africa are attributable in part to the multiple waves of migration into the region, which occurred in the last 5,000 years, long after the ancestral Eurasians left the continent:

East Africa, the hypothesized origin of the migration of modern humans out of Africa, has a remarkable degree of ethnic and linguistic diversity, as reflected by the greatest level of regional substructure in Africa (figs. S13, S14, and S17 to S19). The diversity among populations from this region reflects the proposed long-term presence of click-speaking Hadza and Sandawe hunter-gatherers and successive waves of immigration of Cushitic, Nilotic, and Bantu populations within the past 5,000 years (4, 28, 31, 37, 38).

The 14 clusters are: Mbugu, Chadic, Saharan Cushitic, Eastern Bantu, NiloSaharan, Saharan/Dogon, Fulani, Western Bantu, S.African Khoesan/Mbuti, Niger Kordofanian, Sandawe, Central Sudanic, Hadza, W.Pygmy.

Table S8 in the supplementary material also allows us to measure the extra-African influences in African populations (and vice versa). Mozabites, for example, from the Sahara are 60.2% "European" reflecting their substantial Caucasoid influence. The Beja possess about a third of this "European" element, the Dogon about 45%. Conversely, low-level African admixture in the Near East consists primarily of the "Cushitic" cluster.

UPDATE I (May 1):

The results of the STRUCTURE analysis on a global level (Figure S10 in the supplementary material provide a visual display of global diversity when seen in an African context. At K=14, there are 10 African and 4 non-African clusters (European, Indian, East Asian, Native American). Contrast between Central-Western and Eastern Africa is the most salient feature of the broad picture, punctuated by interesting mini-clusters formed by Pygmies, Khoi-San and Hadza.

An interesting quote from the paper (AAC=Associated Ancestral Clusters):

The Fulani and Cushitic (an eastern Afroasiatic subfamily) AACs, which likely reflect Saharan African and East African ancestry, respectively, are closest to the non-African AACs, consistent with an East African migration of modern humans out of Africa or a back-migration of non-Africans into Saharan and Eastern Africa.
I had pretty much argued as much in the old Dodona forum, that the intermediacy of certain African people between Sub-Saharan Africans and Eurasians was due both to the fact that (a) Eurasians did not originate from Africa in general, but from a specific subset of Africans that was already differentiated from the rest of Africans, and (b) there were back-migrations of Eurasians into Africa.

Related:


Science doi:10.1126/science.1172257

The Genetic Structure and History of Africans and African Americans

Sarah A. Tishkoff et al.

Abstract

Africa is the source of all modern humans, but characterization of genetic variation and of relationships among populations across the continent has been enigmatic. We studied 121 African populations, 4 African American populations, and 60 non-African populations for patterns of variation at 1327 nuclear microsatellite and insertion/deletion markers. We identified 14 ancestral population clusters in Africa that correlate with self-described ethnicity and shared cultural and/or linguistic properties. We observe high levels of mixed ancestry in most populations, reflecting historic migration events across the continent. Our data also provide evidence for shared ancestry among geographically diverse hunter-gatherer populations (Khoesan-speakers and Pygmies). The ancestry of African Americans is predominantly from Niger-Kordofanian (~71%), European (~13%), and other African (~8%) populations, although admixture levels varied considerably among individuals. This study helps tease apart the complex evolutionary history of Africans and African Americans, aiding both anthropological and genetic epidemiologic studies.

Link

Excess mortality due to the 1918-1919 flu pandemic

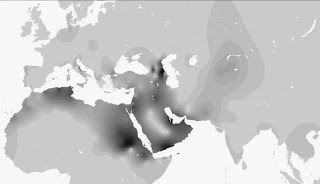
On the left, excess mortality (per 10,000) due to the pandemic. The paper (and journal) is free for the time being, so, go ahead and read it for yourselves.

Influenza and Other Respiratory Viruses doi:10.1111/j.1750-2659.2009.00080.x

Mortality burden of the 1918–1919 influenza pandemic in Europe

Séverine Ansar et al.

Abstract

Background The origin and estimated death toll of the 1918–1919 epidemic are still debated. Europe, one of the candidate sites for pandemic emergence, has detailed pandemic mortality information.

Objective To determine the mortality impact of the 1918 pandemic in 14 European countries, accounting for approximately three-quarters of the European population (250 million in 1918).

Methods We analyzed monthly all-cause civilian mortality rates in the 14 countries, accounting for approximately three-quarters of the European population (250 million in 1918). A periodic regression model was applied to estimate excess mortality from 1906 to 1922. Using the 1906–1917 data as a training set, the method provided a non-epidemic baseline for 1918–1922. Excess mortality was the mortality observed above this baseline. It represents the upper bound of the mortality attributable to the flu pandemic.

Results Our analysis suggests that 2·64 million excess deaths occurred in Europe during the period when Spanish flu was circulating. The method provided space variation of the excess mortality: the highest and lowest cumulative excess/predicted mortality ratios were observed in Italy (+172%) and Finland (+33%). Excess-death curves showed high synchrony in 1918–1919 with peak mortality occurring in all countries during a 2-month window (Oct–Nov 1918).

Conclusions During the Spanish flu, the excess mortality was 1·1% of the European population. Our study highlights the synchrony of the mortality waves in the different countries, which pleads against a European origin of the pandemic, as was sometimes hypothesized.

Link

Indus script encoded language (not)

A paper in Science aims to support the thesis that the Indus script represents a language, rather than a non-linguistic symbolic system as claimed by Steve Farmer.

Farmer, Sproat and Witzel completely reject this paper (pdf) in a quick response. I tend to agree with them. I didn't really see any strong evidence that conditional entropy can distinguish between linguistic and non-linguistic symbol systems in the Science paper, and the brevity of the Indus Script inscriptions argues strongly against the linguistic hypothesis.

(Another technical refutation at the Language Log)

Science doi:10.1126/science.1170391

Entropic Evidence for Linguistic Structure in the Indus Script

Rajesh P. N. Rao et al.

Abstract

The script of the ancient Indus civilization remains undeciphered. The hypothesis that the script encodes language has recently been questioned. Here, we present evidence for the linguistic hypothesis by showing that the script’s conditional entropy is closer to those of natural languages than various types of nonlinguistic systems.

Link

Eminence, IQ, physical and mental health

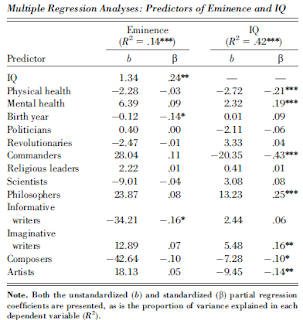
The negative relationship between physical health and IQ is the most noteworthy finding, as it goes against the observation of IQ being associated with good health. To explain this, the authors propose either that "the course that leads from initial talent to extraordinary achievement may require pathways of intellectual and social development that diverge radically from normal personal growth," or "Excessive selection can truncate the variable variances so that correlations are reduced to zero. [...] As an example, among students accepted to graduate school in psychology, the undergraduate grade point average can be negatively correlated with scores received on the Graduate Record Examination (Dawes, 1975)."

From the paper:
Relative to the average, IQ was higher among the philosophers and imaginative writers, but lower among the commanders, composers, and artists.

...

commanders, enjoyed a level of early physical health substantially above the average. [...] Second, one domain stands out as being the lowest in mental
health: the imaginative writers.

Psychological Science doi:10.1111/j.1467-9280.2009.02313.x

Eminence, IQ, Physical and Mental Health, and Achievement Domain: Cox's 282 Geniuses Revisited

Dean Keith Simonton and Anna V. Song

Abstract

Catharine Cox published two studies of highly eminent creators and leaders, the first in 1926 as the second volume of Terman's landmark Genetic Studies of Genius and the second in 1936 as a coauthored article. The former publication concentrated on the relation between IQ and achieved eminence, and the latter focused on early physical and mental health. Taking advantage of unpublished data from the second study, we examined, for the first time, the relationships among achieved eminence, IQ, early physical and mental health, and achievement domain. The correlation and regression analyses showed, for these 282 individuals, that eminence is a positive function of IQ and that IQ is a positive function of mental health and a negative function of physical health, implying an indirect effect of physical and mental health on eminence. Furthermore, levels of early physical and mental health vary across 10 specific domains of achievement.

Link

April 29, 2009

9-repeat allele at D9S1120 and a single founding population of Native Americans

The authors make a good case that this allele is not due to natural selection, but I don't really see how this demonstrates that Native Americans are primarily descended from a single founding population. Perhaps this allele occurred at a decent frequency due to genetic drift in an early group of colonists. This group later expanded in numbers, as they exploited the resources of the empty new continent, and later groups of arrivals incorporated (were incorporated by) the earlier colonists, resulting in a pervasive presence of the haplotype in question.

Related:

Molecular Biology and Evolution 2009 26(5):995-1016; doi:10.1093/molbev/msp024

Haplotypic Background of a Private Allele at High Frequency in the Americas

Kari B. Schroeder et al.

Abstract

Recently, the observation of a high-frequency private allele, the 9-repeat allele at microsatellite D9S1120, in all sampled Native American and Western Beringian populations has been interpreted as evidence that all modern Native Americans descend primarily from a single founding population. However, this inference assumed that all copies of the 9-repeat allele were identical by descent and that the geographic distribution of this allele had not been influenced by natural selection. To investigate whether these assumptions are satisfied, we genotyped 34 single nucleotide polymorphisms across ~500 kilobases (kb) around D9S1120 in 21 Native American and Western Beringian populations and 54 other worldwide populations. All chromosomes with the 9-repeat allele share the same haplotypic background in the vicinity of D9S1120, suggesting that all sampled copies of the 9-repeat allele are identical by descent. Ninety-one percent of these chromosomes share the same 76.26 kb haplotype, which we call the "American Modal Haplotype" (AMH). Three observations lead us to conclude that the high frequency and widespread distribution of the 9-repeat allele are unlikely to be the result of positive selection: 1) aside from its association with the 9-repeat allele, the AMH does not have a high frequency in the Americas, 2) the AMH is not unusually long for its frequency compared with other haplotypes in the Americas, and 3) in Latin American mestizo populations, the proportion of Native American ancestry at D9S1120 is not unusual compared with that observed at other genomewide microsatellites. Using a new method for estimating the time to the most recent common ancestor (MRCA) of all sampled copies of an allele on the basis of an estimate of the length of the genealogy descended from the MRCA, we calculate the mean time to the MRCA of the 9-repeat allele to be between 7,325 and 39,900 years, depending on the demographic model used. The results support the hypothesis that all modern Native Americans and Western Beringians trace a large portion of their ancestry to a single founding population that may have been isolated from other Asian populations prior to expanding into the Americas.

Link

Children of centenarians: extraverted and not neurotic

Journal of the American Geriatrics Society doi:

Personality Traits of Centenarians' Offspring

Jane L. Givens et al.

Abstract

OBJECTIVES: To determine whether the offspring of centenarians have personality characteristics that are distinct from the general population.

DESIGN: Case-control.

SETTING: Nationwide U.S. sample.

PARTICIPANTS: Unrelated offspring of centenarians (n=246, mean age 75) were compared with published norms.

MEASUREMENTS: Using the NEO-Five-Factor Inventory (NEO-FFI) questionnaire, measures of the personality traits neuroticism, extraversion, openness, agreeableness, and conscientiousness were obtained. T-scores and percentiles were calculated according to sex and used to interpret the results.

RESULTS: Male and female offspring of centenarians scored in the low range of published norms for neuroticism and in the high range for extraversion. The women also scored comparatively high in agreeableness. Otherwise, both sexes scored within normal range for conscientiousness and openness, and the men scored within normal range for agreeableness.

CONCLUSION: Specific personality traits may be important to the relative successful aging demonstrated by the offspring of centenarians. Similarities across four of the five domains between male and female offspring is noteworthy and may relate to their successful aging. Measures of personality are an important phenotype to include in studies that assess genetic and environmental influences of longevity and successful aging.

Link

April 28, 2009

Haplotype block structure in the cattle genome

Related:

BMC Genomics doi:10.1186/1471-2156-10-19

High-resolution haplotype block structure in the cattle genome

Rafael Villa-Angulo et al.

Abstract

Abstract (provisional)
Background

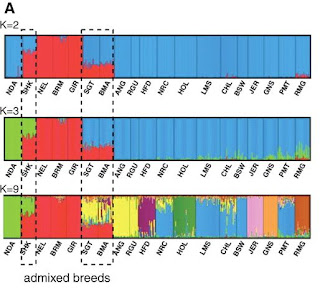
The Bovine HapMap Consortium has generated assay panels to genotype ~30,000 single nucleotide polymorphisms (SNPs) from 501 animals sampled from 19 worldwide taurine and indicine breeds, plus two outgroup species (Anoa and Water Buffalo). Within the larger set of SNPs we targeted 101 high density regions spanning up to 7.6 Mb with an average density of approximately one SNP per 4 kb, and characterized the linkage disequilibrium (LD) and haplotype block structure within individual breeds and groups of breeds in relation to their geographic origin and use.

Results


From the 101 targeted high-density regions on bovine chromosomes 6, 14, and 25, between 57 and 95% of the SNPs were informative in the individual breeds. The regions of high LD extend up to ~100 kb and the size of haplotype blocks ranges between 30 bases and 75 kb (10.3 kb average). On the scale from 1-100 kb the extent of LD and haplotype block structure in cattle has high similarity to humans. The estimation of effective population sizes over the previous 10,000 generations conforms to two main events in cattle history: the initiation of cattle domestication (~12,000 years ago), and the intensification of population isolation and current population bottleneck that breeds have experienced worldwide within the last ~700 years. Haplotype block density correlation, block boundary discordances, and haplotype sharing analyses were consistent in revealing unexpected similarities between some beef and dairy breeds, making them non-differentiable. Clustering techniques permitted grouping of breeds into different clades given their similarities and dissimilarities in genetic structure.

Conclusions

This work presents the first high-resolution analysis of haplotype block structure in worldwide cattle samples. Several novel results were obtained. First, cattle and human share a high similarity in LD and haplotype block structure on the scale of 1-100 kb. Second, unexpected similarities in haplotype block structure between dairy and beef breeds make them non-differentiable. Finally, our findings suggest that ~30,000 uniformly distributed SNPs would be necessary to construct a complete genome LD map in Bos taurus breeds, and ~580,000 SNPs would be necessary to characterize the haplotype block structure across the complete cattle genome.

Link

Inbreeding/selection and cattle domestication

Related:

BMC Genomics 2009, 10:181doi:10.1186/1471-2164-10-181

An examination of positive selection and changing effective population size in Angus and Holstein cattle populations (Bos taurus) using a high density SNP genotyping platform and the contribution of ancient polymorphism to genomic diversity in Domestic cattle.

Sean MacEachern et al.

Abstract (provisional)

Background

Identifying recent positive selection signatures in domesticated animals could provide information on genome response to strong directional selection from domestication and artificial selection. With the completion of the cattle genome, private companies are now providing large numbers of polymorphic markers for probing variation in domestic cattle (Bos taurus). We analysed over 7,500 polymorphic single nucleotide polymorphisms (SNP) in beef (Angus) and dairy (Holstein) cattle and outgroup species Bison, Yak and Banteng in an indirect test of inbreeding and positive selection in domestic cattle.

Results

Outgroup species: Bison, Yak and Banteng, were genotyped with high levels of success (90%) and used to determine ancestral and derived allele states in domestic cattle. Frequency spectrums of the derived alleles in Angus and Holstein were examined using Fay and Wu's H test. Significant divergences from the predicted frequency spectrums expected under neutrality were identified. This appeared to be the result of combined influences of positive selection, inbreeding and ascertainment bias for moderately frequent SNP. Approximately 10% of all polymorphisms identified as segregating in B. taurus were also segregating in Bison, Yak or Banteng; highlighting a large number of polymorphisms that are ancient in origin.

Conclusions

These results suggest that a large effective population size (Ne) of approximately 50,000 or more existed in B. taurus since they shared a common ancestor with Bison, Yak and Banteng > 1 million years ago (MYA). More recently Ne decreased sharply probably associated with domestication. This may partially explain the paradox of high levels of polymorphism in Domestic cattle and the relatively small recent Ne in this species. The period of inbreeding caused Fay and Wu's H statistic to depart from its expectation under neutrality mimicking the effect of selection. However, there was also evidence for selection, because high frequency derived alleles tended to cluster near each other on the genome.

Link

April 27, 2009

Domestication of common millet in East Asia at least 10,000 years old

Wikipedia entry on Proso millet that is up for an update, given the new date.

PNAS doi:10.1073/pnas.0900158106

Earliest domestication of common millet (Panicum miliaceum) in East Asia extended to 10,000 years ago

Houyuan Lu et al.

Abstract

The origin of millet from Neolithic China has generally been accepted, but it remains unknown whether common millet (Panicum miliaceum) or foxtail millet (Setaria italica) was the first species domesticated. Nor do we know the timing of their domestication and their routes of dispersal. Here, we report the discovery of husk phytoliths and biomolecular components identifiable solely as common millet from newly excavated storage pits at the Neolithic Cishan site, China, dated to between ca. 10,300 and ca. 8,700 calibrated years before present (cal yr BP). After ca. 8,700 cal yr BP, the grain crops began to contain a small quantity of foxtail millet. Our research reveals that the common millet was the earliest dry farming crop in East Asia, which is probably attributed to its excellent resistance to drought.

Link

April 26, 2009

Retroviruses and the Origin of domesticated sheep

This paper suggests an "early" dispersal of sheep from the Near East, relics of which exist in peripheral areas, and a secondary major dispersal, also from the Near East, which is responsible for most modern sheep breeds.

Remnants of the earlier sheep breeds tend to have lower-quality wool, and this suggests that the secondary dispersal of sheep was associated with the beginning of the exploitation of the sheep's fur, rather than only its meat, resulting in the popularity of the new breeds.

It will be extremely exciting to track this dispersal archaeologically. We ought to have a few diagnostic SNPs of the various breeds of all the major domesticated animals very soon, which would be relatively easy to amplify in archaeological bone samples.

From the paper:
Collectively, the data we obtained indicate that relicts of the first migrations are still present in the Mouflon of Sardinia, Corsica, and Cyprus and in breeds in peripheral north European areas.

...

The homogeneous retrotypes (R2 only, or both R2 and R4) that we observed in the sheep of modern-day Turkey, Iran, Saudi Arabia, Syria, Israel, and Egypt, combined with available archaeological evidence, suggest that selection of domestic sheep with the desired secondary characteristics common to the modern breeds occurred first in Southwest Asia and then spread successfully into Europe and Africa, and the rest of Asia. [...] The primitive breeds survived the second migrations of improved breeds from Southwest Asia by returning to a feral or semiferal state in islands without predators or by occupying inaccessible areas less prone to commercial exchanges and associated introgression.

...

Our study also provides genetic evidence supporting the anecdotal origin of some less common sheep breeds. For example, one of the 10 populations analyzed from the British Isles, the Jacob sheep, displayed a homogeneous R2 retrotype very different from that of the other British populations and more similar to that of the southwestern Asiatic and African breeds [...] Our study also firmly links the Soay sheep with the Mediterranean and Asiatic Mouflon.


Science doi:10.1126/science.1170587

Revealing the History of Sheep Domestication Using Retrovirus Integrations

Bernardo Chessa et al.

Abstract

The domestication of livestock represented a crucial step in human history. By using endogenous retroviruses as genetic markers, we found that sheep differentiated on the basis of their "retrotype" and morphological traits dispersed across Eurasia and Africa via separate migratory episodes. Relicts of the first migrations include the Mouflon, as well as breeds previously recognized as "primitive" on the basis of their morphology, such as the Orkney, Soay, and the Nordic short-tailed sheep now confined to the periphery of northwest Europe. A later migratory episode, involving sheep with improved production traits, shaped the great majority of present-day breeds. The ability to differentiate genetically primitive sheep from more modern breeds provides valuable insights into the history of sheep domestication.

Link

Genome of cattle breeds

The part I put in bold is interesting, as humans are themselves a "self-domesticated" species.

From the paper:
Our high resolution examination of cattle shows that unlike the dog—which has restricted diversity and high levels of inbreeding—domesticated cattle had a large ancestral population size and that more aurochs must have been domesticated than wolves; reducing the severity of the domestication bottleneck. SNP diversity within taurine breeds was similar to that of humans, but was significantly less than diversity within indicine breeds, which suggested that the Indian subcontinent was a major site of cattle domestication and predomestication diversity. Selection first for domestication and then for agricultural specialization have apparently reduced breed effective population sizes to relatively small numbers.
Related:

Science doi:10.1126/science.1167936

Genome-Wide Survey of SNP Variation Uncovers the Genetic Structure of Cattle Breeds

The Bovine HapMap Consortium

Abstract

The imprints of domestication and breed development on the genomes of livestock likely differ from those of companion animals. A deep draft sequence assembly of shotgun reads from a single Hereford female and comparative sequences sampled from six additional breeds were used to develop probes to interrogate 37,470 single-nucleotide polymorphisms (SNPs) in 497 cattle from 19 geographically and biologically diverse breeds. These data show that cattle have undergone a rapid recent decrease in effective population size from a very large ancestral population, possibly due to bottlenecks associated with domestication, selection, and breed formation. Domestication and artificial selection appear to have left detectable signatures of selection within the cattle genome, yet the current levels of diversity within breeds are at least as great as exists within humans.

Link

Body mass index and depression

BMC Public Health 2009, 9:14doi:10.1186/1471-2458-9-14

Depression and body mass index, a u-shaped association

Leonore M de Wit et al.

Abstract

Background

Results of studies concerning the association between obesity and depression are conflicting. Some find a positive association, some a negative association and some find no association at all. Most studies, however, examine a linear association between Body Mass Index (BMI) and depression. The present study investigates if a nonlinear (U-shaped) trend is preferable over a linear trend to describe the relationship between BMI and depression, which means that both underweight and obesity are associated with depression.

Methods

We investigated the existence of such a U-curve in a sample of 43,534 individuals, aged between 18–90 years, who participated in a cross-sectional study (Continuous Survey of Living Conditions) of physical and mental health in the general population of the Netherlands. We calculated linear and nonlinear (quadratic) ANOVA with polynomial contrast and curve fit regression statistics to investigate whether there was a U-shaped trend in the association between BMI and depression.

Results

We find a very significant U-shaped association between BMI categories (underweight, normal, overweight and obesity) and depression (p ≤ 0.001). There is a trend indicating a significant difference in the association between males and females (p = 0.05). We find a very significant U-shaped (quadratic) association between BMI (BMI2) and depression (p ≤ 0.001), continuous BMI is not linearly associated with depression (p = 0.514).

Conclusion

The results of this study give evidence for a significant U-shaped trend in the association between BMI and depression.

Link

April 24, 2009

Ancient DNA for horse coat color

In the early Holocene, horses were either bay or black, but then a large number of variations started to accumulate.
In contrast, a rapid and substantial increase in the number of coat colorations is found in both Siberia and East Europe beginning in the fifth millennium B.P. (Fig. 1 and figs. S1 and S2). Although the earliest chestnut allele (MC1R gene) was identified in a Romanian sample from the late seventhmillennium B.P., chestnut horses were first observed in Siberia (fifth millenium B.P.). Their prevalence increased rapidly, reaching 28% during the Bronze Age.

The earliest chestnut allele comes from a wild horse from Pietrele, a village in southern Romania (4,300BC). But, since this horse was heterozygous in the MC1R locus and homozygous in the ASIP locus for the black allele, it exhibited a black coat color.

Interestingly, in the Eneolithic, the 4 Romanian horses were all black, while 5 Ukrainian samples from Mayaki were bay, and 1 from Molyukhov Bugor was black.

The first observed chestnut horse was from Tartas-1 in West Siberia (3,000-2,500BC).

More:
Mutations responsible for coat color dilutions or spottings seem to appear later. Cream (buckskin) and (black) silver dilutions (2800 to 2600 yr B.P.) were first observed in Siberia. Sabino is the first spotting phenotype, appearing during the
fifth millennium B.P. in Siberia, and present in Armenia and Moldavia during the middle Bronze Age. The Tobiano spotting was first found in a single Eastern European sample (3500 to 3000 yr B.P.) and later also in Asia. Unlike in samples from Siberia and Eastern Europe, we observed no color change in Spanish samples until medieval times.

Sabino spotting was first observed in Tartas-1 from West Siberia (3,000-2,500BC) and then in Lchasen Armenia (1,410-1,250BC) and then Miciurin, Moldova (1,500-1,000BC).

Tobiano spotting was also first observed in Miciurin, and later in Arzan-2 from Irona Age South Siberia (619-608BC).

Related:
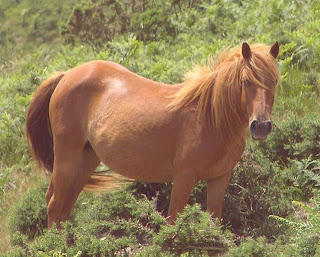
[Image of a copper-red chestnut horse.]

Science doi: 10.1126/science.1172750

Coat Color Variation at the Beginning of Horse Domestication

Arne Ludwig et al.

Abstract

The transformation of wild animals into domestic ones available for human nutrition was a key prerequisite for modern human societies. However, no other domestic species has had such a substantial impact on the warfare, transportation, and communication capabilities of human societies as the horse. Here, we show that the analysis of ancient DNA targeting nuclear genes responsible for coat coloration allows us to shed light on the timing and place of horse domestication. We conclude that it is unlikely that horse domestication substantially predates the occurrence of coat color variation, which was found to begin around the third millennium before the common era.

Link

mtDNA haplogroup T and coronary artery disease/diabetic retinopathy

BMC Med Genet. 2009 Apr 21;10(1):35. [Epub ahead of print]

Mitochondrial DNA haplogroup T is associated with coronary artery disease and diabetic retinopathy: a case control study.

Kofler B, et al.

ABSTRACT: BACKGROUND: There is strong and consistent evidence that oxidative stress is crucially involved in the development of atherosclerotic vascular disease. Overproduction of reactive oxygen species (ROS) in mitochondria is an unifying mechanism that underlies micro- and macrovascular atherosclerotic disease. Given the central role of mitochondria in energy and ROS production, mitochondrial DNA (mtDNA) is an obvious candidate for genetic susceptibility studies on atherosclerotic processes. We therefore examined the association between mtDNA haplogroups and coronary artery disease (CAD) as well as diabetic retinopathy. METHODS: This study of Middle European Caucasians included patients with angiographically documented CAD (n=487), subjects with type 2 diabetes mellitus with (n=149) or without (n=78) diabetic retinopathy and control subjects without clinical manifestations of atherosclerotic disease (n=1527). MtDNA haplotyping was performed using multiplex PCR and subsequent multiplex primer extension analysis for determination of the major European haplogroups. Haplogroup frequencies of patients were compared to those of control subjects without clinical manifestations of atherosclerotic disease. RESULTS: Haplogroup T was significantly more prevalent among patients with CAD than among control subjects (14.8% vs 8.3%; p=0.002). In patients with type 2 diabetes, the presence of diabetic retinopathy was also significantly associated with a higher prevalence of haplogroup T (12.1% vs 5.1%; p=0.046). CONCLUSION: Our data indicate that the mtDNA haplogroup T is associated with CAD and diabetic retinopathy in Middle European Caucasian populations.

Link

April 23, 2009

On the edge of Bantu expansions in southwestern Angola

From the paper:
Divergence time estimates were remarkably consistent with the archeological data (t=4000 years; Table 4)
Not surprisingly, the authors used a germline mutation rate rather than the problematic "evolutionary" rate which has misled so many researchers.

BMC Evol Biol doi:10.1186/1471-2148-9-80

On the edge of Bantu expansions: mtDNA, Y chromosome and lactase persistence genetic variation in southwestern Angola.

Margarida Coelho et al.

Abstract

Background

Current information about the expansion of Bantu-speaking peoples is hampered by the scarcity of genetic data from well identified populations from southern Africa. Here, we fill an important gap in the analysis of the western edge of the Bantu migrations by studying for the first time the patterns of Y-chromosome, mtDNA and lactase persistence genetic variation in four representative groups living around the Namib Desert in southwestern Angola (Ovimbundu, Ganguela, Nyaneka-Nkumbi and Kuvale). We assessed the differentiation between these populations and their levels of admixture with Khoe-San groups, and examined their relationship with other sub-Saharan populations. We further combined our dataset with previously published data on Y-chromosome and mtDNA variation to explore a general isolation with migration model and infer the demographic parameters underlying current genetic diversity in Bantu populations.

Results

Correspondence analysis, lineage sharing patterns and admixture estimates indicate that the gene pool from southwestern Angola is predominantly derived from West-Central Africa. The pastoralist Herero-speaking Kuvale people were additionally characterized by relatively high frequencies of Y-chromosome (12%) and mtDNA (22%) Khoe-San lineages, as well as by the presence of the -14010C lactase persistence mutation (6%), which likely originated in non-Bantu pastoralists from East Africa. Inferred demographic parameters show that both male and female populations underwent significant size growth after the split between the western and eastern branches of Bantu expansions occurring 4000 years ago. However, males had lower population sizes and migration rates than females throughout the Bantu dispersals.

Conclusions

Genetic variation in southwestern Angola essentially results from the encounter of an offshoot of West-Central Africa with autochthonous Khoisan-speaking peoples from the south. Interactions between the Bantus and the Khoe-San likely involved cattle herders from the two groups sharing common aspects of their social organization. The presence of the -14010C mutation in southwestern Angola provides a link between the East and Southwest African pastoral scenes that might have been established indirectly, through migrations of Khoe herders across southern Africa. Differences in patterns of mtDNA and Y-chromosome intrapopulation diversity and interpopulation differentiation may be explained by contrasting demographic histories underlying the current female and male genetic variation.

Link

mtDNA of ethnic groups of Reunion Island

From the paper:
As a result of the different immigration waves and the cultural and socio-economic interactions, six main ethnic groups emerged in Reunion Island: the Créoles Blancs (of European major ancestry), the Kaf (of African and Malagasy major ancestry), the Malbar (of Indian major ancestry), the Créoles Métis (of mixed ancestry), the Shinwa (of South-eastern Chinese ancestry) and the Zarab (of Gujarati ancestry). These ethnic groups are defined here according to the 'nomenclature' used by Reunionese themselves (Médéa, 2002, 2004).
Table S5 has the mtDNA results.

Annals of Human Genetics doi:10.1111/j.1469-1809.2009.00519.x

Inter- and Extra-Indian Admixture and Genetic Diversity in Reunion Island Revealed by Analysis of Mitochondrial DNA

Vincent Dubut et al.

Abstract

Reunion Island is a French territory located in the western Indian Ocean. The genetic pattern of the Reunionese population has been shaped by contributions from highly contrasting regions of the world. Over the last 350 years, several migration waves and cultural and socio-economic factors have led to the emergence of six main ethnic groups in Reunion. India is one of the principal regions that contributed to the setting up of the Reunionese population. Diversity, demographic and admixture analyses were performed on mtDNA variation of the Reunionese of Indian ancestry, including the Malbar and Zarab ethnic groups, in order to question their history. Using a phylogeographical approach, we generated and analysed quantitative data on the contribution of the Indian parental populations. Furthermore, we showed that the settlement of Reunion Island by Indians did not involve a founder effect, except in the very beginning of the Reunionese settlement (at the end of the 17th century). The accuracy of our results was optimised by a re-evaluation of the classification of the Southern Asian mtDNA haplogroups. Finally, by comparing our results to a previous study dealing with the Reunionese population, we highlighted how ethno-historical data are critical for reconstructing the complex history of multiethnic populations.

Link

Geometric morphometric quantification of Sub-Saharan cranial variation

American Journal of Human Biology doi:10.1002/ajhb.20908

A geometric morphometric approach to the quantification of population variation in sub-Saharan African crania

Daniel Franklin et al.

Abstract

We report here on new data examining cranial variation in 18 modern human sub-Saharan African populations. Previously, we investigated variation within southern Africa; we now extend our analyses to include a series of Central, East, and West African crania, to further knowledge of the relationships between, and variation and regional morphological patterning in, those populations. The sample comprises 377 male individuals; the three-dimensional coordinates of 96 landmarks are analyzed using Procrustes-based methods. Interpopulation variation is examined by calculating shape distances between groups, which are compared using resampling statistics and parametric tests. Phenotypic variance, as a proxy for genetic variance, is measured and compared across populations. Principal components and cluster analyses are employed to explore relationships between the populations. Shape differences are visualized using three-dimensional rendered models. Observed disparity patterns imply a mix of differences and similarities across populations, with no apparent support for genetic bottlenecks, which is likely a consequence of migrations that may have influenced differences in cranial form; supporting data are found in recent molecular studies. The Pygmy sample had the most distinctive cranial morphology; characteristically small in size with marked prognathism. These features characterized, although less strongly, the neighboring Bateke, and are possibly related to similar selective pressures in conjunction with interbreeding. Small cranial size is also involved in the considerable distinctiveness of the San and Khoikhoi. The statistical procedures applied in this study afford a powerful and robust means of quantifying and visualizing the magnitude and pattern of cranial variation between sub-Saharan African populations.

Link

April 22, 2009

Tayinat Dark Age temple

The website of the Tayinat Archaeological Project, and project background (pdf).

UPDATE (Apr 30): National Geographic reports on "Dark Age" Temple found in Turkey.

University of Toronto archeologists discover temple that sheds light on so-called Dark Age
:
The discovery of a remarkably well-preserved monumental temple in Turkey — thought to be constructed during the time of King Solomon in the 10th/9th-centuries BC — sheds light on the so-called Dark Age.

Uncovered by the University of Toronto's Tayinat Archaeological Project (TAP) in the summer of 2008, the discovery casts doubt upon the traditional view that the transition from the Late Bronze Age to the Early Iron Age was violent, sudden and culturally disruptive.

Ancient sources — such as the Homeric epics and the Hebrew Bible — depict an era of widespread famine, ethnic conflict and population movement, most famously including the migrations of the Sea Peoples (or biblical Philistines) and the Israelites. This is thought to have precipitated a prolonged Dark Age marked by cultural decline and ethnic strife during the early centuries of the Iron Age. But recent discoveries — including the Tayinat excavations — have revealed that some ruling dynasties survived the collapse of the great Bronze Age powers.

"Our ongoing excavations have not only begun to uncover extensive remains from this Dark Age, but the emerging archaeological picture suggests that during this period Tayinat was the capital of a powerful kingdom, the 'Land of Palastin'," says Timothy Harrison, professor of Near Eastern Archaeology at the University of Toronto and the director of the project. "Intriguingly, the early Iron Age settlement at Tayinat shows evidence of strong cultural connections, if not the direct presence of foreign settlers, from the Aegean world, the traditional homeland of the Sea Peoples."

April 21, 2009

Climate and human tuberculosis

Interdiscip Perspect Infect Dis. doi: 10.1155/2009/437187

Paleopathology of Human Tuberculosis and the Potential Role of Climate

Andreas G. Nerlich and Sandra Lösch

Abstract

Both origin and evolution of tuberculosis and its pathogens (Mycobacterium tuberculosis complex) are not fully understood. The paleopathological investigation of human remains offers a unique insight into the molecular evolution and spread including correlative data of the environment. The molecular analysis of material from Egypt (3000–500 BC), Sudan (200–600 AD), Hungary (600–1700 AD), Latvia (1200–1600 AD), and South Germany (1400–1800 AD) urprisingly revealed constantly high frequencies of tuberculosis in all different time periods excluding significant environmental influence on tuberculosis spread. The typing of various mycobacteria strains provides evidence for ancestral M. tuberculosis strains in Pre- to early Egyptian dynastic material (3500–2650 BC), while typical M. africanum signatures were detected in a Middle Kingdom tomb (2050–1650 BC). Samples from the New Kingdom to Late Period (1500–500 BC) indicated modern M. tuberculosis strains. No evidence was seen for M. bovis in Egyptian material while M. bovis signatures were first identified in Siberian biomaterial dating 2000 years before present. These results contraindicates the theory that M. tuberculosis evolved from M. bovis during early domestication in the region of the “Fertile Crescent,” but supports the scenario that M. tuberculosis probably derived from an ancestral progenitor strain. The environmental influence of this evolutionary scenario deserves continuing intense evaluation.

Link

Political complexity and the spread of ethnolinguistic groups

Gene Expression points me to a new paper on the spread of languages. From the paper:
In particular we have shown that the largest single factor predicting the area over which a language is spoken is the degree of political complexity exhibited by the society speaking that language. This is consistent with the hypothesis that more complex societies replace or incorporate less complex groups and thus spread their languages over larger areas. As political complexity is a property of groups, and
competition often occurs between groups, rather than just between individuals, if more politically complex groups tend to replace or incorporate others, then the proportion of more politically complex societies will tend to increase over time. Such a mechanism represents a process of cultural group selection (21, 48). An interesting area for future research will be to assess the impact this process has on the biological fitness of individuals within groups (49). Increasing political complexity is almost
always associated with greater degrees of social stratification, and wealth in the form of tax or tribute is often extracted by political elites from those lower down the social order (24), which could clearly have significant reproductive consequences for individuals at different levels in such societies. It will be important to assess empirically whether these costs are outweighed by benefits gained from being a member of such a group and from the advantage held in competition between groups.
PNAS doi:10.1073/pnas.0804698106

Political complexity predicts the spread of ethnolinguistic groups

Thomas E. Currie and Ruth Mace

Abstract

Human languages show a remarkable degree of variation in the area they cover. However, the factors governing the distribution of human cultural groups such as languages are not well understood. While previous studies have examined the role of a number of environmental variables the importance of cultural factors has not been systematically addressed. Here we use a geographical information system (GIS) to integrate information about languages with environmental, ecological, and ethnographic data to test a number of hypotheses that have been proposed to explain the global distribution of languages. We show that the degree of political complexity and type of subsistence strategy exhibited by societies are important predictors of the area covered by a language. Political complexity is also strongly associated with the latitudinal gradient in language area, whereas subsistence strategy is not. We argue that a process of cultural group selection favoring more complex societies may have been important in shaping the present-day global distribution of language diversity.

Link

In search of Bronze Age metal prospectors

UPDATE:

A post in the GENEALOGY-DNA-L gives some additional information from the scientists working on this:
We are following up on the Weale study (Mol. Biol. Evol. 19(7):1008-1021. 2002) which reported a much higher than average number of E3b individuals in
Abergele. We are interested in the possibility that these may be linked to
the Bronze age copper mines nearby, but obviously this is just one
possibility. The first step is to see if we can replicate the findings of
the 2002 study in a much larger sample.
The 2002 study had found a high frequency of HG21 in Abergele. It will be interesting to see which subclade of E3b (or E1b1b in the updated terminology) the NW Wales men belong to. If they do belong to E-V13, then this would be consistent with a Bronze Age origin, although this would be difficult to distinguish from other scenaria, e.g., the arrival of this haplogroup with the Romans.

Also of interest: The Litoroid Race in the Bronze Age.

DNA test to prove Bronze Age link
Men are needed for DNA tests to prove their distant ancestors moved from the Mediterranean to north west Wales as migrant workers 4,000 years ago.

...

Researchers at the University of Sheffield hope to link the migration of men in the Bronze Age to the discovery of copper.

The metal was found at both Parys Mountain on Anglesey, and on the Great Orme at Llandudno, Conwy.

The researchers are building on previous work carried out in the area which found a much higher-than-average presence of a DNA marker that is commonly found in people from the Balkans and Spain.

April 16, 2009

Paternal traces of Bantu expansion + African R1b1 mystery

It's good to see a paper which doesn't use an effective mutation rate to estimate ages, so the reported ages in this paper are more believable than the norm.

Expansion times and their standard deviations were calculated using eleven STRs (DYS19, DYS389I, DYS389II DYS390, DYS391, DYS392, DYS393, DYS437, DYS438, DYS439, DYS460), whose mutation rates have been individually estimated (Gusmao et al. 2005). The allelic variance of each STR was divided by the estimated mutation rate, and the mean of the variances was multiplied by 25 (intergeneration time in years).

The main haplogroups found were:
Specifically, most of these lineages have been associated either to Bantu-speaking people - E1b1a (E3a according to The Y Chromosome Consortium (2002)), B2a, and E2 - or to Pygmy populations (haplogroup B2b). We also observed traces of haplogroups A, E*, E1a, and E1b1b1a (E3b1 according to The Y Chromosome Consortium (2002)), which are found at low frequencies across the African continent (Underhill et al. 2000; Underhill et al. 2001; Cruciani et al. 2002; Wood et al. 2005). Interestingly, almost 5% of the individuals here analyzed belonged to Eurasian haplogroup R1b1*.

If a correct mutation rate is used and a star-like signal of expansion is visible, then, not surprisingly, archaeology does correlate with haplogroup expansion:

The expansion date of the E1b1a haplogroup was estimated at 5,800 years (SD 7,200), in agreement with the expansion of Bantu languages.

The R1b1*-in-Africa mystery thickens. At first, these typically Eurasian chromosomes had been found in Cameroon, but they seem to be found in many populations

A remarkable finding of our study is the substantial number of individuals belonging to haplogroup R1b1* (5.2%). Surprisingly, it has been previously observed in northern Cameroon (40%) at high frequencies (Cruciani et al. 2002), and at lower frequencies in southern Cameroon (1.12%) (Cruciani et al. 2002), Oman (1%), Egypt
(2%), Hutu from Rwanda (1%) (Luis et al. 2004). The presence of this lineage in Africa has been claimed to be a genetic signature of a possible backflow migration from west Asia into Africa (Cruciani et al. 2002). Here we observe R1b1* in 12 Bantu
agriculturalist populations (ranging from 2% to 20%) and in two Pygmy individuals. A
network of R1b1* haplotypes performed using STR-data (Figure 2) shows two main
clusters, without any population structure. Interestingly, the estimated expansion time for these haplotypes – 7,000 years (SD 8,100) - precedes the time at which the Bantu expansion occurred.

...

It is noteworthy that the Fang population is the Bantu agriculturalist group presenting the highest frequency of R1b1*. The presence of the Fang in west Central Africa appears to be recent and they 20 are thought to have entered the region from the north-eastern open grassland plateau during the 17th and 18th centuries (Perrois 2006).

It would certainly be worthwhile for R1b1 experts to take a look at the haplotypes found in the region (Supplementary Table 1), and to see how they are related to R1b1 elsewhere.

Molecular Biology and Evolution, doi:10.1093/molbev/msp069

Genetic and demographic implications of the Bantu expansion: insights from human paternal lineages

Gemma Berniell-Lee et al.

Abstract

The expansion of Bantu languages, which started around 5,000 years before present (YBP) in west/central Africa and spread all throughout sub-Saharan Africa, may represent one of the major and most rapid demographic movements in the history of the human species. Although the genetic footprints of this expansion have been unmasked through the analyses of the maternally-inherited mitochondrial (mtDNA) lineages, information on the genetic impact of this massive movement and on the genetic composition of pre-Bantu populations is still scarce. Here we analyze an extensive collection of Y-chromosome markers - 41 SNPs and 18 STRs - in 883 individuals from 22 Bantu-speaking agriculturalist populations and 3 Pygmy hunter-gatherer populations from Gabon and Cameroon. Our data reveal a recent origin for most paternal lineages in west Central African populations most likely resulting from the expansion of Bantu-speaking farmers that erased the more ancient Y-chromosome diversity found in this area. However, some traces of ancient paternal lineages are observed in these populations, mainly among hunter-gatherers. These results are at odds with those obtained from mtDNA analyses, where high frequencies of ancient maternal lineages are observed, and substantial maternal gene flow from hunter-gatherers to Bantu farmers has been suggested. These differences are most likely explained by socio-cultural factors such as patrilocality. We also find the intriguing presence of paternal lineages belonging to Eurasian haplogroup R1b1*, which might represent footprints of demographic expansions in central Africa not directly related to the Bantu expansion.

Link

April 15, 2009

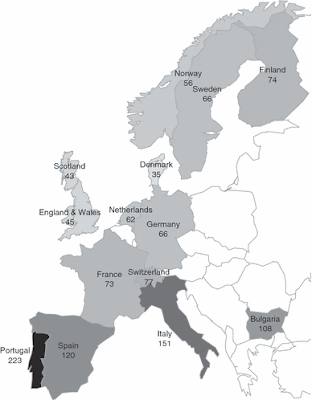
Three Geographical groups among Neanderthals

I have to wonder: how come we already have 15 Neandertal mtDNA sequence and less than a handful of Pleistocene Homo sapiens? My guess is that the latter may often turn out to be more similar to extant human mtDNA, making them more "suspect" for contamination.

Figure 2 shows the three Neandertal groups.

PLoS ONE doi:10.1371/journal.pone.0005151

Genetic Evidence of Geographical Groups among Neanderthals

Virginie Fabre et al.

Abstract

The Neanderthals are a well-distinguished Middle Pleistocene population which inhabited a vast geographical area extending from Europe to western Asia and the Middle East. Since the 1950s paleoanthropological studies have suggested variability in this group. Different sub-groups have been identified in western Europe, in southern Europe and in the Middle East. On the other hand, since 1997, research has been published in paleogenetics, carried out on 15 mtDNA sequences from 12 Neanderthals. In this paper we used a new methodology derived from different bioinformatic models based on data from genetics, demography and paleoanthropology. The adequacy of each model was measured by comparisons between simulated results (obtained by BayesianSSC software) and those estimated from nucleotide sequences (obtained by DNAsp4 software). The conclusions of this study are consistent with existing paleoanthropological research and show that Neanderthals can be divided into at least three groups: one in western Europe, a second in the Southern area and a third in western Asia. Moreover, it seems from our results that the size of the Neanderthal population was not constant and that some migration occurred among the demes.

Link

Major new paper on Y-chromosome haplogroup J1-M267 by Tofanelli et al.

The supplementary material are free online. Figure S1 is particularly interesting since it shows an inverse correlation between gene diversity and J1-M267 frequency in the studied populations.

The paper starts off well:
However, a wide range of times since the most recent common ancestor (TMRCAs) has been proposed for J1 and its subclades (between 36 and 10 KyBP), and different conflicting scenarios have been depicted to explain their current distribution.
Unfortunately I wasn't able to locate in the paper/supp info any mention of the mutation rate assumed in this paper which leads the authors to come out in support of a pre-historical "hunter-gatherer" mode of dispersal for J1. Naturally I'm very skeptical of archaeological conclusions based on TMRCA, both because most of the literature leads to age overestimates, and because population movements may be both older and younger than TMRCAs, and TMRCAs of modern Y-chromosomes tell us virtually nothing about them.

UPDATE (Apr 21): A reader alerts me of the fact that the mutation rate is shown in Supplementary Table 4, where a uniform distribution between the germline (0.0028) and "evolutionary" rate (0.00069) is assumed. As I don't think there is any merit to the evolutionary rate for large haplogroups, the ages presented in the paper should be divided by ~1.5, although as always, these carry fairly wide uncertainty margins.

European Journal of Human Genetics doi:10.1038/ejhg.2009.58

J1-M267 Y lineage marks climate-driven pre-historical human displacements

Sergio Tofanelli et al.

Abstract

The present day distribution of Y chromosomes bearing the haplogroup J1 M267*G variant has been associated with different episodes of human demographic history, the main one being the diffusion of Islam since the Early Middle Ages. To better understand the modes and timing of J1 dispersals, we reconstructed the genealogical relationships among 282 M267*G chromosomes from 29 populations typed at 20 YSTRs and 6 SNPs. Phylogenetic analyses depicted a new genetic background consistent with climate-driven demographic dynamics occurring during two key phases of human pre-history: (1) the spatial expansion of hunter gatherers in response to the end of the late Pleistocene cooling phases and (2) the displacement of groups of foragers/herders following the mid-Holocene rainfall retreats across the Sahara and Arabia. Furthermore, J1 STR motifs previously used to trace Arab or Jewish ancestries were shown unsuitable as diagnostic markers for ethnicity.


Link

Genes of Finns revisited

This paper interprets the discrepancy between Y-chromosome and mtDNA results in Finland as the signature of Scandinavian gene flow into the western parts of the country, with the Y-chromosome gene pool of the east (typified by haplogroup N3) preserving the original inhabitants starting from the Holocene deglaciation.

It it is not at all clear, however "who got there first", and as far as I can see, the evidence just tells us there is a substantial east-west difference in Y-chromosomes in Finland, it doesn't really tell us which of the two elements represents the most ancient stratum.

In my opinion, the Finnish gene pool may contain traces of the aboriginal inhabitants, as well as the later eastern elements which brought the Finnish language, and the later still influences by Germanic Scandinavians. Hopefully the northern cold has been generous with DNA preservation and we may get some direct glimpses into the country's genetic history.

Some related posts:

European Journal of Human Genetics doi:

Genetic markers and population history: Finland revisited

Jukka U Palo et al.

Abstract

The Finnish population in Northern Europe has been a target of extensive genetic studies during the last decades. The population is considered as a homogeneous isolate, well suited for gene mapping studies because of its reduced diversity and homogeneity. However, several studies have shown substantial differences between the eastern and western parts of the country, especially in the male-mediated Y chromosome. This divergence is evident in non-neutral genetic variation also and it is usually explained to stem from founder effects occurring in the settlement of eastern Finland as late as in the 16th century. Here, we have reassessed this population historical scenario using Y-chromosomal, mitochondrial and autosomal markers and geographical sampling covering entire Finland. The obtained results suggest substantial Scandinavian gene flow into south-western, but not into the eastern, Finland. Male-biased Scandinavian gene flow into the south-western parts of the country would plausibly explain the large inter-regional differences observed in the Y-chromosome, and the relative homogeneity in the mitochondrial and autosomal data. On the basis of these results, we suggest that the expression of 'Finnish Disease Heritage' illnesses, more common in the eastern/north-eastern Finland, stems from long-term drift, rather than from relatively recent founder effects.

Link

Inbreeding and the Spanish Hapsburgs

Since, presumably, the remains of these royals have been preserved, it would be interesting at some future date to carry out an ancient DNA study which would show exactly which deleterious alleles contributed to the morbidity of the Spanish Hapsburgs.

PLoS ONE doi:10.1371/journal.pone.0005174

The Role of Inbreeding in the Extinction of a European Royal Dynasty

Gonzalo Alvarez et al.

Abstract

The kings of the Spanish Habsburg dynasty (1516–1700) frequently married close relatives in such a way that uncle-niece, first cousins and other consanguineous unions were prevalent in that dynasty. In the historical literature, it has been suggested that inbreeding was a major cause responsible for the extinction of the dynasty when the king Charles II, physically and mentally disabled, died in 1700 and no children were born from his two marriages, but this hypothesis has not been examined from a genetic perspective. In this article, this hypothesis is checked by computing the inbreeding coefficient (F) of the Spanish Habsburg kings from an extended pedigree up to 16 generations in depth and involving more than 3,000 individuals. The inbreeding coefficient of the Spanish Habsburg kings increased strongly along generations from 0.025 for king Philip I, the founder of the dynasty, to 0.254 for Charles II and several members of the dynasty had inbreeding coefficients higher than 0.20. In addition to inbreeding due to unions between close relatives, ancestral inbreeding from multiple remote ancestors makes a substantial contribution to the inbreeding coefficient of most kings. A statistically significant inbreeding depression for survival to 10 years is detected in the progenies of the Spanish Habsburg kings. The results indicate that inbreeding at the level of first cousin (F = 0.0625) exerted an adverse effect on survival of 17.8%±12.3. It is speculated that the simultaneous occurrence in Charles II (F = 0.254) of two different genetic disorders: combined pituitary hormone deficiency and distal renal tubular acidosis, determined by recessive alleles at two unlinked loci, could explain most of the complex clinical profile of this king, including his impotence/infertility which in last instance led to the extinction of the dynasty.

Link

April 14, 2009

Facebook-using college students get lower grades

The question is: is Facebook responsible for distracting students from studying, or do students who would rather not study anyway spend more time on Facebbok? I am inclined to favor the latter explanation.

Facebook Use Linked To Lower Grades In College
College students who use Facebook spend less time studying and have lower grade point averages than students who have not signed up for the social networking website, according to a pilot study at one university.

However, more than three-quarters of Facebook users claimed that their use of the social networking site didn’t interfere with their studies.

“We can’t say that use of Facebook leads to lower grades and less studying – but we did find a relationship there,” said Aryn Karpinski, co-author of the study and a doctoral student in education at Ohio State University.

“There’s a disconnect between students’ claim that Facebook use doesn’t impact their studies, and our finding showing they had lower grades and spent less time studying.”

...

The researchers surveyed 219 students at Ohio State, including 102 undergraduate students and 117 graduate students. Of the participants, 148 said they had a Facebook account.

...

“It may be that if it wasn’t for Facebook, some students would still find other ways to avoid studying, and would still get lower grades. But perhaps the lower GPAs could actually be because students are spending too much time socializing online.”

April 13, 2009

Origin of African Pygmies


From the paper:
Finally, our estimates of gene flow between each group of Pygmies and agricultural populations yielded contrasting values, with levels of gene flow between WPYG and AGR populations three to seven times higher than those between EPYG and AGR populations (Table 2). This result, together with those obtained with protein markers [27], mtDNA [8],[36] and autosomal microsatellites [41],[46], indicates that (i) substantial gene flow has occurred between Western Pygmies and agricultural populations, possibly during a period before the strong social barriers currently separating these two groups became established [29],[32],[33],[41],[56], and (ii) the Eastern Mbuti Pygmies (i.e., the EPYG group in the filtered population dataset) have probably been among the most isolated Pygmy populations of sub-Saharan Africa.
Related:

Here are some pictures of Mbuti Pygmies from a National Geographic article.

PLoS Genetics doi:Inferring the Demographic History of African Farmers and Pygmy Hunter–Gatherers Using a Multilocus Resequencing Data Set

Inferring the Demographic History of African Farmers and Pygmy Hunter–Gatherers Using a Multilocus Resequencing Data Set

Etienne Patin et al.

Abstract

The transition from hunting and gathering to farming involved a major cultural innovation that has spread rapidly over most of the globe in the last ten millennia. In sub-Saharan Africa, hunter–gatherers have begun to shift toward an agriculture-based lifestyle over the last 5,000 years. Only a few populations still base their mode of subsistence on hunting and gathering. The Pygmies are considered to be the largest group of mobile hunter–gatherers of Africa. They dwell in equatorial rainforests and are characterized by their short mean stature. However, little is known about the chronology of the demographic events—size changes, population splits, and gene flow—ultimately giving rise to contemporary Pygmy (Western and Eastern) groups and neighboring agricultural populations. We studied the branching history of Pygmy hunter–gatherers and agricultural populations from Africa and estimated separation times and gene flow between these populations. We resequenced 24 independent noncoding regions across the genome, corresponding to a total of ~33 kb per individual, in 236 samples from seven Pygmy and five agricultural populations dispersed over the African continent. We used simulation-based inference to identify the historical model best fitting our data. The model identified included the early divergence of the ancestors of Pygmy hunter–gatherers and farming populations ~60,000 years ago, followed by a split of the Pygmies' ancestors into the Western and Eastern Pygmy groups ~20,000 years ago. Our findings increase knowledge of the history of the peopling of the African continent in a region lacking archaeological data. An appreciation of the demographic and adaptive history of African populations with different modes of subsistence should improve our understanding of the influence of human lifestyles on genome diversity.

Link

April 10, 2009

Synonymous mutations not evolutionarily neutral

Synonymous mutations are changes in the DNA sequence that do not affect the type of amino acids produced. For this reason they have been thought of as neutral in terms of evolution and thus unaffected by selection (although see here for criticisms of tests using the synonymous/non-synonymous ratio to detect selection).

The new paper in Science shows how synonymous mutations affect gene expression, and thus phenotypes. From ScienceDaily:

Synonymous mutations do not change the amino-acid sequence of a protein, but they can nevertheless influence the amount of the protein that is produced. The researchers identified the mechanism underlying this regulation: synonymous mutations determine mRNA folding and thereby the eventual protein level. The researchers also identified a class of mutations that did not directly affect protein levels but slowed bacterial growth.

For biologists, these results fundamentally change the understanding of the role of synonymous mutations, which were previously considered evolutionarily neutral.


Science doi:10.1126/science.1170160

Coding-Sequence Determinants of Gene Expression in Escherichia coli

Grzegorz Kudla et al.

Abstract

Synonymous mutations do not alter encoded protein, but they can influence gene expression. To investigate how, we engineered a synthetic library of 154 genes that varied randomly at synonymous sites, but all encoded the same green fluorescent protein (GFP). When expressed in Escherichia coli, GFP protein levels varied 250-fold across the library. GFP messenger RNA (mRNA) levels, mRNA degradation patterns, and bacterial growth rates also varied, but codon bias did not correlate with gene expression. Rather, the stability of mRNA folding near the ribosomal binding site explained more than half the variation in protein levels. In our analysis, mRNA folding and associated rates of translation initiation play a predominant role in shaping expression levels of individual genes, whereas codon bias influences global translation efficiency and cellular fitness.

Link

Strong apes and fast humans

The paper is freely accessible.

Current Anthropology doi:10.1086/592023

The Strength of Great Apes and the Speed of Humans

Alan Walker

Abstract

Cliff Jolly developed a causal model of human origins in his paper “The Seed‐Eaters,” published in 1970. He was one of the first to attempt this, and the paper has since become a classic. I do not have such grand goals; instead, I seek to understand a major difference between the living great apes and humans. More than 50 years ago, Maynard Smith and Savage (1956) showed that the musculoskeletal systems of mammals can be adapted for strength at one extreme and speed at the other but not both. Great apes are adapted for strength—chimpanzees have been shown to be about four times as strong as fit young humans when normalized for body size. The corresponding speed that human limb systems gain at the expense of power is critical for effective human activities such as running, throwing, and manipulation, including tool making. The fossil record can shed light on when the change from power to speed occurred. I outline a hypothesis that suggests that the difference in muscular performance between the two species is caused by chimpanzees having many fewer small motor units than humans, which leads them, in turn, to contract more muscle fibers earlier in any particular task. I outline a histological test of this hypothesis.

Link

April 09, 2009

Parental investment on adopted children

I can think of at least three reasons for the more negative outcomes of adopted children: (i) negative early pre-adoption experiences, (ii) relatively negative genetic background of children put up for adoption compared to the general population, or (iii) genetic discordance between parents and adopted children that make their relationship more difficult.

Evolution and Human Behavior doi:10.1016/j.evolhumbehav.2009.01.001

Differential parental investment in families with both adopted and genetic children

Kyle Gibson

Abstract

Stepchildren are abused, neglected and murdered at higher rates than those who live with two genetically related parents. Daly and Wilson used kin selection theory to explain this finding and labeled the phenomenon “discriminative parental solicitude.” I examined discriminative parental solicitude in American households composed of both genetic and unrelated adopted children. In these families, kin selection predicts parents should favor their genetic children over adoptees. Rather than looking at cases of abuse, neglect, homicide and other antisocial behavior, I focused on the positive investments parents made in their children as well as the outcomes of each child. The results show that parents invested more in adopted children than in genetically related ones, especially in educational and personal areas. At the same time, adoptees experienced more negative outcomes. They were more likely to have been arrested, to have been on public assistance and to require treatment for drug, alcohol or mental health issues. They also completed fewer years of schooling and were more likely to divorce. In adoptive families, it appears that “the squeaky wheel gets the grease.” Parents invest more in adoptees not because they favor them, but because they are more likely than genetic children to need the help. I conclude that discriminative parental solicitude differs in adoptive and step households because adoptive families generally result from prolonged parenting effort, not mating effort like stepfamilies.

Link

April 07, 2009

Reading, Intelligence and Memory in Children

Behav Genet. 2009 Apr 4.

Genetic Covariance Structure of Reading, Intelligence and Memory in Children

van Leeuwen M, van den Berg SM, Peper JS, Hulshoff Pol HE, Boomsma DI.

This study investigates the genetic relationship among reading performance, IQ, verbal and visuospatial working memory (WM) and short-term memory (STM) in a sample of 112, 9-year-old twin pairs and their older siblings. The relationship between reading performance and the other traits was explained by a common genetic factor for reading performance, IQ, WM and STM and a genetic factor that only influenced reading performance and verbal memory. Genetic variation explained 83% of the variation in reading performance; most of this genetic variance was explained by variation in IQ and memory performance. We hypothesize, based on these results, that children with reading problems possibly can be divided into three groups: (1) children low in IQ and with reading problems; (2) children with average IQ but a STM deficit and with reading problems; (3) children with low IQ and STM deficits; this group may experience more reading problems than the other two.

Link