August 31, 2006

Cannibals in the news

The Smithsonian has a story titled Sleeping with Cannibals:
For days I've been slogging through a rain-soaked jungle in Indonesian New Guinea, on a quest to visit members of the Korowai tribe, among the last people on earth to practice cannibalism. Soon after first light this morning I boarded a pirogue, a canoe hacked out of a tree trunk, for the last stage of the journey, along the twisting Ndeiram Kabur River. Now the four paddlers bend their backs with vigor, knowing we will soon make camp for the night.

...

In cannibal folklore, told in numerous books and articles, human flesh is said to be known as "long pig" because of its similar taste. When I mention this, Bailom shakes his head. "Human flesh tastes like young cassowary," he says, referring to a local ostrich-like bird. At a khakhua meal, he says, both men and women—children do not attend—eat everything but bones, teeth, hair, fingernails and toenails and the penis. "I like the taste of all the body parts," Bailom says, "but the brains are my favorite." Kilikili nods in agreement, his first response since he arrived.


In a different story, archaeologists have uncovered evidence that the Aztecs captured, sacrificed, and ate Spanish colonists:
Skeletons found at an unearthed site in Mexico show Aztecs captured, ritually sacrificed and partially ate several hundred people traveling with invading Spanish forces in 1520.

Skulls and bones from the Tecuaque archaeological site near Mexico City show about 550 victims had their hearts ripped out by Aztec priests in ritual offerings, and were dismembered or had their bones boiled or scraped clean, experts say.

The findings support accounts of Aztecs capturing and killing a caravan of Spanish conquistadors and local men, women and children traveling with them in revenge for the murder of Cacamatzin, king of the Aztec empire's No. 2 city of Texcoco.

Experts say the discovery proves some Aztecs did resist the conquistadors, led by explorer Hernan Cortes, before the Spaniards attacked the Aztec capital, Tenochtitlan, now Mexico City.

An older post on Cannibalism in China.

August 30, 2006

"Celts" in Xinjiang

PhDiva criticizes a despicable Independent article titled "A meeting of civilisations: The mystery of China's celtic mummies". As I noted in a discussion list:
There is no evidence that the Urumqi mummies spoke Celtic languages, or that they were Europeans, or even Indo-Europeans. The DNA evidence can only be used to show that they were of West Eurasian, not European origin. As for their language, none of them have been accompanied, as far as I know, by any writings. It is reasonable that they might have spoken an Indo-European language, although by no means proven.

It is a sad state of affairs that editors allow such misleading information to be published.
One of the many idiotic statements in the article:
The Loulan Beauty, for example, was claimed by the Uighurs as their symbol in song and image, although genetic testing now shows that she was in fact European.
The "Loulan Beauty" may be one of the ancestors of the Uighurs, and she certainly belongs to the archaeological heritage of the region. Thus, it is reasonable and understandable that she will be made a symbol by the current inhabitants, however tenuous the connection.

Even the Slavs of Bulgaria identify with the ancient Thracians, the Turks identify with the Hittites and other extinct Anatolians, the Arabs of Egypt identify with the Egyptians, and the modern Germanic-speaking Britons identify with the "Celts". Such sentiments are understandable, albeit naive.

What is not excusable is to excise a part of Central Asian history and claim that it belongs to Europeans, or even more absurdly to Celts. However, we should perhaps excuse the journalist for his misstep, since he lives in a country where even professional geneticists have consistently oversold their research to a credulous public ready to swallow up stories about "Viking", "Celtic", or "Pictish" origins.

August 29, 2006

Dumb theory of the day: Odyssey and Iliad were written by a woman

... according to a British "scholar". Never mind that there is no single mention of a female author of these poems, or any epic poetry at all. Never mind that the authorship of the Iliad and the Odyssey was universally attributed to Homer in historical times by all Greeks who ever bothered to mention what was common knowledge. Never mind that the poems universally assign the role of story teller to men, and confine women to domestic pursuits. What is the "scholar"'s evidence?
Dalby explained that women throughout the ancient world were "often the last and most skillful exponents of an oral tradition."

For example, the world’s first named poet was a Sumerian woman named Enheduanna, who lived from around 2285-2250 B.C. Dalby said women also saved the ancient oral poetry of the northern Japanese, many Irish traditions, and numerous English folk ballads.

Another recent book, Clever Maids: The Secret History of the Grimm Fairy Tales, claims the Brothers Grimm gathered most of their famous stories from women. Author Valerie Paradiz told Discovery News that the brothers "only gave credit to one woman by name," but then linked most other tales to male editors who also gathered stories from women.
Yep, the Sumerians, Japanese, Irish, English and the Brothers Grimm did it, ergo the Iliad was written by a woman. QED. Mr. Darby gives us his own scholarly "guesses" too:
If the poet was a woman, Dalby believes her name is probably lost to history.

"I would guess that Sappho (a female Greek poet) and her contemporary, the male poet Alkaios, probably knew the name, but they did not mention it in their own poetry," Dalby said.
Well, too bad they never said anything about it. How convenient for Mr. Dalby's speculations! If anyone is still wondering Who Killed Homer? now we have an answer: Mr. Dalby, and "scholars" like him.

PS: I don't mind people writing what they want. We should not however award any respect to crackpots. Mr. Dalby's theory belongs in the same category as the "Merovingians were descended from Jesus Christ" or "Homer in the Baltic".

August 28, 2006

Planets and races

The recent controversy about what constitutes a planet gives me the opportunity to revisit the issue of what constitutes a race.

The IAU definition of a planet is:
The IAU members gathered at the 2006 General Assembly agreed that a "planet" is defined as a celestial body that (a) is in orbit around the Sun, (b) has sufficient mass for its self-gravity to overcome rigid body forces so that it assumes a hydrostatic equilibrium (nearly round) shape, and (c) has cleared the neighbourhood around its orbit.
Reading this definition, most people would agree that (a) is a necessary condition for the definition of a planet. Even this, though, was not always the case; the initial definition of a planet was a "wandering star"; it is only incidental that the planets recognized by the ancients happened to be orbiting the Sun.

Points (b) and (c) are, however, entirely subjective. There is nothing in the laws of nature which necessitates that planets be round or that they clear their orbit out of lesser bodies. Indeed, neither of these two concepts can be defined "objectively", as no planets are perfectly round, or have picked up all objects which cross their orbits.

Nonetheless, astronomers have decided to retain the ancient concept of a planet, giving it a definition that will allow them to sort heavenly bodies into those that are planets, and those that are not. Indeed, they themselves do not agree on what constitutes a planet; according to the new definition, Pluto is not a planet, which would come as a surprise to many non-specialists and is contested by a minority of astronomers.

Is there really any differences between the astronomer's problem and that of the racial taxonomist? He, too, must decide whether or not a particular human individual belongs to a category, a race, say, whether or not someone is a Caucasoid. He can easily accept a necessary condition (a) that the individual must be human.

But, any additional criteria, e.g., a prominent nose or heavy facial hair are ultimately subjective. Indeed, people disagree about the criteria used to decide whether or not one is a Caucasoid or not. Borderline peoples such as some Central Asian Turks, Indians, or some Northwest and Northeast Africans are assigned by some to the Caucasoid race, by others to different races or are considered in-between races, just as dwarf-planets like Pluto inhabit an intermediate zone between the newly-hatched categories of "planet" and "small solar-system body".

We must recognize that races are useful labels that allow us to summarize information about an individual in a single word. They are not categories of nature with a reality of their own, in the sense that e.g., electrons or stars appear to be. Nonetheless, they are useful symbols that people use to describe a person's appearance (when talking about a someone who is absent), to infer the geographical origin of their ancestors (when meeting a stranger), or to limit the number of possibilities to be considered (in a forensic investigation).

So, it is time to admit that a race is what we say it is, and that, despite its arbitrariness, most well-meaning people can agree on racial definitions that prove to be most useful in a number of different settings.

150th anniversary of Neanderthal Man

Neanderthal Still Posing Questions 150 Years After Discovery

This year marks the 150th anniversary of the discovery of the "Neanderthal Man." An international exhibition and congress in July in Bonn brought together 220 scientists from 20 countries, to discuss topics ranging from the origin of Neanderthal man, to the species' relationship to modern humans.

...

"It was the first fossil man and the first clear evidence that there is some other one like modern man," said von Königswald. "It was a time when one discovered that all aborigines of the various continents in those days were absolutely human beings and they did interbreed with Europeans. With Neanderthal man, it became clear that there were other types of man in the past."

...

"Perhaps they have had fewer children than the anatomically modern humans, perhaps the modern humans brought diseases, or perhaps they pressured them into bad grounds for hunting," Schmitz said.

Schmitz added that the question of why Neanderthals became extinct is an important one.

...

"We used to think that there was a major behavioral shift, improvement in overall efficiency of and social organization between the two groups, but the more we look at them, the more we find that in many ways, Neanderthals and early modern humans are very similar to each other behaviorally, functionally," he said.


"They're not biologically identical, they look different and we can tell them apart easily, but when you look at them in terms of their behavioral patterns, the changes are fairly subtle," Trinkaus added.

The transformations of the composite Greek face

I have used the University of St. Andrews face transformer applet to transform the composite Greek male. The results are shown below.


See also The Geography of European Phenotypical Variation and this or that for facial averages of other ethnicities which could be used for the same purpose

August 27, 2006

Population age structure and prosperity

Steve Sailer points me to an article by Malcolm Gladwell in the New Yorker. Gladwell makes the excellent point that the dependency ratio explains a country's prosperity:
This relation between the number of people who aren’t of working age and the number of people who are is captured in the dependency ratio. In Ireland during the sixties, when contraception was illegal, there were ten people who were too old or too young to work for every fourteen people in a position to earn a paycheck. That meant that the country was spending a large percentage of its resources on caring for the young and the old. Last year, Ireland’s dependency ratio hit an all-time low: for every ten dependents, it had twenty-two people of working age. That change coincides precisely with the country’s extraordinary economic surge.

...

Economists have long paid attention to population growth, making the argument that the number of people in a country is either a good thing (spurring innovation) or a bad thing (depleting scarce resources). But an analysis of dependency ratios tells us that what’s critical is not just the growth of a population but its structure. “The introduction of demographics has reduced the need for the argument that there was something exceptional about East Asia or idiosyncratic to Africa,” Bloom and Canning write, in their study of the Irish economic miracle. “Once age-structure dynamics are introduced into an economic growth model, these regions are much closer to obeying common principles of economic growth.”

I was extremely pleased to see this point being argued. I had made a similar observation back in 2003 in Fishing in the Pond of Correlation.
Let's take factor #1: Demographic Structure. I used % of population under age 15 as a proxy for this factor. The intuition goes that since children don't have the capacity (muscle or intellectual) to produce as much as adults, a nation with a large number of children will have a lower per capita income.

Indeed, there is a -0.71 correlation between % of population under 15 and per capita PPP, accounting for 50% of the variance of the dependent variable.

Roughly half the population in the world is women. Women get pregnant and while pregnant or rearing young children can't be as productive as men. So, we expect that nations where women have lots of children will have a lower per capita income, simply because half their population spends quite a lot of time being pregnant, breastfeeding or changing diapers. This is factor #2, which also relates to Demographic Structure.


Steve brings the example of Ukraine as an argument against the idea that population structure affects prosperity. I had actually observed this discrepancy in my original post:
Finally, I list the 10 countries whose per capita PPP is most overestimated by the model: Ukraine, Georgia, Bulgaria, Croatia, Cuba, Romania, Bosnia and Herzegovina, Moldova, Rep. of, Sri Lanka, Russian Federation

It is clear that adding "democracy" as a value, would help eliminate these residual errors. The 10 countries whose income is most underestimated are: Australia, Brunei Darussalam, Switzerland, Denmark, Canada, Equatorial Guinea, Norway, Iceland, Ireland, United States

It is notable that many of these countries have abundant natural resources (e.g., Iceland, Norway, Brunei), special financial status (Switzerland), or a large territory with respect to their population (Canada, Australia).

So, yes, demographic age structure is indeed a major determinant of economic prosperity as measured by per capita PPP, more so, once we control for factors such as recent history or natural resources.

Update (Aug 28): I have re-uploaded the data file in the old entry; it was missing from the old blog archive in 50webs. The link to the UNDP report from 2003 is also outdated. Here is a link to the latest 2006 report.

Here are the statistics on population under age 15. and PPP per capita from the UNDP website.

After repeating the calculations, I have found a correlation of -0.69 between population under age 15 and GDP per capita (US$ PPP). The scatterplot is even more informative.
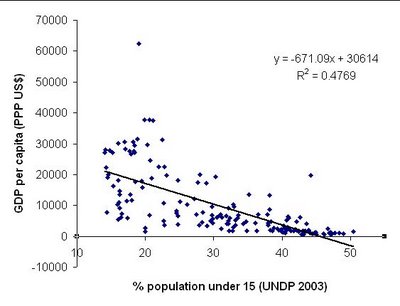


It is clear that countries with large populations of dependents (on the right of the figure) all have small per capita income. Other factors may play a bigger role in countries with moderate and small populations of dependents.

The outliners in the graph are Equatorial Guinea and Luxembourg. If they are removed, the correlation becomes even more pronounced (-0.73)
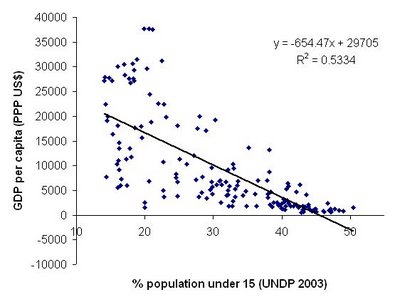


I have often tried tried to show (e.g., for disease or hair dye sales) that we do not need to postulate elaborate explanations for phenomena when simpler ones suffice.

In this case, the lower per-capita GDP is a logical consequence of a high population of children: Per-capita GDP can be expressed as (Number of productive individuals)*(Average Individual Production)/(Total Population). Countries with a great number of children are expected to have a low (Number of productive individuals)/(Total Population Ratio), or conversely a high dependency ratio, and hence we expect them to have a low per capita GDP! This is a logical consequence and requires no assumptions about, say, the relative ability of different populations.

So, why should we bother with Lynn-ian speculations about intelligence and prosperity which depend on the unsubstantiated assumption of substantial genetic differences in cognitive ability among major races when a simpler model, which makes no such assumptions is able to capture the data as well, or even better?

Update II: A reader makes the interesting point that children, rather than dependents are the critical parameter. I have calculated the correlation between GDP per capita (US$ PPP) and population over 65 (without the outliers mentioned above) and obtained a value of +0.7, consistent with the idea that people in prosperous societies live longer.

Then I added up the fraction of people age less than 15 with that more than 65, to obtain a total fraction of the population that is expected to be "dependent" on the productive population between ages 15 and 65. The new correlation is -0.66. Thus, both the fraction of the productive population (aged 15 to 65) as well as the fraction of the adult population (aged 15+) both have roughly the same explanatory power.

Update III (Aug 29): Here is a comment I left in Jane Galt's topic on the subject:
Observable GDP/capita is not caused by any single factor. However, it is partially caused by demographic structure. By "caused" I mean that if we change the variable "dependency ratio" then we expect to immediately and predictably change the variable "GDP per capita".

Incidentally, as I have mentioned in my blog, the reduction in per capita income is not caused only directly from the smaller fraction of active individuals: an even smaller fraction of individuals can really be active, since a substantial part of them, especially young mothers, spend a lot of time in activities of little economic value.

For example, imagine a toy society in which active individuals produce 100 units. If one society has 50% dependents, and another 25% dependents, then we expect the per capita income of the first one to be 50 and of the second one to be 75. But, the first society also has lots of individuals who do not produce a lot because they take care of the dependent population. If, say, 2 dependents use up the resources of an active individual, then the "real" active fraction in the first population will be 25%, and 62.5% in the second one, and the corresponding per capita income will of course be 25 and 62.5. Thus, even though individuals produce exactly the same in both societies, demographic factors cause one to exhibit 2.5 more per capita GDP than the other.

Trends in cranial capacity and shape in Sub-Saharan Africa

American Journal of Human Biology
Volume 5, Issue 4 , Pages 473 - 479

Trends in cranial capacity and cranial index in Subsaharan Africa during the Holocene

M. Henneberg, M. Stein

Abstract

Craniometric data have been collected from published and unpublished reports of numerous authors on 961 male and 439 female crania from various sites in Subsaharan Africa spanning the last 100 ka. All data available in the literature, irrespective of their racial affinities, were used to cover the prehistoric and early historic times (up to 400 a BP). Samples covering the last 400 years do not include European colonists and consist of skeletons exavated at archeological sites, collected by early European travelers and derived from anatomical collections. Cranial capacity, depending on the mode of its calculation, has decreased by 95-165 cm3 among males and by 74-106 cm3 among females between the Late Stone Age (30-2 ka BP) and modern times (last 200 years). Values of the cranial index did not show any trend over time and their averages remained in the dolichocephalic category. The decrease in cranial capacity in Subsaharan Africa is similar to that previously found in Europe, West Asia, and North Africa, but, unlike the latter, it is not accompanied by brachycephalization.

Link

See also: Cranial size and shape.

August 26, 2006

The secrets of the orgasm

The Times have a story on research about male and female orgasm. Some interesting bits:
The first brain scans of men and women having sex and reaching orgasm have revealed striking differences in the way each experiences sexual pleasure. While male brains focus heavily on the physical stimulation involved in sexual contact, this is just one part of a much more complex picture for women, scientists in the Netherlands have found.

The key to female arousal seems rather to be deep relaxation and a lack of anxiety, with direct sensory input from the genitals playing a less critical role.

...

The experiments also revealed a rather surprising effect: both men and women found it easier to have an orgasm when they kept their socks on. Draughts in the scanning room left couples complaining of "literally cold feet", and providing a pair of socks allowed 80 per cent rather than 50 per cent to reach a climax while their brains were scanned.

...

The scans also show that while women may be able to fool their partners with a fake orgasm, the difference is obvious in the brain. Parts of the brain that handle conscious movement light up during fake orgasms but not during real ones, while emotion centres close down during the real thing but never when a woman is pretending.

Taller people are smarter

From the paper:
In this paper, we offer a simpler explanation: Taller people earn more on average, because they are smarter on average. As early as age 3, before schooling has had a chance to play a role, taller children perform significantly better on tests of verbal ability. Indeed, throughout childhood, taller children outperform others on standardized tests. Tall children are significantly more likely to become tall adults, and as adults they are more likely to select into higher paying occupations that require more advanced verbal and numerical skills and greater intelligence, for which they earn handsome returns.
This table of the strength and intelligence needed for various occupations and for the two sexes is also quite useful. The data is from the US National Health Interview Survey.


Stature and status: Height, ability, and labor market outcomes

Anne Case and Christina Paxson

Center for Health and Wellbeing
Princeton University

Link (pdf)

Ancient autosomal DNA testing

The New Scientist covers this study too:
JURASSIC PARK here we come? Not quite, but we might now be able to sequence the genomes of mammoths and even Neanderthals, thanks to a new way to correct the errors in sequencing ancient DNA that are made because it degrades over time.

When Svante Pääbo's group at the Max Planck Institute for Evolutionary Anthropology in Leipzig, Germany, analysed DNA from 50 to 50,000-year-old bone samples from wolves, a single error stood out: one of DNA's "letters", cytosine, had degraded in such a way that sequencing machines misinterpreted it as the letter thymine. Comparison of ancient DNA with a closely related modern species could allow such errors to be identified and corrected (Proceedings of the National Academy of Sciences, DOI: 10.1073 pnas.0605327103).

This opens the way for sequencing species that died out during the last ice age, says Pääbo.
Proc. Natl. Acad. Sci. USA, 10.1073/pnas.0605327103

Patterns of nucleotide misincorporations during enzymatic amplification and direct large-scale sequencing of ancient DNA

Whereas evolutionary inferences derived from present-day DNA sequences are by necessity indirect, ancient DNA sequences provide a direct view of past genetic variants. However, base lesions that accumulate in DNA over time may cause nucleotide misincorporations when ancient DNA sequences are replicated. By repeated amplifications of mitochondrial DNA sequences from a large number of ancient wolf remains, we show that C/G-to-T/A transitions are the predominant type of such misincorporations. Using a massively parallel sequencing method that allows large numbers of single DNA strands to be sequenced, we show that modifications of C, as well as to a lesser extent of G, residues cause such misincorporations. Experiments where oligonucleotides containing modified bases are used as templates in amplification reactions suggest that both of these types of misincorporations can be caused by deamination of the template bases. New DNA sequencing methods in conjunction with knowledge of misincorporation processes have now, in principle, opened the way for the determination of complete genomes from organisms that became extinct during and after the last glaciation.

Link

August 24, 2006

Altruistic punishment in Papua New Guinea

See a previous entry on altruistic punishment.

Nature 442, 912-915(24 August 2006) | doi:10.1038/nature04981

Parochial altruism in humans

Helen Bernhard et al.

Social norms and the associated altruistic behaviours are decisive for the evolution of human cooperation1,2,3,4,5,6,7,8,9 and the maintenance of social order10, and they affect family life, politics11 and economic interactions12. However, as altruistic norm compliance and norm enforcement often emerge in the context of inter-group conflicts13,14, they are likely to be shaped by parochialism15—a preference for favouring the members of one's ethnic, racial or language group. We have conducted punishment experiments16, which allow 'impartial' observers to punish norm violators, with indigenous groups in Papua New Guinea. Here we show that these experiments confirm the prediction of parochialism. We found that punishers protect ingroup victims—who suffer from a norm violation—much more than they do outgroup victims, regardless of the norm violator's group affiliation. Norm violators also expect that punishers will be lenient if the latter belong to their social group. As a consequence, norm violations occur more often if the punisher and the norm violator belong to the same group. Our results are puzzling for evolutionary multi-level selection theories based on selective group extinction2,3,4,5 as well as for theories of individual selection17,18,19; they also indicate the need to explicitly examine the interactions between individuals stemming from different groups in evolutionary models.

Link

Amoebas sacrifice themselves for their kin

Nature has a new article demonstrating kin preference in the social amoeba Dictyostelium purpureum. From EurekAlert:
Recognizing one's own family is a common trait among animals – be they chimpanzees, ground squirrels or paper wasps – and because kin recognition can strongly influence cooperative behaviors it can also significantly impact the social evolution of species.

While scientists have repeatedly documented cases of kin recognition, the Rice study is among the first to document the more sophisticated trait of kin discrimination in a social microorganism.


Nature 442, 881-882(24 August 2006) | doi:10.1038/442881a

Social evolution: Kin preference in a social microbe

Natasha J. Mehdiabadi et al.

Kin recognition helps cooperation to evolve in many animals, but it is uncertain whether microorganisms can also use it to focus altruistic behaviour on relatives. Here we show that the social amoeba Dictyostelium purpureum prefers to form groups with its own kin in situations where some individuals die to assist others. By directing altruism towards kin, D. purpureum should generally avoid the costs of chimaerism experienced by the related D. discoideum

Link

August 23, 2006

Melanesian and Asian Origins of Polynesian settlement

Mol Biol Evol. 2006 Aug 21; [Epub ahead of print]

Melanesian and Asian Origins of Polynesians: mtDNA and Y-chromosome Gradients Across the Pacific.

Kayser M, Brauer S, Cordaux R, Casto A, Lao O, Zhivotovsky LA, Moyse-Faurie C, Rutledge RB, Schiefenhoevel W, Gil D, Lin AA, Underhill PA, Oefner PJ, Trent RJ, Stoneking M.

The human settlement of the Pacific Islands represents one of the most recent major migration events of mankind. Polynesians originated in Asia according to linguistic evidence or in Melanesia according to archaeological evidence. To shed light on the genetic origins of Polynesians we investigated over 400 Polynesians from eight island groups, in comparison with over 900 individuals from potential parental populations of Melanesia, Southeast and East Asia, and Australia, by means of Y-chromosome (NRY) and mitochondrial DNA (mtDNA) markers. Overall, we classified 94.1% of Polynesian Y-chromosomes and 99.8% of Polynesian mtDNAs as of either Melanesian (NRY-DNA: 65.8%, mtDNA: 6%) or Asian (NRY-DNA: 28.3%, mtDNA: 93.8%) origin, suggesting a dual genetic origin of Polynesians in agreement with the "Slow Boat" hypothesis. Our data suggest a pronounced admixture bias in Polynesians towards more Melanesian men than women, perhaps as a result of matrilocal residence in the ancestral Polynesian society. Although dating methods are consistent with somewhat similar entries of NRY/mtDNA haplogroups into Polynesia, haplotype sharing suggests an earlier appearance of Melanesian haplogroups than those from Asia. Surprisingly, we identified gradients in the frequency distribution of some NRY/mtDNA haplogroups across Polynesia and a gradual west to east decrease of overall NRY/mtDNA diversity, not only providing evidence for a west-to-east direction of Polynesian settlements but also suggesting that Pacific voyaging was regular rather than haphazard. We also demonstrate that Fiji played a pivotal role in the history of Polynesia: humans probably first migrated to Fiji, and subsequent settlement of Polynesia probably came from Fiji.

Link

Breeding Between the Lines

Steve Sailer points me to the website of Breeding Between the Lines, a new book by Alon Ziv:
Alon Ziv presents evidence from academic journals, world history, pop culture, and recent census counts to prove that interracial individuals have significant physical and mental advantages. From the sex lives of bedbugs to the remarkable feats of professional athletes, he illustrates how biology influences every aspect of our lives and how the right combination of genes can make all the difference.

I have heard similar views before, and I have three main objections to this hypothesis. If you have read the book, and these objections are covered, feel free to comment.

My first objection is that humans tend to prefer individuals with physical traits similar to themselves. Research on human marriage patterns has established this fact. Therefore, people with average features will tend to be higher rated, because they are more similar to a larger number of people than outliers of phenotypic space. Hence, we would not expect that interracial people who inhabit an underpopulated region of phenotypic space to be highly rated from a group of judges drawn from the population as a whole.

My second objection is that interracial relationships do not occur uniformly in geographical and social space. It is also known that people's attractiveness and health also varies with geography and social class. Therefore, to assess the qualities of interracial individuals we must compare them against uniracial individuals from the same parental background, and not the general population of a particular country.

Thirdly, interracial individuals represent a wider range of phenotypes. In a sense, they represent novel chance combinations of genes from genetically distant populations. Whereas trait complexes are expected to be mostly harmonic within racial groups (since the dysharmonic combinations have been partially culled by evolution), traits inherited from different races may clash, presenting a dysharmonic phenotype. They may also match in an original way, including individuals of great beauty or other qualities. However, we should not judge the entirety of the interracial distribution by its right tail, e.g., the famous athletes, or celebrities of interracial background that we may be familiar with.

Mixed Media Watch doesn't seem to like the book:
I feel like all of my recent posts have been about things I wish didn’t exist. :| I can’t believe this book is actually hitting the shelves. I remember being contacted by the author years ago in my capacity as Swirl’s Executive Director. Once I heard his premise, I refused participation.

August 22, 2006

Reconstructing human origins in the genomic era

From the paper:
If the AMH genome contains any degree of dual ancestry (that is, archaic and modern) the single origin model must be rejected. Although most of the AMH genome might descend from a single African population, if further studies confirm a non-negligible contribution of archaic genetic material to the AMH genome, it would imply that the evolutionary lineage leading to AMH did not evolve reproductive isolation from other archaic hominin subpopulations and, therefore, cannot be considered a distinct biological species. Full resolution of this question awaits systematic resequencing surveys of many independent regions of the genome that are far from functional regions (that is, to avoid the possible confounding effects of natural selection). Future analyses of such data could help to resolve whether admixture, if it occurred, was before (low-migration model) or after (isolation and admixture model) the emergence of the AMH phenotype. For this purpose, additional summaries of the DNA resequencing data should be evaluated for their power to distinguish among the predictions of these models.
Nature Reviews Genetics 7, 669-680 (September 2006) | doi:10.1038/nrg1941

Reconstructing human origins in the genomic era

Daniel Garrigan and Michael F. Hammer

Abstract

Analyses of recently acquired genomic sequence data are leading to important insights into the early evolution of anatomically modern humans, as well as into the more recent demographic processes that accompanied the global radiation of Homo sapiens. Some of the new results contradict early, but still influential, conclusions that were based on analyses of gene trees from mitochondrial DNA and Y-chromosome sequences. In this review, we discuss the different genetic and statistical methods that are available for studying human population history, and identify the most plausible models of human evolution that can accommodate the contrasting patterns observed at different loci throughout the genome.

Link

New PNAS paper on Flores hominid

John Hawks has much more info. I will post the abstract and any comments when it appears. From the Guardian:
"The question that I and my colleagues have asked ourselves is how anyone could possibly believe this," said Robert Eckardt at Pennsylvania State University, who co-authored the critique in the Proceedings of the National Academy of Sciences. "There was such a will to believe in the story that critical faculties were suspended on the part of many people."

The Sydney Morning Herald:
Very short villagers who live close to where the remains of tiny, prehistoric humans were found on the Indonesian island of Flores are the descendants of these so-called hobbits, scientists say.

In a reigniting of a scientific dispute over the significance of the remains, Indonesian, Australian and American sceptics led by Teuku Jacob have published their analysis of the bones in a respected scientific journal for the first time.

They say that the hobbits were not a new species because some of their facial and bodily features are found in Rampasasa pygmies living about a kilometre from Liang Bua cave, where the bones were unearthed.

National Geographic:

Robert Eckhardt is a professor of developmental genetics and evolutionary morphology at Pennsylvania State University in University Park and a study co-author.

"We think the area is populated by people of short stature, and the Liang Bua cave sample in general is equivalent with that short stature," Eckhardt said.
And the New York Times:
In the report, Dr. Jacob and his colleagues cited 140 features of the skull that they said placed it “within modern human ranges of variation.” They also noted features of two jaws and some teeth that “either show no substantial deviation from modern Homo sapiens or share features (receding chins and rotated premolars) with Rampasasa pygmies now living near Liang Bua Cave,” where the discovery was made.

“We have eliminated the idea of a new species,” Robert B. Eckhardt, a professor of developmental genetics at Penn State who was a team member, said in a telephone interview. “After a time, this will be admitted.”

That time has not yet come.

Peter Brown, a paleontologist at the University of New England in Armidale, Australia, who was a leader of the team that discovered the “little people” bones, took sharp issue with the new report.

In an e-mail message, Dr. Brown said, “The authors provide absolutely no evidence that the unique combination of features found in Homo floresiensis are found in any modern humans.”

This seems to be a case where scientists' ideas of what constitutes a modern human got the better of them. In recent times, we have become accustomed with the range of variation found in most human racial groups, that we forget how extraordinary it once was.

When explorers first encountered foreign racial groups, they often debated whether or not they were truly human. Today, many interpret these debates as evidence of racist attitudes, but, we should not forget how bizarre the indigenous foreigners must have looked to people accustomed to seeing people of their own race. The noses and hairiness of the Caucasoids just looked weird to the Mongoloids, just as the black color and flattened noses of the Negroids looked weird to Caucasoids.

In time, and with increased familiarization, it became clear that the foreigners were simply different humans. They could talk, they could sing, they could trade, and eventually it was obvious that they could bear children if they copulated with one's own race. Such a process of familiarization could not be effected with the Flores hominids. Thus, the default insinct, that these grapefruit-brained halflings could not be Homo sapiens kicked in.

Previous posts on Flores hominids.

UPDATE. The abstract has now appeared. The Homo sapiens in the title is a bit of schadenfreude directed at the Homo floresiensis folks, methinks.

Proc. Natl. Acad. Sci. USA, 10.1073/pnas.0605563103

Pygmoid Australomelanesian Homo sapiens skeletal remains from Liang Bua, Flores: Population affinities and pathological abnormalities

T. Jacob et al.

Liang Bua 1 (LB1) exhibits marked craniofacial and postcranial asymmetries and other indicators of abnormal growth and development. Anomalies aside, 140 cranial features place LB1 within modern human ranges of variation, resembling Australomelanesian populations. Mandibular and dental features of LB1 and LB6/1 either show no substantial deviation from modern Homo sapiens or share features (receding chins and rotated premolars) with Rampasasa pygmies now living near Liang Bua Cave. We propose that LB1 is drawn from an earlier pygmy H. sapiens population but individually shows signs of a developmental abnormality, including microcephaly. Additional mandibular and postcranial remains from the site share small body size but not microcephaly.

Link

BioBank gets go-ahead

The New Scientist reports:
The world’s largest project to investigate how genes and lifestyle combine to cause common diseases has received the go-ahead to proceed in full.

Organisers of the UK’s “Biobank” project will now begin recruiting the half a million citizens aged between 40 and 69 they need for the project – about 1% of the UK population.

Full approval for the project was given on 22 August by the UK Medical Research Council and the Wellcome Trust, which are funding the £61-million project. It follows the success of a three-month pilot project in Manchester involving 3800 participants, which received glowing reviews from an independent international panel.

Each volunteer participating will donate small samples of urine and blood, containing their DNA, for indefinite storage in the “bank”, which will be based in Manchester. They will also respond to detailed questionnaires about their lifestyle, health and environment.

By following all participants until their death, researchers hope to identify the genetic and lifestyle factors which may have contributed to any illnesses they suffered. If genes linked to disease can be identified, it might be possible to prevent illness in carriers of the gene by altering their lifestyles, for example.

August 21, 2006

Decreasing ethnic differences in height

A poster at Gene Expression who denies the reality of the decrease in the gap between black-white IQ scores brings up an unfortunate analogy:
Consider height, for example. It's clear that there has been a genuine, real, and sustained increase in height over the last century among all groups in industrialized countries. Yet this increase has not eliminated the ethnic gaps; the improvements in those aspects of the environment affecting height (nutrition, healthcare, etc.) have acted as a rising tide lifting all boats.
Height is actually a very good analogue for IQ, since height, like IQ is a measure of good development of an organism, and its secular increase tracks IQ increases fairly closely.

In Italy, all regions have increased in height in the last century and a half, but trends were not uniform:
The height of young men has increased in all regions of Italy. The secular trend and the regional changes in stature are correlated with economic growth and a general improvement of living conditions. This is suggested by the relationship between height and various socio-economic indicators. A comparison of the 1927 birth cohort with the 1980 birth cohort shows that the mean heights for populations in Italy's southern areas, which were shorter than the national average in 1927, underwent the largest increases.
In Europe as a whole, secular increases in height vary greatly, in the direction suggested by the Italian data.

The narrowing of the gap is also evident in England:
This is the first time that trends in growth by ethnic group have been quantified in England. Despite the relative deprivation of the ethnic minority groups in inner city areas, their mean trends in height were greater than those of the representative white sample, and comparable to those of the inner city white children.
Similar results occur in the United States:
Overall, black children experienced much larger secular increases in BMI, weight, and height than did white children.
So, all boats may be rising, but they are not rising at the same rate. Hence, the difference in height decreases, at the same time that absolute height values increase.

PS: We should be careful when we bring height into discussions of human intelligence. In height, unlike intelligence, it is reasonable that there may be substantial genetic differences between populations. Differences between animal size and shape in different climates are well-established in zoology, and it is unlikely that man would be an exception in this case. Unfortunately, we cannot use our zoological insight to address the intelligence issue, since man is the only cognitively advanced species on the planet.

Genetic origin of males from El Salvador

Forensic Sci Int. 2006 Aug 14; [Epub ahead of print]

The genetic male legacy from El Salvador.

Lovo-Gomez J, Blanco-Verea A, Lareu MV, Brion M, Carracedo A.

Allele frequencies and haplotype and haplogroup analysis have been performed for 16 Y-chromosome binary markers and 8 Y-chromosome STRs (DYS19, DYS385I and II, DYS389I and II, DYS390, DYS391, DYS392, DYS393). Data was obtained from a general sample of 93 unrelated individuals living in metropolitan areas from El Salvador, and 67 individuals from different historical ethnic groups, Conchagua, San Alejo, Panchimalco, Izalco and finally Nueva Concepcion with white people. Levels of admixture among metropolitan and rural areas were evaluated and population substructure measured. A total of 13 haplogroups and 136 different haplotypes were found. The most frequent haplogroup in the general metropolitan population was the European R1b, while in the Indigenous samples considered as a whole the most frequent was the Amerindian haplogroup Q3.

Link

August 20, 2006

Frozen bodies' sperm is as good as new

Researchers have frozen male mice or just their testes, and found out that the preserved sperm is as good as new. The last sentence is particularly interesting.

Proc. Natl. Acad. Sci. USA, 10.1073/pnas.0605755103

Spermatozoa and spermatids retrieved from frozen reproductive organs or frozen whole bodies of male mice can produce normal offspring

Narumi Ogonuki et al.

Cryopreservation of male germ cells is a strategy to conserve animal species and strains of animals valuable to biomedical research. We tested whether mouse male germ cells could be cryopreserved without cryoprotection by simply freezing epididymides, testes, or whole bodies. The reproductive organs were isolated from killed mice and frozen for 1 week to 1 year at -80°C before spermatozoa and spermatids were collected and injected into mature oocytes. Normal pups were born irrespective of strains tested (ICR and C57BL/6). Epididymides and testes frozen and transported internationally to another laboratory by air could produce pups of inbred C57BL/6 mice. Testicular spermatozoa retrieved from the bodies of male mice (BALB/c nude and C3H/He strains) that had been kept frozen (-20°C) for 15 years could also produce normal offspring by microinsemination. Thus, freezing of either male reproductive organs or whole bodies is the simplest way to preserve male germ cells. Restoration of extinct species could be possible if male individuals are found in permafrost.

Link

What 2006 has brought so far

Let's see how my New Year's predictions are holding up, since the year is winding down. I have to say, I'm disappointed with the Genographic project so far; not only did they not publish a research paper yet, but it seems that their National Geographic articles have dried up as well.

Dolphins are dumber than goldfish

On the heels of the apes are smarter than monkeys post, a South African researcher suggests that dolphins' intelligence has been overestimated; he suggests that their big brains don't make them smart, but are rather useful to help them survive in water.
A South African Researcher suggests that dolphins should no longer be included in the category of the smartest animals, since a study he conducted showed that they can’t complete tasks even a goldfish did.

According to Paul Manger from Johannesburg's University of the Witwatersrand, even whales are dumber than goldfish.

The big-sized brain of dolphins may be related to keeping warm in cold water, rather than intelligence.

For years, humans have assumed the large brains of dolphins meant the mammals were highly intelligent. This is why the conclusions pulled by the SA scientist have been questioned by many marine scientists, who remain convinced of the intelligence of the marine mammals.

"We equate our big brain with intelligence. Over the years we have looked at these kinds of things and said the dolphins must be intelligent," Manger said.

"The real flaw in this logic is that it suggests all brains are built the same ... When you look at the structure of the dolphin brain you see it is not built for complex information processing," he told Reuters in an interview. A neuroethologist who looks at brain evolution, Manger's views are sure to cause a stir among a public which has long associated dolphins with intelligence, emotion and other human-like qualities.

mtDNA from century-old Malaysian hair

Am J Hum Biol. 2006 Aug 17;18(5):654-667 [Epub ahead of print]

Ancient mitochondrial DNA from Malaysian hair samples: Some indications of Southeast Asian population movements.

Ricaut FX, Bellatti M, Lahr MM.

The late Pleistocene and early Holocene population history of Southeast Asia is not well-known. Our study provides new data on mitochondrial DNA (mtDNA) lineages of the aboriginal inhabitants of the Malay Peninsula, and through an extensive comparison to the known mtDNA diversity in Southeast and East Asia, provides some new insights into the origins and historical geography of certain mtDNA lineages in the region. We extracted DNA from hair samples (dating back 100 years) preserved in the Duckworth Collection and belonging to two Peninsular Malaysian individuals identified as "Negrito." Ancient DNA was analyzed by sequencing hypervariable region I (HVS-I) of the mtDNA control region and the mtDNA region V length polymorphism. The results show that the maternal lineages of these individuals belong to a recently defined haplogroup B sub-branch called B4c2. A comparison of mitochondrial haplotypes and haplogroups with those of 10,349 East Asian individuals indicates their very restricted geographical distribution (southwestern China, Southeast Asia Peninsula, and Indonesia). Recalculation of the B4c2 age across all of East Asia ( approximately 13,000 years) and in different subregions/populations suggests its rapid diffusion in Southeast Asia between the end of the Last Glacial Maximum and the Neolithic expansion of the Holocene.

Link

August 19, 2006

Our closest relative: the orangutan?

It is commonly theorized that the closest relatives of humans are chimpanzees (Pan troglodytes). A new paper by Jeffrey Schwartz proposes that we are rather more closely related to the orangutans (genus Pongo). Schwartz argues that the genetic similarity between humans and chimps is not a reliable guide to their phylogenetic relationships, and humans share many exclusive traits in common with orangutans.

This is certainly a controversial thesis, and I am not holding my breath that the consensus will change any time soon, but we should definitely give it a proper hearing. In the very least, if morphology and genetics don't agree, we should not a priori assign precedence to genetics. Genetics is "harder" evidence for relatedness than morphology; on the other hand, genes can't be studied for fossil hominids dating to millions of years in the past.

Will our real closest relative please stand up?

Mona Lisa Smile: The Morphological Enigma of Human and Great Ape Evolution. The Anatomical Record (Part B: New Anatomist) 289B: 139-157

The science of human evolution is confronted with the popular chimpanzee theory and the earlier but largely ignored orangutan theory. The quality and scope of published documentation and verification of morphological features suggests there is very little in morphology to support a unique common ancestor for humans and chimpanzees. A close relationship between humans and African apes is currently supported by only eight unproblematic characters. The orangutan relationship is supported by about 28 well-supported characters, and it is also corroborated by the presence of orangutan-related features in early hominids. The uniquely shared morphology of humans and orangutans raises doubts about the almost universal belief that DNA sequence similarities necessarily demonstrate a closer evolutionary relationship between humans and chimpanzees. A new evolutionary reconstruction is proposed for the soft tissue anatomy, physiology, and behavioral biology of the first hominids that includes concealed ovulation, male beard and mustache, prolonged mating, extended pair-bonding, “house” construction, mechanical “genius,” and artistic expression.

Link (pdf)

August 18, 2006

mtDNA variation in Mauritania and Mali

Ann Hum Genet. 2006 Sep;70(Pt 5):631-57.

Mitochondrial DNA Variation in Mauritania and Mali and their Genetic Relationship to Other Western Africa Populations.

Gonzalez AM et al.

Mitochondrial DNA (mtDNA) variation was analyzed in Mauritania and Mali, and compared to other West African samples covering the considerable geographic, ethnic and linguistic diversity of this region. The Mauritanian mtDNA profile shows that 55% of their lineages have a west Eurasian provenance, with the U6 cluster (17%) being the best represented. Only 6% of the sub-Saharan sequences belong to the L3A haplogroup a frequency similar to other Berber speaking groups but significantly different to the Arabic speaking North Africans. The historic Arab slave trade may be the main cause of this difference. Only one HV west Eurasian lineage has been detected in Mali but 40% of the sub-Saharan sequences belong to cluster L3A. The presence of L0a representatives demonstrates gene flow from eastern regions. Although both groups speak related dialects of the Mande branch, significant genetic differences exist between the Bambara and Malinke groups. The West African genetic variation is well structured by geography and language, but more detailed ethnolinguistic clustering suggest that geography is the main factor responsible for this differentiation.

Link

August 17, 2006

White-black IQ gap has shrunk in the United States

A new study by William Dickens and James Flynn establishes that the racial IQ gap between whites and blacks in the United States has shrunk by 5-6 points. The authors used the standardization samples from four major tests (WISC, WAIS, AFQT, and Stanford-Binet) to arrive at this conclusion. Moreover, this shrinkage cannot be attributed to an increase in the proportion of Hispanic whites (since these were not included), or of biracial individuals self-identifying as blacks (since these would alter the results very slightly).

It was already fairly obvious that genetics did not play the most significant role in the white-black IQ difference. American blacks, for example have about 1/5 White ancestry, yet score about half-way between African blacks and American whites. If genetics played the most significant role, we would expect American blacks to be closer to African blacks. But, this is not the case: as American blacks enjoy better living conditions than African blacks, they have a correspondingly higher IQ.

Furthermore, it is well-known that American blacks were oppressed in American society even after their liberation, and have only achieved legal equality in the last two generations. Thus, it is not surprising that their IQ level rises. It is also known that blacks still have a deficit when it comes to living in good homes and neighborhoods, being breastfed, attending good schools, and they also have problems finding good jobs because American elites prefer to high cheaper and more docile immigrants, especially from Latin America. Moreover, black culture is unfortunately often opposed to education and scholastic achievement, and favors other avenues of achievement.

Thus, it would seem that American blacks could further reduce the racial IQ gap in the future if progress is made in the above factors. Perhaps a small IQ gap could remain even after full environmental equality is achieved, but it is increasingly clear that any kind of "racial" difference in intelligence is of small scope, especially since American Negroids are already performing as well as some Caucasoid and Mongoloid groups.

From the paper:
The constancy of the black/white IQ gap is a myth. Blacks have gained 5 or 6 IQ points on whites over the last 30 years. Neither changes in the ancestry of those classified as black nor changes in those who identify as black can explain more than a small fraction of this gain. Therefore, environment has been responsible. The last two decades have seen both positive and negative developments: gains in occupational status and school funding have been accompanied by more black preschoolers in single-parent homes and lower income in those homes (Neal, in press). We believe that further black environmental progress would engender further black IQ gains.

Forthcoming: Psychological Science, October 2006

Black Americans Reduce the Racial IQ Gap: Evidence from Standardization Samples

William T. Dickens and James R. Flynn

It is often asserted that blacks have made no IQ gains on whites, despite relative environmental gains, and that this adds credibility to the case that the black/white IQ gap has genetic origins. Until recently, there have been no adequate data to measure black IQ trends. We analyze data from nine standardization samples for four major tests of cognitive ability. These suggest that blacks have gained 5 or 6 IQ points on non-Hispanic whites between 1972 and 2002. Gains have been fairly uniform across the entire range of black cognitive ability.

Link (pdf)

HAR1F gene affects the development of the human cortex

The importance of the human cortex in cognitive ability is well known (e.g., here). A new paper in Nature discusses a new RNA gene in which humans differ from chimps, and which is believed to affect the development of the cortex during gestation.

Nature (advance online publication)

Katherine S. Pollard et al.

The developmental and evolutionary mechanisms behind the emergence of human-specific brain features remain largely unknown. However, the recent ability to compare our genome to that of our closest relative, the chimpanzee, provides new avenues to link genetic and phenotypic changes in the evolution of the human brain. We devised a ranking of regions in the human genome that show significant evolutionary acceleration. Here we report that the most dramatic of these 'human accelerated regions', HAR1, is part of a novel RNA gene (HAR1F) that is expressed specifically in Cajal–Retzius neurons in the developing human neocortex from 7 to 19 gestational weeks, a crucial period for cortical neuron specification and migration. HAR1F is co-expressed with reelin, a product of Cajal–Retzius neurons that is of fundamental importance in specifying the six-layer structure of the human cortex. HAR1 and the other human accelerated regions provide new candidates in the search for uniquely human biology.

Link

mtDNA of Sardinian genetic isolates

Molecular Biology and Evolution, doi:10.1093/molbev/msl084

High Resolution Analysis and Phylogenetic Network Construction Using Complete mtDNA Sequences in Sardinian Genetic Isolates

Cristina Fraumene et al.

Abstract

For mitochondrial phylogenetic analysis, the best result comes from complete sequences. We therefore decided to sequenced the entire mtDNA (coding and D-loop regions) of 63 individuals selected in three small Ogliastra villages, an isolated area of eastern Sardinia: Talana, Urzulei and Perdasdefogu. We studied at least one individual for each of the most frequent maternal genealogical lineages belonging to haplogroups H, V, J, K, T, U and X. We found in our 63 samples, 172 and 69 sequence changes in the coding and in the D-loop region respectively. Thirteen out of 172 sequence changes in the coding region are novel. It is our hypothesis that some of them are characteristic of the Ogliastra region and/or Sardinia.

We reconstructed the phylogenetic network of the 63 complete mtDNA sequences for the three villages. We also drew a network including a large number of European sequences and calculated various indices of genetic diversity in Ogliastra. It appears that these small populations remained extremely isolated and genetically differentiated compared to other European populations. We also identified in our samples a never previously described subhaplogroup, U5b3, that seems peculiar to the Ogliastra region.

Link

August 15, 2006

Apes are smarter than monkeys

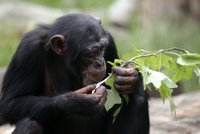
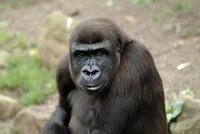
Here are pictures of members of the top-5 genera: Pongo, Pan, Ateles, Gorilla, Presbytis (see Figure 2 in the paper)


Deaner, R. O., van Schaik, C. P. and Johnson, V. (2006) Do some taxa have better domain-general cognition than others? A meta-analysis of nonhuman primate studies. Evolutionary Psychology, 4:149-196. (pdf)

Abstract

Although much recent attention has focused on identifying domain-specific taxonomic differences in cognition, little effort has been directed towards investigating whether domain-general differences also exist. We therefore conducted a meta-analysis of published nonhuman primate cognition studies, testing the prediction that some taxa outperform others across a range of testing situations. First, within each of nine experimental paradigms with interspecific variation, we grouped studies by their procedures and the characteristics of their study subjects. Then, using Bayesian latent variable methods, we tested whether taxonomic differences consistently held within or across paradigms. No genus performed especially well within particular paradigms, but genera differed significantly in overall performance. In addition, there was evidence of variation at higher taxonomic levels; most notably, great apes significantly outperformed other lineages. These results cannot be readily explained by perceptual biases or any other contextual confound and instead suggest that primate taxa differ in some kind of domain-general ability.

...

If taxa do indeed differ in domain-general cognitive abilities, then this could help explain the distribution of spontaneously occurring complex behavior. Thus, in primates, the great apes, the best performers across the cognitive paradigms, show relatively high rates of deception, highly complex manipulation, population-wide tool use in the wild, and robust mirror self-recognition (Byrne & Whiten, 1992; Tomasello & Call, 1997; van Schaik et al., 1999; de Veer & van den Bos, 1999; Inoue-Nakamura, 1997). By contrast, prosimians, which had the overall lowest scores, exhibit little manual dexterity and no tool use, deception, or mirror self-recognition (ibid). Future studies will be necessary to determine the robustness of these taxonomic differences and to test if the global variables also explain variation within great apes, monkeys, and prosimians.

Einstein's head

His skull is clearly, and to an extraordinary degree, brachycephalic, great in breadth and receding towards the nape of the neck without exceeding the vertical. Here is an illutration which brings to nought the old assurances of the phrenologists and certain biologists, according to which genius is the prerogative of the dolichocephales. The skull of Einstein reminds me, above all else, of that of Renan, who was also a brachycephale. As with Renan the forehead is huge; its breadth exceptional, its spherical form striking one more than its height.

Einstein: The Life and Times, by Ronald W. Clark, p. 353

See also Cranial Size and Shape and the German Hyperbrachycephals.

August 13, 2006

Artefacts support theory of human origins in Africa

Artefacts support theory man came from Africa (Independent)

Fragments of ostrich eggs, perforated beads and finely shaped arrowheads have provided the first firm archaeological evidence for the "out of Africa" origins of the world's human population.

Scientists have found stark similarities in the ancient cultural artefacts made and used by Stone Age people who migrated out of Africa and into Asia more than 50,000 years ago.

It is the first time that archaeologists have been able to link African and Indian artefacts so closely together even though they were discovered 3,000 miles apart - suggesting they were made by the same people, albeit of different generations.

Until now the "out of Africa" hypothesis, developed by physical anthropologists and geneticists, has relied almost entirely on the analysis of human skeletal remains or on DNA studies. But a comparative study of Stone Age artefacts found in Africa and India, carried out by Professor Paul Mellars, a Cambridge University archaeologist, has revealed remarkable cultural and technological similarities that suggest a common origin.

mtDNA of Fulani nomads

Hum Biol. 2006 Feb;78(1):9-27

MtDNA of Fulani nomads and their genetic relationships to neighboring sedentary populations.

Cerný V, Hájek M, Bromová M, Cmejla R, Diallo I, Brdicka R

Despite the large size of the contemporary nomadic Fulani population (roughly 13 million people), the genetic diversity and degree of differentiation of Fulanis compared to other sub-Saharan populations remain unknown. We sampled four Fulani nomad populations (n = 186) in three countries of sub-Saharan Africa (Chad, Cameroon, and Burkina Faso) and analyzed sequences of the first hypervariable segment of the mitochondrial DNA. Most of the haplotypes belong to haplogroups of West African origin, such as L1b, L3b, L3d, L2b, L2c, and L2d (79.6% in total), which are all well represented in each of the four geographically separated samples. The haplogroups of Western Eurasian origin, such as J1b, U5, H, and V, were also detected but in rather low frequencies (8.1% in total). As in African hunter-gatherers (Pygmies and Khoisan) and some populations from central Tunisia (Kesra and Zriba), three of the Fulani nomad samples do not reveal significant negative values of Fu's selective neutrality test. The multidimensional scaling of FST genetic distances of related sub-Saharan populations and the analysis of molecular variance (AMOVA) show clear and close relationships between all pairs of the four Fulani nomad samples, irrespective of their geographic origin. The only group of nomadic Fulani that manifests some similarities with geographically related agricultural populations (from Guinea-Bissau and Nigeria) comes from Tcheboua in northern Cameroon.

Link

Different origins of Black Brazilians

Hum Biol. 2006 Feb;78(1):29-41

MtDNA haplogroup analysis of black Brazilian and sub-Saharan populations: implications for the Atlantic slave trade.

Silva WA, Bortolini MC, Schneider MP, Marrero A, Elion J, Krishnamoorthy R, Zago MA

Seventy individuals from two African and four black Brazilian populations were studied for the first hypervariable segment of mtDNA. To delineate a more complete phylogeographic scenario of the African mtDNA haplogroups in Brazil and to provide additional information on the nature of the Atlantic slave trade, we analyzed our data together with previously published data. The results indicate different sources of African slaves for the four major Brazilian regions. In addition, the data revealed patterns that differ from those expected on the basis of historical registers, thus suggesting the role of ethnic sex differences in the slave trade.

Link

August 12, 2006

Evolutionary distinctiveness of modern humans vs. Neandertals

Erik Trinkaus (see also Early Modern Humans) has an article on the distinctiveness of modern humans vs. Neandertals. By comparing modern humans and Neandertals with early Homo he found out that both Neandertals and modern humans possess several derived (evolved) features: some of them are shared by the two species, but modern humans have more such distinctive features than Neandertals; thus, they are more "different" from early Homo than Neandertals. His conclusion?
When these data on probable trait polarities are combined and one appropriately uses the available data from the entire skeleton and dentition, it is not the Neandertals who appear unusual, special, derived, autapomorphous. It is we.


Perhaps, rather than trying to document the deviant nature of the Neandertals, we should be more focused on understanding the complex evolutionary processes that led from Middle Pleistocene archaic members of the genus Homo to the emergence and eventual dispersal of people anatomically similar to ourselves. Some of this may be explainable in stochastic terms, and the distributions of a variety of the traits considered here should best be seen as influenced primarily by genetic drift and isolation-by-distance in a geographically widespread species. However, other traits may well have selective valences or, more likely, be reflections of selective forces on human biology. But as long as it is regional variants of archaic Homo that are considered in need of explanation and the emergence and subsequent domination of modern humans are taken as given, it is unlikely that the appropriate questions will be framed.


Current Anthropology, volume 47 (2006), pages 597–620

Modern Human versus Neandertal Evolutionary Distinctiveness

Erik Trinkaus

Considerations of morphological variation among later Pleistocene human groups have focused principally on the distinctiveness of the Neandertals of western Eurasia relative to their predecessors and to penecontemporaneous and recent modern humans. In this discussion, there has been a dearth of attention of the degree to which modern humans are derived relative to earlier members of the genus Homo. Of 75 cranial, mandibular, dental, axial, and appendicular traits in which the Neandertals and/or modern humans are derived relative to Early and Middle Pleistocene Homo, approximately one-quarter are shared among Neandertals and modern humans, a similar percentage largely unique to the Neandertals, and about half largely unique to modern humans. The results are similar whether the Neandertals are compared with the earliest modern humans or with their Late Pleistocene and more recent modern human successors. Even though these figures could shift modestly through variation in trait selection and/or as a result of a more complete earlier Pleistocene Homo fossil record, it is apparent that modern humans are morphologically more derived than the Neandertals. Our focus should therefore be at least as much on the evolutionary biology of early and recent modern humans as on that of the Neandertals.

Link

August 11, 2006

Latitude Centrality and Brilliance in Europe

I have often made the point that one should not consider only the average values when discussing the achievement of different populations.

I was looking at the TIMSS international mathematics report, and I was struck once again by the great differences in the shapes of mathematical ability distributions in different countries. In the 8th grade report, for example, the standard deviation of mathematical ability ranged from 60 in Tunisia, to 107 in South Africa, no doubt to the multi-racial character of the last country.

I entered the data from European countries into a spreadsheet to do some more analyses. The countries were (N=19): Belgium, Bulgaria, England, Estonia, Hungary, Italy, Latvia, Lithuania, FYRO Macedonia, Moldova, Netherlands, Norway, Romania, Russian Federation, Scotland, Serbia, Slovak Republic, Slovenia, Sweden

I mainly wanted to check whether my previous observation was accurate, that "A third observation is that there is a significant geographic structuring of the standard deviation of IQ." As before, I used the latitude of capital cities to represent the different countries.

The analysis of the mathematical achievement in this sample revealed (as before) that more southern countries have a higher standard deviation of achievement than more northern ones. This time, the R-squared value was 51.8%. As before, latitude did not predict the average achievement (R-squared value of 2.9%).

Next, I concentrated on the performance of top achievers, i.e., those who belong to the top 5% of the distribution (95% percentile). I regressed the 95% percentile on both latitude and a derivative "latitude peripherality" which was defined as |latitude-mean(latitude)|. Latitude peripherality is high for countries that are in the northern and southern extremes of latitude, and is low for more centrally placed ones.

It turns out that latitude does not predict the performance of the most brilliant students, belonging to the top-5% (R-squared is 3.2%). On the other hand, latitude peripherality does, and is negatively correlated with it (R-squared of 29.3%).

So, it seems that the countries of the middle latitude zone produce more geniuses per capita (at least 8th grade ones) than the more northern and southern regions in Europe [1]. Topping the achievement chart are the Hungarians, those notorious aliens.

[1] It should be noted however, that with the exception of Italy and some Slavic countries of the Balkans, Mediterranean Europe was not represented in this sample.

UPDATE (14 AUG): Using the PISA data that someone posted on the comments, it turns out that latitude explains 10% of the variance in the percentage of students who have a proficiency score above 668 in mathematics. Latitude peripherality explains 23% of the variance. Thus, the PISA results also indicate that latitude centrality, i.e., intermediate north-south geographical position in Europe is associated with top performance in Europe. All European countries in the PISA dataset were used except for the small states of Luxemburg and Liechtenstein.

August 10, 2006

Genetic affinities of Indian caste and tribal groups

A new paper in BMC Genetics examines the origins of Indian population groups. There have been other recent studies on the same topic.

BMC Genet. 2006 Aug 7;7(1):42

Genetic affinities among the lower castes and tribal groups of India: Inference from Y chromosome and mitochondrial DNA.

Thanseem I, Thangaraj K, Chaubey G, Singh VK, Bhaskar LV, Reddy MB, Reddy AG, Singh L.

ABSTRACT: BACKGROUND: India is a country with enormous social and cultural diversity due to its positioning on the crossroads of many historic and pre-historic human migrations. The hierarchical caste system in the Hindu society dominates the social structure of the Indian populations. The origin of the caste system in India is a matter of debate with many linguists and anthropologists suggesting that it began with the arrival of Indo-European speakers from Central Asia about 3500 years ago. Previous genetic studies based on Indian populations failed to achieve a consensus in this regard. We analysed the Y-chromosome and mitochondrial DNA of three tribal populations of southern India, compared the results with available data from the Indian subcontinent and tried to reconstruct the evolutionary history of Indian caste and tribal populations. RESULTS: No significant difference was observed in the mitochondrial DNA between Indian tribal and caste populations, except for the presence of a higher frequency of west Eurasian-specific haplogroups in the higher castes, mostly in the north western part of India. On the other hand, the study of the Indian Y lineages revealed distinct distribution patterns among caste and tribal populations. The paternal lineages of Indian lower castes showed significantly closer affinity to the tribal populations than to the upper castes. The frequencies of deep-rooted Y haplogroups such as M89, M52, and M95 were higher in the lower castes and tribes, compared to the upper castes. CONCLUSIONS: The present study suggests that the vast majority (>98%) of the Indian maternal gene pool, consisting of Indio-European and Dravidian speakers, is genetically more or less uniform. Invasions after the late Pleistocene settlement might have been mostly male-mediated. However, Y-SNP data provides compelling genetic evidence for a tribal origin of the lower caste populations in the subcontinent. Lower caste groups might have originated with the hierarchical divisions that arose within the tribal groups with the spread of Neolithic agriculturalists, much earlier than the arrival of Aryan speakers. The Indo-Europeans established themselves as upper castes among this already developed caste-like class structure within the tribes.

Link