October 29, 2009

Coevolution of individualism–collectivism and the serotonin transporter gene

From the paper:
Here, we demonstrate for the first time a robust association between cultural values of individualism–collectivism and allelic frequency of the serotonin transporter gene, controlling for associated economic and disease factors. Geographical regions characterized by cultural collectivism exhibit a greater prevalence of S allele carriers of the serotonin transporter gene, even when cultural regions rather than nations served as the unit of analysis. Additionally, we show that global variability in historical pathogen prevalence predicts global variability in individualism–collectivism owing to genetic selection of the S allele of the serotonin transporter gene in regions characterized by high collectivism. Importantly, we also reveal a novel and surprising negative association between individualism–collectivism, frequency of S allele carriers of the serotonin transporter gene and global prevalence of anxiety and mood disorder. Across nations, both collectivism and allelic frequency of the S allele negatively predict global prevalence of anxiety and mood disorders. Critically, our results further indicate that greater population frequency of S allele carriers is associated with decreased prevalence of anxiety and mood disorders due to increased cultural collectivism.

The current findings suggest a novel demonstration of culture–gene coevolution of human behaviour. Emphasizing social norms that increase social harmony and encourage giving social support to others, collectivism serves an ‘anti-psychopathology’ function by creating an ecological niche that lowers the prevalence of chronic life stress, protecting genetically susceptible individuals from environmental pathogens known to trigger negative emotion and psychopathology. These findings complement notions that cultural values of individualism and collectivism are adaptive and by-products of evolution, more broadly. For instance, recent evidence suggests that cultural values of collectivism also serve an ‘anti-pathogen defence’ whereby behavioural manifestations of collectivism, such as conformity and parochialism, function as buffers against the transmission and increased prevalence of disease-causing pathogens (e.g. malaria, typhus and tuberculosis) (Fincher et al. 2008). Our results provide novel evidence that geographical regions characterized by collectivistic cultural norms have a higher historical and contemporary prevalence of infectious diseases due, at least partially, to genetic selection of S allele carriers (Fincher et al. 2008). Taken together, these findings dovetail nicely as two examples of how cultural values serve adaptive functions by tuning societal behaviour so that social and environmental risk factors are reduced and physical and mental health of group members is maintained. Importantly, in the current study, we found that population frequency of the serotonin transporter gene was a singular predictor of cultural values of individualism–collectivism across nations, even when controlling for historical and contemporary pathogen prevalence. Hence, our findings illustrate that gene frequency plays a unique role in explaining global variation in the adoption of cultural norms and is fundamental to any comprehensive understanding of culture.

Proceedings of the Royal Society B doi:10.1098/rspb.2009.1650

Culture–gene coevolution of individualism–collectivism and the serotonin transporter gene


Joan Y. Chiao, and Katherine D. Blizinsky

Culture–gene coevolutionary theory posits that cultural values have evolved, are adaptive and influence the social and physical environments under which genetic selection operates. Here, we examined the association between cultural values of individualism–collectivism and allelic frequency of the serotonin transporter functional polymorphism (5-HTTLPR) as well as the role this culture–gene association may play in explaining global variability in prevalence of pathogens and affective disorders. We found evidence that collectivistic cultures were significantly more likely to comprise individuals carrying the short (S) allele of the 5-HTTLPR across 29 nations. Results further show that historical pathogen prevalence predicts cultural variability in individualism–collectivism owing to genetic selection of the S allele. Additionally, cultural values and frequency of S allele carriers negatively predict global prevalence of anxiety and mood disorder. Finally, mediation analyses further indicate that increased frequency of S allele carriers predicted decreased anxiety and mood disorder prevalence owing to increased collectivistic cultural values. Taken together, our findings suggest culture–gene coevolution between allelic frequency of 5-HTTLPR and cultural values of individualism–collectivism and support the notion that cultural values buffer genetically susceptible populations from increased prevalence of affective disorders. Implications of the current findings for understanding culture–gene coevolution of human brain and behaviour as well as how this coevolutionary process may contribute to global variation in pathogen prevalence and epidemiology of affective disorders, such as anxiety and depression, are discussed.

Link

October 27, 2009

mtDNA in southern Italy

Ann Hum Biol. 2009 Oct 25. [Epub ahead of print]

Human mitochondrial DNA variation in Southern Italy

Ottoni C, Martinez-Labarga C, Vitelli L, Scano G, Fabrini E, Contini I, Biondi G, Rickards O.

Background: Since prehistoric times Southern Italy has been a cultural crossroads of the Mediterranean basin. Genetic data on the peoples of Basilicata and Calabria are scarce and, particularly, no records on mtDNA variability have been published. Aim: In this study mtDNA haplotypes of populations from Basilicata, Calabria and Sicily are compared with those of other Italian and Mediterranean populations, so as to investigate their genetic relationships. Subjects and methods: A total of 341 individuals was analysed for mtDNA in order to provide their classification into haplogroups. Multivariate analysis was used to compare the studied populations with other Mediterranean samples; median-joining network analysis was applied to observe the relationship between the major lineages of the Southern Italians. Results: The haplogroup distribution in the Southern Italian samples falls within the typical pattern of mtDNA variability of Western Eurasia. The comparison with other Mediterranean countries showed a substantial homogeneity of the area, which is probably related to the historic contact through the Mediterranean Sea. Conclusion: The mtDNA analysis demonstrated that Southern Italy displays a typical pattern of Mediterranean basin variability, even though it appears plausible that Southern Italy was less affected by the effects of the Late Glacial Maximum, which reduced genetic diversity in Europe.

Link

October 26, 2009

Ancient Greeks introduced wine to France

Related: Wikipedia article on the Vix Grave. Covered elsewhere: Greeks uncorked French passion for wine.

Ancient Greeks introduced wine to France, Cambridge study reveals
The original makers of Côtes-du-Rhône are said to have descended from Greek explorers who settled in southern France about 2500 years ago, it claimed.

The study, by Prof Paul Cartledge, suggested the world's biggest wine industry might never have developed had it not been for a “band of pioneering Greek explorers” who settled in southern France around 600 BC.

His study appears to dispel the theory that it was the Romans who were responsible for bringing viticulture to France.

The study found that the Greeks founded Massalia, now known as Marseilles, which they then turned into a bustling trading site, where local tribes of Ligurian Celts undertook friendly bartering.

Prof Cartledge said within a matter of generations the nearby Rhône became a major thoroughfare for vessels carrying terracotta amphorae that contained what was seen as a new, exotic Greek drink made from fermented grape juice.

He argued the new drink rapidly became a hit among the tribes of Western Europe, which then contributed to the French’s modern love of wine.

"I hope this will lay to rest an enduring debate about the historic origins of supermarket plonk,” he said.

"Although some academics agree the Greeks were central to founding Europe's wine trade, others argue the Etruscans or even the later Romans were the ones responsible for bringing viticulture to France.”

Archaeologists have discovered a five-foot high, 31.5 stone bronze vessel, the Vix Krater, which was found in the grave of a Celtic princess in northern Burgundy, France.

Prof Cartledge said there were two main points that proved it was the Greeks who introduced wine to the region.

"First, the Greeks had to marry and mix with the local Ligurians to ensure that Massalia survived, suggesting that they also swapped goods and ideas.

"Second, they left behind copious amounts of archaeological evidence of their wine trade (unlike the Etruscans and long before the Romans), much of which has been found on Celtic sites."

The research forms part of Professor Cartledge's study into where the boundaries of Ancient Greece began and ended.

Rather than covering the geographical area occupied by the modern Greek state, he argued Ancient Greece stretched from Georgia in the east to Spain in the west.

October 25, 2009

European population substructure and systemic lupus erythematosus

Genes Immun. 2009 Oct 22. [Epub ahead of print]

European population substructure correlates with systemic lupus erythematosus endophenotypes in North Americans of European descent.

Richman IB, Chung SA, Taylor KE, Kosoy R, Tian C, Ortmann WA, Nititham J, Lee AT, Rutman S, Petri M, Manzi S, Behrens TW, Gregersen PK, Seldin MF, Criswell LA.

Previous work has demonstrated that Northern and Southern European ancestries are associated with specific systemic lupus erythematosus (SLE) manifestations. In this study, 1855 SLE cases of European descent were genotyped for 4965 single-nucleotide polymorphisms and principal components analysis of genotype information was used to define population substructure. The first principal component (PC1) distinguished Northern from Southern European ancestry, PC2 differentiated Eastern from Western European ancestry and PC3 delineated Ashkenazi Jewish ancestry. Compared with Northern European ancestry, Southern European ancestry was associated with autoantibody production (odds ratio (OR)=1.40, 95% confidence interval (CI) 1.07-1.83) and renal involvement (OR 1.41, 95% CI 1.06-1.87), and was protective for discoid rash (OR=0.51, 95% CI 0.32-0.82) and photosensitivity (OR=0.74, 95% CI 0.56-0.97). Both serositis (OR=1.46, 95% CI 1.12-1.89) and autoantibody production (OR=1.38, 95% CI 1.06-1.80) were associated with Western compared to Eastern European ancestry. Ashkenazi Jewish ancestry was protective against neurologic manifestations of SLE (OR=0.62, 95% CI 0.40-0.94). Homogeneous clusters of cases defined by multiple PCs demonstrated stronger phenotypic associations. Genetic ancestry may contribute to the development of SLE endophenotypes and should be accounted for in genetic studies of disease characteristics.

Link

October 24, 2009

Stephen Oppenheimer's bad science

Stephen Oppenheimer is quoted in the Times Online in regard to some comments that BNP leader Nick Griffin recently made about indigenous Britons. From the article titled Nick Griffin's Bad Science.
Watching Nick Griffin's performance on Question Time last night, I was struck by more than his objectionable views and evasive answers. He also seems to have a distinctly sketchy grasp of science, which he misrepresents to support his idea that Britain belongs to its "indigenous people".

He described white English, Welsh, Scottish and Irish people as "Britain's aborigines", suggesting these groups are descended from an ancestral population that arrived 17,000 years ago. Scientists, he said, would happily confirm this.

His comments seem, so far as I can tell, to be based on the hypothesis advanced by Stephen Oppenheimer, of Oxford University, in his book The Origins of the British. This uses genetic data to suggest that about 75 per cent of British ancestry can be traced back to very ancient times, before the Anglo-Saxons, Romans and Celts -- the argument is summarised nicely in this Prospect piece.
Part of Openheimer's response:
"About three quarters of the ancestors had arrived before the neolithic. Most of the rest arrived during the neolithic. There’s about 5 per cent from Anglo-Saxons, about 6 per cent from Vikings."
The idea of Paleolithic genetic continuity has been demolished recently, as I detail in Migrationism Strikes Back. Most of the mtDNA haplogroups, thought by scientists to have been in Europe since the Paleolithic, were absent when actual Paleolithic DNA was tested. Genetic continuity must be proven directly, and inferences from modern populations are suspect.

Oppenheimer bases his inferences on age calculations based on Y-chromosome STRs on modern populations, using an extreme evolutionary mutation rate that overestimates time depth by almost an order of magnitude, and leads to even more extreme time overestimates than the evoluationary rate that I criticized recently.

I had been positively inclined towards Oppenheimer's work, and I still consider it superior to other popularizing efforts, because of its data richness and clear effort to synthesize different strands of knowledge. In retrospect, however, it is flawed, as it is based on faulty mutation rates and faulty interpretation:

Oppenheimer's argument is a special case of what Francois Balloux described recently, and Guido Barbujani a long time ago. To make a long story short, it doesn't matter if a certain haplogroup found in Britons is 1,000 or 10,000 years old. Knowing this fact tells us nothing about when the patrilineage arrived in Britain: a 1,000-year old haplogroup may have developed from a British line of ancestors that were reduced to a single man 1,000 years ago, and a 10,000-year old haplogroup may have arrived in Britain only 10 years ago by a group of distantly related immigrants.

Nick Griffin is of course also wrong in inferring that Britons are descended from Paleolithic ancestors. But, he is wrong only in misquoting a date and in building a political case around a belief in Oppenheimer's inferences on Paleolithic origins of Britons.

Oppenheimer's political case is also flawed, however:
"He’s missed the point of the genetics in terms of his perspective that he can determine who is indigenous British. All British people are immigrants. As Bonnie Greer pointed out, the original Britons were Neanderthals. They were exterminated, then the Ice Age left a clean sheet. The modern population is essentially of north Iberian origin. So what’s British?"
Clearly the word "indigenous" cannot be taken literally and everyone living in Britain is descended from people who arrived there at some point or another. But, this is a gross oversimplification of the situation. Why do people speak of "native" Americans or Australian "aborigines"? They do not, certainly, mean that these people emerged from American or Australian soil. What they do mean, however, is that these people are the oldest recorded inhabitants of their homelands, the first people that can be named.

In the case of Britain, there are indeed indigenous people that can and are named by ancient writers, e.g. the Britons or Picts. No traditions for the immigration of these people exists, although their immigration can be inferred on linguistic grounds (Britons were IE speakers). There were certainly other people before them, whose names are lost to memory, but whose genetic trace may persist in the current inhabitants. There are also non-indigenous people that arrived there a long time ago, e.g., the Gaels, the Anglo-Saxons, the Norse, or the Normans, and their arrival was noted by historians. Finally, there are people that arrived in Great Britain more recently, e.g., Poles or Pakistanis.

Is there any way to distinguish between all these groups?

Clearly, one possible distinction is chronological: groups that arrived earlier are more indigenous than groups that arrived later. However, this is a relative difference, which does not allow us to make a sharp distinction between indigenous and foreign. 50 generations certainly earns you more "native" points than 2, but no obvious demarcation of indigeneity exists.

However, the main distinction is between groups that developed in situ and groups that arrived from elsewhere. The English are descended from a bunch of different sets of people, but as a people they developed in the country that came to be known as England.

In that sense the English are indigenous to England, not because their genes didn't arrive from elsewhere (they did), but in the sense that they became a people in the land itself. Different people were grafted onto the English over time, but they became English in an ethnic sense by being grafted onto them, and not by simply co-existing with them while retaining their own identity.

October 23, 2009

140,000-year divergence time between Eurasians and West Africans

From the paper:
Perhaps our most interesting demographic results are the inferred divergence times. Other studies [11],[12] have estimated divergence times between Europeans and East Asians similar to the ≈23 kya we infer. Interestingly, archeological evidence places humans in Europe much earlier (≈40 kya) [1]. Our inferred divergence time of ≈22 kya between East Asians and Mexican-Americans is somewhat older than the oldest well-accepted New World archeological evidence [2]. The divergence we infer may reflect the settlement of Beringia, rather than the expansion into the New World proper [14]. Finally, the divergence time of ≈140 kya we infer between African and Eurasian populations is consistent with archeological evidence for modern humans in the Middle East ≈100 kya [1], but it is much older than other inferences of ≈50 kya divergence from mitochondrial DNA [1]. This discrepancy may be explained by our inclusion of migration in the model. Migration preserves correlation between population allele frequencies, so an observed correlation across the genome can be explained by either recent divergence without migration or ancient divergence with migration. In fact, the African-Eurasian migration rate we infer of ≈25×10−5 per generation is comparable to the ≈100×10−5 inferred from census records between modern continental Europe and Britain [55].

One difficulty in interpreting our divergence times is that the sampled populations may not best represent those in which historically important divergences occurred. For example, the Yoruba are a West African population, so the divergence time we infer between Yoruba and Eurasian ancestral populations may correspond to divergence within Africa itself. Future studies of more populations [56]–[58] will help alleviate this difficulty.
Some comments:
  • The 140ky divergence time between Eurasians and West Africans is consistent with my idea of Africans being divided into Palaeoafricans and Afrasians. The 140ky gap includes both divergence since Eurasians left Africa, as well as divergence between ancestral Eurasians ("Afrasians") and earlier African populations ("Palaeoafricans'). It remains to be seen whether the bulk of the 140ky occurred in Africa itself (in which case conventional Out of Africa c. 40kya is affirmed), or outside Africa (in which case Out of Africa c. 100kya, evidenced by early modern skulls acquires a new significance).
  • East Asian - Native American divergence of 22ky predates the known settlement of the Americas. But, this is not a problem, since we must split the 22ky into 15ky (since the settlement), and 8ky, which is reasonable time for divergence between the ancestors of the Chinese and the populations that headed north, and perhaps stayed in Beringia before crossing into the Americas.
  • East Asian - European divergence of 23ky suggests, in agreement with recent mtDNA evidence, that Europeans are not primarily descended from the earliest (or even the latest) Upper Paleolithic population of the continent. This seems to also be in agreement with Y-chromosome evidence that suggests interesting East-West connections in Eurasia that are not easily explained by a simple early divergence model with no subsequent link between east and west (e.g., western E vs. eastern D, western R vs. eastern Q, northern N vs. eastern O, etc.). It is also in agreement with the mtDNA picture (West Eurasian N dominance, East Eurasian mixed N/M).
Naturally, both the increased age of divergence of 140ky (compared to other studies), as well as the wide confidence intervals suggest that we must always treat genetic age estimates with the utmost caution.

PLoS Genet 5(10): e1000695. doi:10.1371/journal.pgen.1000695

Inferring the Joint Demographic History of Multiple Populations from Multidimensional SNP Frequency Data

Ryan N. Gutenkunst, Ryan D. Hernandez, Scott H. Williamson, Carlos D. Bustamante

Abstract

Demographic models built from genetic data play important roles in illuminating prehistorical events and serving as null models in genome scans for selection. We introduce an inference method based on the joint frequency spectrum of genetic variants within and between populations. For candidate models we numerically compute the expected spectrum using a diffusion approximation to the one-locus, two-allele Wright-Fisher process, involving up to three simultaneous populations. Our approach is a composite likelihood scheme, since linkage between neutral loci alters the variance but not the expectation of the frequency spectrum. We thus use bootstraps incorporating linkage to estimate uncertainties for parameters and significance values for hypothesis tests. Our method can also incorporate selection on single sites, predicting the joint distribution of selected alleles among populations experiencing a bevy of evolutionary forces, including expansions, contractions, migrations, and admixture. We model human expansion out of Africa and the settlement of the New World, using 5 Mb of noncoding DNA resequenced in 68 individuals from 4 populations (YRI, CHB, CEU, and MXL) by the Environmental Genome Project. We infer divergence between West African and Eurasian populations 140 thousand years ago (95% confidence interval: 40–270 kya). This is earlier than other genetic studies, in part because we incorporate migration. We estimate the European (CEU) and East Asian (CHB) divergence time to be 23 kya (95% c.i.: 17–43 kya), long after archeological evidence places modern humans in Europe. Finally, we estimate divergence between East Asians (CHB) and Mexican-Americans (MXL) of 22 kya (95% c.i.: 16.3–26.9 kya), and our analysis yields no evidence for subsequent migration. Furthermore, combining our demographic model with a previously estimated distribution of selective effects among newly arising amino acid mutations accurately predicts the frequency spectrum of nonsynonymous variants across three continental populations (YRI, CHB, CEU).

Link

October 22, 2009

Facial contrast and attractiveness

This very interesting paper shows that there exists sexual dimorphism in facial contrast, with women having higher-contrast faces than males. By enhancing a face's contrast, it is made to appear more feminine, and thus (for women), more attractive. This empirical result demonstrates why women often enhance their appearance by applying makeup which increases the contrast of their eyes and mouth.

I only have one observation on the paper: it would be interesting to study the interplay between contrast and aspects of a face's geometry. Generally speaking there is sex dimorphism in lip geometry, with women having fuller lips. Lips that are too narrow or too full, however, are rated less attractive. By applying a dark shade on very narrow or very full lips, one may be emphasizing this unattractive trait and thus reducing the overall attractiveness of the face. It would be interesting to see whether increased contrast has positive effects across different facial geometries.

Another possible interplay might be between facial symmetry and contrast: enhanced contrast in an asymmetric face may bring into attention this asymmetry in a more pronounced way.

Finally it may be interesting to study the interplay of contrast with pigmentation traits: how does tracing the outline of the eyes affect attractiveness for light vs. dark eyes? How does pigmentation of the hair (which acts, as I have argued before, as a "frame" to the face, contrasting with lightness of skin), or conversely skin tanning combined with light hair, interplay with facial features?

Perception 2009 volume 38(8) pages 1211 – 1219doi:10.1068/p6331

A sex difference in facial contrast and its exaggeration by cosmetics

Richard Russell

Abstract. This study demonstrates the existence of a sex difference in facial contrast. By measuring carefully controlled photographic images, female faces were shown to have greater luminance contrast between the eyes, lips, and the surrounding skin than did male faces. This sex difference in facial contrast was found to influence the perception of facial gender. An androgynous face can be made to appear female by increasing the facial contrast, or to appear male by decreasing the facial contrast. Application of cosmetics was found to consistently increase facial contrast. Female faces wearing cosmetics had greater facial contrast than the same faces not wearing cosmetics. Female facial beauty is known to be closely linked to sex differences, with femininity considered attractive. These results suggest that cosmetics may function in part by exaggerating a sexually dimorphic attribute—facial contrast—to make the face appear more feminine and hence attractive.

October 21, 2009

European admixture on the Micronesian island of Kosrae

Kosrae has a population of about 7 thousand, so the finding that most of the European ancestry in this population can be traced to one 19th c. European individual, shows the reality of reproductive inequality I mentioned in a previous post.

European Journal of Human Genetics advance online publication 21 October 2009; doi: 10.1038/ejhg.2009.180

European admixture on the Micronesian island of Kosrae: lessons from complete genetic information

Penelope E Bonnen et al.

Abstract

The architecture of natural variation present in a contemporary population is a result of multiple population genetic forces, including population bottleneck and expansion, selection, drift, and admixture. We seek to untangle the contribution of admixture to genetic diversity on the Micronesian island of Kosrae. Toward this goal, we used a complete genetic approach by combining a dense genome-wide map of 100 000 single-nucleotide polymorphisms (SNPs) with data from uniparental markers from the mitochondrial genome and the nonrecombining portion of the Y chromosome. These markers were typed in 3200 individuals from Kosrae, representing 80% of the adult population of the island. We developed novel software that uses SNP data to delineate ancestry for individual segments of the genome. Through this analysis, we determined that 39% of Kosraens have some European ancestry. However, the vast majority of admixed individuals (77%) have European alleles spanning less than 10% of their genomes. Data from uniparental markers show most of this admixture to be male, introduced in the late nineteenth century. Furthermore, pedigree analysis shows that the majority of European admixture on Kosrae is because of the contribution of one individual. This approach shows the benefit of combining information from autosomal and uniparental polymorphisms and provides new methodology for determining ancestry in a population.

Link

October 20, 2009

Stature evolution in Andaman Islanders

A good related Wired News story on Why Pygmies are Small

CURRENT ANTHROPOLOGY Volume 50, Number 5, October 2009
DOI: 10.1086/605429

Stature, Mortality, and Life History among Indigenous Populations of the Andaman Islands, 1871–1986

J. T. Stock and A. B. Migliano

Despite considerable interest in the evolution of small body size, there is little evidence for changes in body size within small‐bodied human populations. This study combines anthropometric data from a number of studies of the body size of Andaman Islanders from 1871 to 1986. The colonial history of the Andaman Islands is characterized by high rates of mortality among the indigenous populations. However, long‐term conflicts between tribal groups of the Andaman Islands and British and Indian settlers led to some groups being relatively isolated and sheltered from infectious disease and the high rates of mortality that affected other groups. When temporal trends in stature are compared in this context, there is evidence for a reduction in stature among the Great Andamanese who had close contact with the British during the period of highest mortality. Adult stature among the Onge appears to have increased as government involvement diminished following Indian independence. The Jarawa, who had lower rates of mortality throughout the past century, have significantly higher stature than the other groups. These results are interpreted in the context of life‐history theory, adaptation, and plasticity. They provide the first long‐term diachronic evidence for a relationship between mortality and stature among small‐bodied humans.

Link

October 17, 2009

Pavlopetri: an underwater town in Laconia


World's oldest submerged town dates back 5,000 years
Archaeologists surveying the world's oldest submerged town have found ceramics dating back to the Final Neolithic. Their discovery suggests that Pavlopetri, off the southern Laconia coast of Greece, was occupied some 5,000 years ago — at least 1,200 years earlier than originally thought.

These remarkable findings have been made public by the Greek government after the start of a five year collaborative project involving the Ephorate of Underwater Antiquities of the Hellenic Ministry of Culture and The University of Nottingham.

As a Mycenaean town the site offers potential new insights into the workings of Mycenaean society. Pavlopetri has added importance as it was a maritime settlement from which the inhabitants coordinated local and long distance trade.

The Pavlopetri Underwater Archaeology Project aims to establish exactly when the site was occupied, what it was used for and through a systematic study of the geomorphology of the area, how the town became submerged.

This summer the team carried out a detailed digital underwater survey and study of the structural remains, which until this year were thought to belong to the Mycenaean period — around 1600 to 1000 BC. The survey surpassed all their expectations. Their investigations revealed another 150 square metres of new buildings as well as ceramics that suggest the site was occupied throughout the Bronze Age — from at least 2800 BC to 1100 BC.

The work is being carried out by a multidisciplinary team led by Mr Elias Spondylis, Ephorate of Underwater Antiquities of the Hellenic Ministry of Culture in Greece and Dr Jon Henderson, an underwater archaeologist from the Department of Archaeology at The University of Nottingham.

Dr Jon Henderson said: "This site is unique in that we have almost the complete town plan, the main streets and domestic buildings, courtyards, rock-cut tombs and what appear to be religious buildings, clearly visible on the seabed. Equally as a harbour settlement, the study of the archaeological material we have recovered will be extremely important in terms of revealing how maritime trade was conducted and managed in the Bronze Age."

Possibly one of the most important discoveries has been the identification of what could be a megaron — a large rectangular great hall — from the Early Bronze Age period. They have also found over 150 metres of new buildings including what could be the first example of a pillar crypt ever discovered on the Greek mainland. Two new stone built cist graves were also discovered alongside what appears to be a Middle Bronze Age pithos burial.

Mr Spondylis said: "It is a rare find and it is significant because as a submerged site it was never re-occupied and therefore represents a frozen moment of the past."

The Archaeological Co-ordinator Dr Chrysanthi Gallou a postdoctoral research fellow at The University of Nottingham is an expert in Aegean Prehistory and the archaeology of Laconia.

Dr Gallou said: "The new ceramic finds form a complete and exceptional corpus of pottery covering all sub-phases from the Final Neolithic period (mid 4th millennium BC) to the end of the Late Bronze Age (1100 BC). In addition, the interest from the local community in Laconia has been fantastic. The investigation at Pavlopetri offers a great opportunity for them to be actively involved in the preservation and management of the site, and subsequently for the cultural and touristic development of the wider region."

The team was joined by Dr Nicholas Flemming, a marine geo-archaeologist from the Institute of Oceanography at the University of Southampton, who discovered the site in 1967 and returned the following year with a team from Cambridge University to carry out the first ever survey of the submerged town. Using just snorkels and tape measures they produced a detail plan of the prehistoric town which consisted of at least 15 separate buildings, courtyards, streets, two chamber tombs and at least 37 cist graves. Despite the potential international importance of Pavlopetri no further work was carried out at the site until this year.

This year, through a British School of Archaeology in Athens permit, The Pavlopetri Underwater Archaeology Project began its five year study of the site with the aim of defining the history and development of Pavlopetri.

Four more fieldwork seasons are planned before their research is published in full in 2014.

Facial shape preference in heterosexual and homosexual people

The finding that homosexual men prize masculine males faces and homosexual women prize masculine female ones seems consistent with the idea that there is a different etiology for homosexuality in men and women. As I have argued before, homosexual men are feminized, hence their preference for masculine male faces is easily explained. Homosexual behavior in women, however, is usually the outcome of either psychological trauma or plainness-of-appearance, and hence homosexual women do retain a preference for masculine appearance which they transfer to their own gender.

Arch Sex Behav. 2009 Oct 15. [Epub ahead of print]

Sex-Dimorphic Face Shape Preference in Heterosexual and Homosexual Men and Women.

Glassenberg AN, Feinberg DR, Jones BC, Little AC, Debruine LM.

Studies have used manipulated faces to test the preferences of heterosexual individuals for sexually dimorphic facial cues. In contrast to previous studies, which have generally excluded homosexual participants, we directly compared homosexual and heterosexual male and female preferences for manipulated sexual dimorphism in faces (homosexual males: n = 311; heterosexual males: n = 215; homosexual females: n = 159; heterosexual females: n = 218). Prior studies on sexual orientation and preferences for faces that were paired with masculine and feminine behavioral descriptors suggest that homosexual men prefer more masculine men and that homosexual women demonstrate no preference for either masculinity or femininity in women. In our study, we tested for similarities and differences among heterosexual and homosexual males and females with regard to their preferences for a more specific aspect of faces: sexual dimorphism of face shape. Homosexual men demonstrated stronger preferences for masculinity in male faces than did all of the other groups. Homosexual women demonstrated stronger preferences for masculinity in female faces than did heterosexual women. These results suggest attractiveness judgments of same-sex faces made by homosexual individuals are not a mirror image of those made by heterosexual individuals of the opposite sex. Our data suggest that face preferences of homosexual individuals reflect a system of biologically and socially guided preferences at least as complex as those found among heterosexual individuals.

Link

October 16, 2009

The emergence and dispersal of haplogroup J-P58 (aka J1e)

The paper uses the evolutionary mutation rate, which, as I have argued elsewhere overestimates time to most recent ancestor (TMRCA) by about a factor of 3. The evolutionary mutation rate is appropriate for haplogroups subject to strong genetic drift that have not grown to large numbers, but it is completely inappropriate under conditions of strong population growth.

To make things concrete, according to the model of drift-induced variance reduction proposed by Zhivotovsky, Underhill, and Feldman (2006), in 10,000 years (or 400 generations), J-P58 should have grown to the grand number of 200 men, or at least five orders of magnitude lower than the actual present-day haplogroup size. To account for the observed J-P58 size of millions of men, strong growth over time is needed, and with either the Z.U.F. (2006) analysis or my own, strong growth results in an accumulation of variance at close to the germline mutation rate.

With that said, all ages in this paper should be divided by a factor of 3. This is not only theoretically sound, but harmonizes better with other lines of evidence.

The paper studies Y-STR variance in several Middle Eastern populations. The lack of samples from the Caucasus does not allow us to infer the levels of Y-STR variance in that region. Arabian J-P58 from Saudi Arabia, Qatar, and UAE are pooled, resulting in low mean Y-STR variance of 0.16. This low value stems primarily from Qatar and UAE as the Saudi Arabian J-P58 makes a very small contribution (4 examples) in the pooled sample.

Unfortunately the authors just missed the very recent paper on Arabian DNA by Abu-Amero et al., which shows that J-M267 variance is 0.27-0.29 in Yemen and Saudi Arabia, and much lower (0.16-0.19) in UAE and Qatar. This severely weakens the case for an expansion of J1 from the northern to the southern Levant, as it reveals that not only Oman and Yemen (mentioned in the paper), but also the geographically dominant Saudi Arabia is a region of high Y-STR diversity. Thus it is not the case that:
The timing and geographical distribution of J1e is representative of a demic expansion of agriculturalists and herder–hunters from thePre-Pottery Neolithic B to the late Neolithic era.24,26 The higher variances observed in Oman, Yemen and Ethiopia suggest either sampling variability and/or demographic complexity associated with multiple founders and multiple migrations.
But rather Oman, Yemen and Ethiopia are not atypical for the southern J1e range, which also includes Saudi Arabia as a region of high Y-STR variance. It is rather only the small gulf states of UAE and Qatar that have lower variance.

An interesting find, however, is the fact of high Y-STR variance (0.37, 0.43) in Alawites from Syria and Assyrians from Syria and Iraq. These populations have an impeccable Semitic historical record, and, in the case of the Assyrians are one of the few non-Arabic populations included in the study. It is also interesting that Assyrians are said to be derived from both Assyrian- and Aramaic-speaking ancestors, and hence to potentially have a complex (both East- and Northwest- Semitic) origin. These facts probably explain their high Y-STR variance.

Translated into non-"evolutionary" years, the expansion time of 16.2ky for Assyrians, becomes ~5.4ky. This age is in uncanny agreement with the recently estimate age of Semitic languages 5.75ky ago.

The authors of the current paper cite the above-mentioned linguistic work, but have trouble bridging the gap between their own "evolutionary" dates and the date for the breakup of Proto-Semitic:
A recent Bayesian analysis of Semitic languages supports an originin the Levant 5750 years ago and subsequent arrival in the Horn of Africa from Arabia 2800 years ago,11 thus providing an indirect support of our phylogenetic clock estimates. It is important to note that the glottochronological dates yield estimates for the break-up and expansion of the Proto-Semitic language. Proto-Semitic, itself, may have been spoken in a localized linguistic community for millennia before its bifurcation into the East and West Semitic branches.
If one rejects the "evolutionary" rate, there is no need to postulate that Proto-Semitic was spoken (but did not disperse) for millennia; indeed, a "static" Proto-Semitic/J-P58 community would be difficult to explain in view of the fact that mobile herding was their main economic activity. In my view, The J-P58 bearing Proto-Semites emerge in the 4th millennium BC out of a general J1 Middle Eastern background, just as their TMRCA suggests. They begin to expand at that time, and emerge in the historical record 1-2 thousand years later in both their Eastern (Akkadian) and, later, Western (Aramaic and Canaanite) forms.

The authors also cite their own work with respect to the correlation of J1 distribution with semi-arid environments in the Middle East and cite evidence to the effect that:
archeological studies have shown an early presence (ca. 6000–7000 BCE) of domesticated herding in the arid steppe desert regions
The presence of a large frequency of undifferentiated J*(xJ1, J2) chromosomes in Soqotra suggests that the Arabian peninsula possessed such chromosomes, which now have a marginal status throughout the Middle East. I propose that a the early steppe desert herders of 6000-7000BC possessed J* chromosomes, that J1 arose in the Middle East, and its subclade J-P58 experienced rapid growth associated with the breakup and expansion of Semitic languages in the 4th millennium BC.

In conclusion: this paper gives us important new data on the origin and expansion of Y-chromosome J-P58, and strengthens the case that this haplogroup may be a diagnostic marker of the Proto-Semitic population of the Near East.

Related:

European Journal of Human Genetics doi: 10.1038/ejhg.2009.166

The emergence of Y-chromosome haplogroup J1e among Arabic-speaking populations

Jacques Chiaroni et al.

Abstract

Haplogroup J1 is a prevalent Y-chromosome lineage within the Near East. We report the frequency and YSTR diversity data for its major sub-clade (J1e). The overall expansion time estimated from 453 chromosomes is 10 000 years. Moreover, the previously described J1 (DYS388=13) chromosomes, frequently found in the Caucasus and eastern Anatolian populations, were ancestral to J1e and displayed an expansion time of 9000 years. For J1e, the Zagros/Taurus mountain region displays the highest haplotype diversity, although the J1e frequency increases toward the peripheral Arabian Peninsula. The southerly pattern of decreasing expansion time estimates is consistent with the serial drift and founder effect processes. The first such migration is predicted to have occurred at the onset of the Neolithic, and accordingly J1e parallels the establishment of rain-fed agriculture and semi-nomadic herders throughout the Fertile Crescent. Subsequently, J1e lineages might have been involved in episodes of the expansion of pastoralists into arid habitats coinciding with the spread of Arabic and other Semitic-speaking populations.

Link

October 13, 2009

Migrationism strikes back

In 1939, Carleton Coon wrote the Races of Europe. In it, he used the "skulls and pots as migrations" paradigm of his times, to infer a number of Neolithic and post-Neolithic migrations into Europe. A map from the chapter on the Neolithic Invasions captures his conception of prehistory well:


This map was drawn before carbon dating had been invented. We now know much more about both the anthropology and archaeology of Europe. But, the main thrust of Coon's prehistorical narrative can be summarizes as arrows on a map, or, prehistory as a series of invasions. The closing paragraph from the Neolithic Invasions chapter sums up this view admirably:
Five invasions, then, converging on Europe from the south and east, brought a new population to Europe during the third millennium B.C., and furnished the racial material from which living European populations are to a large extent descended.
Today, carbon dating has pushed the arrival of the Neolithic to Europe into the 7th millennium BC, but, disregarding that detail, we can see that Coon thought that modern Europeans are primarily descended from Neolithic and post-Neolithic populations: farmers, seafarers and pastoralists from the south and east.

He did think that the Upper Paleolithic population had not disappeared completely, but the name he often used to describe them was survivors, which denoted quite clearly their limited contribution to the present-day population.

Acculturation & Demic Diffusion

After WWII, the arrows on a map paradigm was no longer in fashion. The transition from the old to the new prehistory did not happen overnight, but two new intellectual fashions gained ground: acculturation and demic diffusion.

The proponents of acculturation were motivated by a reaction to the pots and skulls paradigm. To the idea that the spread of a new pottery type, or a new type of skull morphology indicated the spread of a people across the map, they countered that (i) pottery could be exchanged, copied, and traded without the movement of people, and (ii) that conclusions based on typological old-style anthropology were unsupportable, and the limitless malleability of the human skull was affirmed.

In some respects, the acculturation hypothesis represented a valid response to the excesses of the pots and skulls tradition. But, they went a bit too far in presenting a picture of complete stasis, in which European people, seemingly fixed to the ground, participated only in "networks of exchange", only ideas and goods flowed, and all differences in physical type across long time spans were ascribed invariably to responses (genetic or plastic) to new technologies, but almost never to the introduction of a new population element.

Demic diffusion is not as extreme as the pure acculturation hypothesis, but it replaces the model of invasions and migrations represented by arrows with a purposeless random walk. Demic diffusion has been argued on both archaeological and genetic grounds.
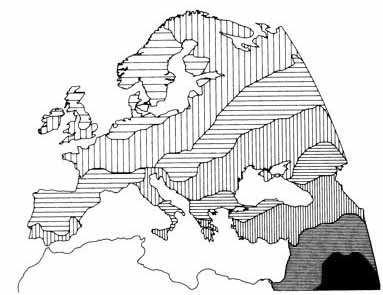
When Cavalli-Sforza and colleagues collected genetic data on modern Europeans, and subjected them to principal components' analysis made possible by modern computers, they discovered that the first principal component of genetic variation was oriented on a southeast-northwest axis.

At roughly the same time, the widespread dating of Neolithic sites across Europe proved that there was a fairly regular advent of farming, with the earlier sites found in Greece, and the latest ones in the Atlantic fringe and northern Europe.

Demic diffusion was summoned to explain these phenomena. Neolithic farmers, the story goes, did not particularly want to colonize Europe. Europe was colonized as a side-effect of a random process in which farmers moved away from their parent's home, while their population numbers grew due to the increased productivity of the farming economy.

The process was not seen as one of population replacement, however. Rather, it was seen as a slow movement of a wave of advance, in which farmers mixed with hunter-gatherers, and some of them moved on to populate new lands beyond the farmer-hunter frontier. The model predicted that the technology would spread without large-scale population replacement, as the hunters' genes would make a substantial contribution to farmers' gene pools at the furthest end of their expansion.

The Paleolithic Europeans make a comeback

Bryan Sykes' The Seven Daughters of Eve was a popular treatment of a new wave of acculturation-minded scholarship whose more formal expression was the masterful Tracing European Founder Lineages in the Near Eastern mtDNA Pool by Martin Richards et al.

Whereas Cavalli-Sforza and his colleagues had looked at dozens of polymorphisms, their synthetic PC maps of Europe didn't come with dates or easy explanations. The observed clines in Europe may have been due to Paleolithic, Neolithic, or even recent historical events. While they were consistent with the Neolithic demic diffusion hypothesis, the possibility existed that they may have been formed either earlier, or later than the Neolithic.

The new approach by Sykes, Richards, and their colleagues, looked at just mtDNA, but due to its being inherited from mother to daughter without recombination, they could (i) estimate the age of the common ancestors of the "European mothers", (ii) study the patterns of geographical distribution of their descendants to infer when and where they may have lived. Hence, the various stories about Katrine, Ulrike, Helena, etc. in Sykes's book.

The conclusions of the new methodology were clear (at least to the authors' satisfaction):
This robustness to differing criteria for the exclusion of back-migration and recurrent mutation suggests that the Neolithic contribution to the extant mtDNA pool is probably on the order of 10%–20% overall. Our regional analyses support this, with values of 20% for southeastern, central, northwestern, and northeastern Europe. The principal clusters involved seem to have been most of J, T1, and U3, with a possible H component. This would suggest that the early-Neolithic LBK expansions through central Europe did indeed include a substantial demic component, as has been proposed both by archaeologists and by geneticists (Ammerman and Cavalli-Sforza 1984; Sokal et al. Sokal et al., 1991 RR Sokal, NL Ogden and C Wilson, Genetic evidence for the spread of agriculture in Europe by demic diffusion, Nature 351 (1991), pp. 143–144.1991). Incoming lineages, at least on the maternal side, were nevertheless in the minority, in comparison with indigenous Mesolithic lineages whose bearers adopted the new way of life.

The picture of continuity since the Paleolithic was further supported in the much briefer article by Semino et al. (pdf) on The genetic legacy of Paleolithic Homo sapiens sapiens in extant Europeans: a Y chromosome perspective. This study, based mostly on the observation of rough congruences of the European map with some Y-chromosome markers set the stage for most Y-chromosome work in Europe for the next decade.

In today's terminology, this paper suggested that, like mtDNA, most European Y-chromosomes were Paleolithic in origin, and belonged in haplogroups R1b, R1a, and I which repopulated Europe from refugia in Iberia, the Ukraine, and the Balkans, after the last glaciation. To this set were added Neolithic immigrants from the Middle East bearing haplogroups J, G, and E1b1b, and Northern Asian immigrants from the east bearing haplogroup N1c.

Unfortunately, we do not have Y-chromosome data of Paleolithic age to determine the veracity of this scenario. Given present-day distributions, we can be fairly certain of a European origin (but when?) of haplogroup I, of a non-European origin of haplogroup E1b1b (via North Africa or the Middle East), and of N1c. A non-European origin of the entire haplogroups J and G in West Asia also seems quite probable.

The house of cards collapses

The beauty of science is that new data can always falsify cozy and plausible scientific theories. In the case of European prehistory, this occurred due to a combination of craniometric, archaeological, and mtDNA data.

Pinhasi and von Cramon-Taubadel (2009) examined skulls from the early Central European Neolithic (Linearbandkeramik) and found them to be closer to Neolithic skulls from Balkans and West Asia, rather than the per-farming Mesolithic populations.
Our results demonstrate that the craniometric data fit a model of continuous dispersal of people (and their genes) from Southwest Asia to Europe significantly better than a null model of cultural diffusion.
The authors correctly identified their data as rejecting cultural diffusion, but their conclusion that they supported demic diffusion was not warranted as there was really no evidence that Neolithic groups were "transformed" by gradual slow admixture with hunter-gatherers in their march into Europe. Their data could just as easily be explained by plain migration.

Archaeologists also made a strong case for a rapid diffusion of the Neolithic in the Mediterranean. Neolithic settlements appeared suddenly, fully-formed, occupied regions abandoned by Mesolithic peoples, and spread not slowly, in a wave of advance, but rapidly, as a full-fledged colonization:
Thus it appears that none of the earlier models for Neolithic emergence in the Mediterranean accurately or adequately frame the transition. Clearly there was a movement of people westward out of the Near East all of the way to the Atlantic shores of the Iberian Peninsula. But this demic expansion did not follow the slow and steady, all encompassing pace of expansion predicted by the wave and advance model. Instead the rate of dispersal varied, with Neolithic colonists taking 2,000 years tomove from Cyprus to the Aegean, another 500 to reach Italy, and then only 500–600 years to travel the much greater distance from Italy to the Atlantic (52).
In a different study Vanmontfort et al. studied the geographical distribution of farmers and hunter-gatherers during first contact in Central Europe. This contact did not involve either adoption of farming by hunter-gatherers (as in the acculturation hypothesis), or admixture with hunter-gatherers (as in the demic diffusion/wave of advance model). Rather, agriculturalists and hunter-gatherers tended to avoid each other for 1,000 years after first contact!
To conclude, the following model can be put forward. During the 6th Millennium cal BC, major parts of the loess region are exploited by a low density of hunter–gatherers. The LBK communities settle at arrival in locations fitting their preferred physical characteristics, but void of hunter–gatherer activity. Evidently, multiple processes and contact situations may have occurred simultaneously, but in general the arrival of the LBK did not attract hunter–gatherer hunting activity. Their presence rather restrained native activity to regions located farther away from the newly constructed settlements or triggered fundamental changes in the socio-economic organisation and activity of local hunter–gatherers. Evidence for the subsequent step in the transition dates to approximately one millennium later (Crombé and Vanmontfort, 2007; Vanmontfort, 2007).
The "Paleolithic" case won a short-lived victory when Haak et al tested mtDNA from early Central European farmers, discovering that they had a high frequency of haplogroup N1a which is rare in modern Europeans. This finding was interpreted as evidence that the incoming Neolithic farmers were few in numbers and were absorbed with barely a trace by the surrounding Mesolithic populations who adopted agriculture. Acculturation seemed to have won the day! The case was, however, tentative, and hinged on the assumption that the Paleolithic Europeans -who had not been tested yet- would have a gene pool similar to that of modern Europeans.

When hunter-gatherer mtDNA was tested in both Scandinavia (by Malmström et al) and Central/Eastern Europe (by Bramanti et al.), it turned out that continuity from the Paleolithic was rejected. Hunter-gatherers were dominated by mtDNA haplogroup U, and subgroups U4/U5 in particular. None of the other lineages postulated by Sykes et al. as being "Paleolithic" in origin were found in them. Moreover, there was substantial temporal overlap between hunter-gatherer and farmer cultures, but farmers seemed to lack mtDNA typical of hunter-gatherers and vice versa. Confirming the archaeological picture of the two groups avoiding each other, it now seemed that there was little genetic contact between the two, at least in the early age. The Neolithic spread by newcomers; there was no acculturation of Mesolithic people; there was no slow process of admixture between farmer and hunter along a wave of advance.

The gap between contemporaneous farmer and hunter mtDNA gene pools was as large as that found between modern Europeans and native Australians! The whole controversy about the relative contributions of the Neolithic and Paleolithic in the modern European gene pool was found to be beside the point. The modern European gene pool did not seem to be particularly similar to either Paleolithic hunter or Neolithic farmer: it possessed any haplogroups completely absent in pre-Neolithic Europe. And, it did not have a high frequency of the N1a "signature" haplogroup of the Neolithic. Selection, migration, or a combination of both had reshaped the European gene pool from the Neolithic onwards.

Where things stand

We have come full circle. Once again, Paleolithic Europeans assume the status of survivors, as their typical lineages are observed in a small minority of modern Europeans. The evidence for widespread acculturation of European hunter-gatherers or their significant genetic contribution to incoming farmers along a wave of advance is just not there. Hunters and farmers possessed distinctive gene pools, and farmers expanded with barely a trace of absorption of hunter gene pools.

Clearly many details remain to be filled out. What does seem certain, however, is that dramatic events took place starting at the Neolithic, and that modern Europeans trace their ancestry principally to Neolithic and post-Neolithic migrants, and not to the post-glacial foragers who inhabited the continent.

Phylogeny of mtDNA haplogroup M in India (Chandrasekar et al. 2009)

PLoS ONE doi:10.1371/journal.pone.0007447

Updating Phylogeny of Mitochondrial DNA Macrohaplogroup M in India: Dispersal of Modern Human in South Asian Corridor

Adimoolam Chandrasekar et al.

Abstract

To construct maternal phylogeny and prehistoric dispersals of modern human being in the Indian sub continent, a diverse subset of 641 complete mitochondrial DNA (mtDNA) genomes belonging to macrohaplogroup M was chosen from a total collection of 2,783 control-region sequences, sampled from 26 selected tribal populations of India. On the basis of complete mtDNA sequencing, we identified 12 new haplogroups - M53 to M64; redefined/ascertained and characterized haplogroups M2, M3, M4, M5, M6, M8′C′Z, M9, M10, M11, M12-G, D, M18, M30, M33, M35, M37, M38, M39, M40, M41, M43, M45 and M49, which were previously described by control and/or coding-region polymorphisms. Our results indicate that the mtDNA lineages reported in the present study (except East Asian lineages M8′C′Z, M9, M10, M11, M12-G, D ) are restricted to Indian region.The deep rooted lineages of macrohaplogroup ‘M’ suggest in-situ origin of these haplogroups in India. Most of these deep rooting lineages are represented by multiple ethnic/linguist groups of India. Hierarchical analysis of molecular variation (AMOVA) shows substantial subdivisions among the tribes of India (FST = 0.16164). The current Indian mtDNA gene pool was shaped by the initial settlers and was galvanized by minor events of gene flow from the east and west to the restricted zones. Northeast Indian mtDNA pool harbors region specific lineages, other Indian lineages and East Asian lineages. We also suggest the establishment of an East Asian gene in North East India through admixture rather than replacement.

Link

October 12, 2009

Y-chromosome demographic history (Shi et al. 2009)

Just a quick heads up on this open access paper which seems very important in that it tests a very large number of Y-STR markers on a well-known dataset, and proposes a new recalibration of the "evolutionary mutation rate" that I have criticized elsewhere. I will have to read the paper carefully before passing judgment (Look in this space for updates).

UPDATE (Oct 13):

The paper adds nothing to the issue of the appropriate mutation rate choice for TMRCA estimation. The revised Evolutionary Mutation Rates (rEMR) proposed in this paper are nothing more than an application of the Zhivotovsky et al. (Z. et al.) Evolutionary Mutation Rate (EMR) for markers not included in the original calibration by Z. et al. and exhibiting either higher or lower variance than those that are included. The use of a Z. et al.-like calibration is taken uncritically for granted.

Furthermore, the authors use BATWING to generate genealogies in order to infer TMRCA of lineages and populations, employing their rEMR for this purpose. This is wrong because both the "evolutionary mutation rate" and BATWING take into account genealogy. By using rEMR in conjunction with BATWING they are correcting for loss of Y-STR diversity due to genetic drift twice. This mistake was also done in another paper this Spring. I wrote:
Indeed, in this paper they attempt to use Batwing to estimate ages using the effective rate. Batwing employs a Bayesian method with coalescent simulations, and thus takes into account "population history", the effects of which are supposedly encapsulated in the effective mutation rate. Thus, they are "correcting" (inappropriately of course) for population history twice.
In conclusion: the age estimates provided in this paper (which can be found in Supplementary Table S4) are useless. The paper is, nonetheless, useful, because it shows the relative ages of many haplogroups, even though the small sample sizes for many of them do not inspire confidence in their accuracy.

UPDATE II: The paper also completely ignores admixture as a source of genetic diversity.

Molecular Biology and Evolution, doi:10.1093/molbev/msp243

A worldwide survey of human male demographic history based on Y-SNP and Y-STR data from the HGDP-CEPH populations

Wentao Shi et al.

Abstract

We have investigated human male demographic history using 590 males from 51 populations in the HGDP-CEPH worldwide panel, typed with 37 Y-SNPs and 65 Y-STRs, and analyzed with the program BATWING. The general patterns we observe show a gradient from the oldest population TMRCAs and expansion times together with the largest effective population sizes in Africa, to the youngest times and smallest effective population sizes in the Americas. These parameters are significantly negatively correlated with distance from East Africa and the patterns are consistent with most other studies of human variation and history. In contrast, growth rate showed a weaker correlation in the opposite direction. Y lineage diversity and TMRCA also decrease with distance from East Africa, supporting a model of expansion with serial founder events starting from this source. A number of individual populations diverge from these general patterns, including previously-documented examples such as recent expansions of the Yoruba in Africa, Basques in Europe and Yakut in Northern Asia. However, some unexpected demographic histories were also found, including low growth rates in the Hazara and Kalash from Pakistan, and recent expansion of the Mozabites in North Africa.

Link