This paper first came out last July on the arXiv and went through four versions there before its final form which has now appeared in PLoS Biology. It's great that its early release allowed other people to read it without having to wait for the completion of the peer review process.
I think that this is a good model: journals have the right and obligation to subject papers to close scrutiny according to their own procedures, but this process ought not interfere with the early availability of research results or the ability of anyone other than the chosen reviewers to comment on new results.
PLoS Biol 11(5): e1001555. doi:10.1371/journal.pbio.1001555
The Geography of Recent Genetic Ancestry across Europe
Peter Ralph, Graham Coop
The recent genealogical history of human populations is a complex mosaic formed by individual migration, large-scale population movements, and other demographic events. Population genomics datasets can provide a window into this recent history, as rare traces of recent shared genetic ancestry are detectable due to long segments of shared genomic material. We make use of genomic data for 2,257 Europeans (in the Population Reference Sample [POPRES] dataset) to conduct one of the first surveys of recent genealogical ancestry over the past 3,000 years at a continental scale. We detected 1.9 million shared long genomic segments, and used the lengths of these to infer the distribution of shared ancestors across time and geography. We find that a pair of modern Europeans living in neighboring populations share around 2–12 genetic common ancestors from the last 1,500 years, and upwards of 100 genetic ancestors from the previous 1,000 years. These numbers drop off exponentially with geographic distance, but since these genetic ancestors are a tiny fraction of common genealogical ancestors, individuals from opposite ends of Europe are still expected to share millions of common genealogical ancestors over the last 1,000 years. There is also substantial regional variation in the number of shared genetic ancestors. For example, there are especially high numbers of common ancestors shared between many eastern populations that date roughly to the migration period (which includes the Slavic and Hunnic expansions into that region). Some of the lowest levels of common ancestry are seen in the Italian and Iberian peninsulas, which may indicate different effects of historical population expansions in these areas and/or more stably structured populations. Population genomic datasets have considerable power to uncover recent demographic history, and will allow a much fuller picture of the close genealogical kinship of individuals across the world.
Link

Showing posts with label fastIBD. Show all posts
Showing posts with label fastIBD. Show all posts
March 28, 2013
Refined IBD in Beagle 4
The Beagle page doesn't show version 4 yet, but I'm sure it will eventually turn up there since this paper has just been published.
Genetics doi: 10.1534/genetics.113.150029
Improving the Accuracy and Efficiency of Identity by Descent Detection in Population Data
Brian L. Browning and Sharon R. Browning
Segments of identity by descent (IBD) detected from high-density genetic data are useful for many applications, including long-range phase determination, phasing family data, imputation, IBD mapping and heritability analysis in founder populations. We present Refined IBD, a new method for IBD segment detection. Refined IBD achieves both computational efficiency and highly accurate IBD segment reporting by searching for IBD in two steps. The first step (identification) uses the GERMLINE algorithm to find shared haplotypes exceeding a length threshold. The second step (refinement), evaluates candidate segments with a probabilistic approach to assess the evidence for IBD. Like GERMLINE, Refined IBD allows for IBD reporting on a haplotype level, which facilitates determination of multi-individual IBD and allows for haplotype-based downstream analyses. To investigate the properties of Refined IBD, we simulate SNP data from a model with recent super-exponential population growth that is designed to match UK data. The simulation results show that Refined IBD achieves a better power/accuracy profile than fastIBD or GERMLINE. We find that a single run of Refined IBD achieves greater power than 10 runs of fastIBD. We also apply Refined IBD to SNP data for samples from the UK and from Northern Finland, and describe the IBD sharing in these data sets. Refined IBD is powerful, highly accurate, easy to use, and is implemented in Beagle version 4.
Link
Genetics doi: 10.1534/genetics.113.150029
Improving the Accuracy and Efficiency of Identity by Descent Detection in Population Data
Brian L. Browning and Sharon R. Browning
Segments of identity by descent (IBD) detected from high-density genetic data are useful for many applications, including long-range phase determination, phasing family data, imputation, IBD mapping and heritability analysis in founder populations. We present Refined IBD, a new method for IBD segment detection. Refined IBD achieves both computational efficiency and highly accurate IBD segment reporting by searching for IBD in two steps. The first step (identification) uses the GERMLINE algorithm to find shared haplotypes exceeding a length threshold. The second step (refinement), evaluates candidate segments with a probabilistic approach to assess the evidence for IBD. Like GERMLINE, Refined IBD allows for IBD reporting on a haplotype level, which facilitates determination of multi-individual IBD and allows for haplotype-based downstream analyses. To investigate the properties of Refined IBD, we simulate SNP data from a model with recent super-exponential population growth that is designed to match UK data. The simulation results show that Refined IBD achieves a better power/accuracy profile than fastIBD or GERMLINE. We find that a single run of Refined IBD achieves greater power than 10 runs of fastIBD. We also apply Refined IBD to SNP data for samples from the UK and from Northern Finland, and describe the IBD sharing in these data sets. Refined IBD is powerful, highly accurate, easy to use, and is implemented in Beagle version 4.
Link
December 13, 2012
Daniel MacArthur's chromosome 10
In a previous post I confirmed Razib's observation on the South Asian ancestry of part of Dan MacArthur's chromosome 10. Razib has a new post up in which he argues that this type of ancestry is not of Romani origin. I figured it was my turn to continue the series of gratis ancestry analysis, with two goals in mind: (i) to let people know that if you put your genome online, you may find interesting things about it, and (ii) to indeed figure out what is going on with this interesting case of unexpected admixture.


I used Beagle/fastIBD with default parameters and with the HapMap recombination map to figure out the mean IBD sharing between Dan's chr10 and a number of different populations, including most of my available South Asian references. I also included YRI as an appropriate outgroup, as well as CEU30 and the 1000 Genomes British populations, given that Dr. MacArthur is Australian and has a Scottish surname, so it's a good bet that he has plenty of British-type ancestry.
The mean chr10 sharing is plotted below:

Now, it's cool that the top-2 matches are Argyll and Orkney, both of which are part of Scotland. But, what is interesting, is that North_Kannadi squeezes in ahead of CEU, with a very respectable mean of 1.4cM, and a number of other Indian populations are not far behind, while most of the ones from Pakistan are not. I'd say this looks consistent with an "Indian" origin of this type of ancestry.
A useful control is to repeat this experiment with a different chromosome, the similar-sized chr9 which lacks evidence for South Asian ancestry:

It is now visually clear that the difference between the British populations and the South Asian ones is greatly diminished. And, while the North Kannadi were near the top of the order for chr10, they are near the bottom for chr9, even lower than the YRI outgroup at the "noise left end" of the spectrum. Even the highest ranked South Asian population has about 1/3 estimated IBD sharing as the British ones.
Moreover, whereas in chr10 the top-ranked South Asian populations were often from the south, in chr9 the situation is reversed, with most of the top-ranked ones being from Pakistan. Again, this suggests that there is no real South Asian admixture here, but just some low-level sharing with the (more West Eurasian) populations of the northern part of South Asia.
So, to make a long story short, it does look to me like an excellent suggestion that there is some type of peninsular or even south Indian ancestry in the chr10 in question.
August 12, 2012
August 08, 2012
fastIBD analysis of several Jewish and non-Jewish groups
This is more of a "just the data" kind of post, inspired by the two recent papers on Jewish origins. A few quick points:
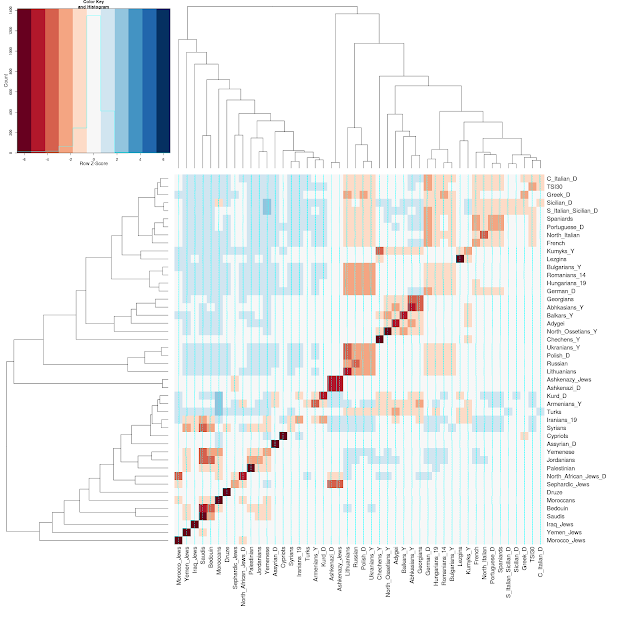
And, here are a couple of the visualizations for a few Jewish populations:


 Note that all sources of data are listed on the bottom left of the Dodecad blog.
- fastIBD was run with default parameters over a dataset of 512 individuals/264,539 SNPs
- fastIBD identifies segments of relatively recent origin that are shared by individuals. These results should not be construed as measures of overall genetic similarity or origins. Rather, they suggest which populations have exchanged genes in the relative recent past, say, the last two thousand years or so.
- I included all Ashkenazi_D and North_African_Jews_D samples; of the other Dodecad and reference populations, I took random samples of 10 each; running time of fastIBD increases with the square of the number of individuals, so doing this allowed me to run this in less than a day as opposed to about a week.
- Spreadsheet of numeric results, showing sharing (in centi-Morgans, cM)
- Population-level graphical results, showing an ordering of other populations based on mean IBD sharing.

And, here are a couple of the visualizations for a few Jewish populations:


August 07, 2012
Origins of North African and Central/East European Jews
A couple of new papers appeared yesterday. I'll just post the abstracts for the time being, and add any further comments as an update when I find the time for them.
Some related analyses of mine:
Below is Fig. 3 from Campbell et al.:

One can see that Jewish groups have high degree of intra-population IBD sharing (A); many of the highest levels of IBD sharing is between Jewish groups (B and C).
This paper definitely shows that Jewish groups differ from non-Jewish North Africans. But, the lack of comparative samples from non-Jewish non-North Africans makes the interpretation of this result difficult. Both the PCA analysis, shown below, and the structure analysis indicates a significant Sub-Saharan component in North African non-Jewish populations.

So, it seems, based on these results, that Jewish groups are differentiated from North Africans due to their general lack of sub-Saharan admixture, and they also show a variable degree of affiliation to European groups; however, by "European" groups we go only as far as north Italy and Sardinia. What of the relationships of different Jewish groups to people from southern Italy, Greece, Anatolia, the Caucasus, or even Iranian speakers of the Near East?
 Now, let's go to the Elhaik paper, which investigates a different problem altogether, trying to distinguish between the "Rhineland" and "Khazarian" hypotheses for the origins of Central-East European Jews. According to the paper:

 The IBD sharing is probably the strongest piece of evidence in this paper for a Caucasian connection. Excess of IBD sharing with Caucasus and Palestinians relative to the other populations may indeed be a good indication of such admixture. On the other hand, the Khazarian Empire was primarily located in eastern Europe and the North Caucasus, not in Armenia and Georgia. Also, this analysis rejects the Greco-Roman hypothesis (whereby European Jews underwent admixture in Greco-Roman times when they were part of the Hellenistic and Roman Empires), but does not really include any Greco-Roman populations (for example, from Greece and Italy).
On the other hand, there may be something to the Khazar story (but in the sense of admixture, rather than replacement). High IBD sharing with Caucasians is one such piece of evidence. Another is the presence of Y-haplogroup Q and R-Z93+, both of which could in principle track a Central Asian Turkic influence (although Z93 could also track an Iranian influence). Then, there is the limited but persistent evidence for a little East Eurasian admixture present in Ashkenazi Jews and not in Sephardic Jews, which might also be consistent with a little Turkic influence.
Overall, I am convinced that most modern Jewish groups have some variable old Near Eastern Jewish ancestry, primarily on the basis of the elevated "Southwest Asian" that seems to correlate reasonably well with groups of Semitic speakers. But, it is difficult to say "how much" and to identify all the potential sources of admixture. Jews have been an international people for quite a long time, so I would guess that fragments of different peoples they encountered may remain in their genomes. Perhaps something akin to Ralph and Coop (2012) may give more information about the timing of these admixture events, as well as the date of the common ancestry of different Jewish groups.
PS: I started a small fastIBD analysis of different Jewish and non-Jewish groups with a fairly large assortment of populations, and will probably post it here in the next few days.
PNAS doi: 10.1073/pnas.1204840109
North African Jewish and non-Jewish populations form distinctive, orthogonal clusters
Christopher L. Campbell et al.
North African Jews constitute the second largest Jewish Diaspora group. However, their relatedness to each other; to European, Middle Eastern, and other Jewish Diaspora groups; and to their former North African non-Jewish neighbors has not been well defined. Here, genome-wide analysis of five North African Jewish groups (Moroccan, Algerian, Tunisian, Djerban, and Libyan) and comparison with other Jewish and non-Jewish groups demonstrated distinctive North African Jewish population clusters with proximity to other Jewish populations and variable degrees of Middle Eastern, European, and North African admixture. Two major subgroups were identified by principal component, neighbor joining tree, and identity-by-descent analysis—Moroccan/Algerian and Djerban/Libyan—that varied in their degree of European admixture. These populations showed a high degree of endogamy and were part of a larger Ashkenazi and Sephardic Jewish group. By principal component analysis, these North African groups were orthogonal to contemporary populations from North and South Morocco, Western Sahara, Tunisia, Libya, and Egypt. Thus, this study is compatible with the history of North African Jews—founding during Classical Antiquity with proselytism of local populations, followed by genetic isolation with the rise of Christianity and then Islam, and admixture following the emigration of Sephardic Jews during the Inquisition.
Link
arXiv:1208.1092v1 [q-bio.PE]
The Missing Link of Jewish European Ancestry: Contrasting the Rhineland and the Khazarian Hypotheses
Eran Elhaik
The question of Jewish ancestry has been the subject of controversy for over two centuries and has yet to be resolved. The "Rhineland Hypothesis" proposes that Eastern European Jews emerged from a small group of German Jews who migrated eastward and expanded rapidly. Alternatively, the "Khazarian Hypothesis" suggests that Eastern European descended from Judean tribes who joined the Khazars, an amalgam of Turkic clans that settled the Caucasus in the early centuries CE and converted to Judaism in the 8th century. The Judaized Empire was continuously reinforced with Mesopotamian and Greco-Roman Jews until the 13th century. Following the collapse of their empire, the Judeo-Khazars fled to Eastern Europe. The rise of European Jewry is therefore explained by the contribution of the Judeo-Khazars. Thus far, however, their contribution has been estimated only empirically; the absence of genome-wide data from Caucasus populations precluded testing the Khazarian Hypothesis. Recent sequencing of modern Caucasus populations prompted us to revisit the Khazarian Hypothesis and compare it with the Rhineland Hypothesis. We applied a wide range of population genetic analyses - including principal component, biogeographical origin, admixture, identity by descent, allele sharing distance, and uniparental analyses - to compare these two hypotheses. Our findings support the Khazarian Hypothesis and portray the European Jewish genome as a mosaic of Caucasus, European, and Semitic ancestries, thereby consolidating previous contradictory reports of Jewish ancestry.
Link
Some related analyses of mine:
- fastIBD analysis of Afroasiatic groups (Jews, Arabs, Assyrians, Berbers, Somalis, Amharas, etc.)
- fastIBD analysis of Iberia, France, Italy, Balkans, Anatolia and European Jews
- Admixture proportions for various populations (incl. various Jewish groups)
Below is Fig. 3 from Campbell et al.:

One can see that Jewish groups have high degree of intra-population IBD sharing (A); many of the highest levels of IBD sharing is between Jewish groups (B and C).
This paper definitely shows that Jewish groups differ from non-Jewish North Africans. But, the lack of comparative samples from non-Jewish non-North Africans makes the interpretation of this result difficult. Both the PCA analysis, shown below, and the structure analysis indicates a significant Sub-Saharan component in North African non-Jewish populations.

So, it seems, based on these results, that Jewish groups are differentiated from North Africans due to their general lack of sub-Saharan admixture, and they also show a variable degree of affiliation to European groups; however, by "European" groups we go only as far as north Italy and Sardinia. What of the relationships of different Jewish groups to people from southern Italy, Greece, Anatolia, the Caucasus, or even Iranian speakers of the Near East?


Admixture calculations were carried out using a supervised learning approach in a structure-like analysis. This approach has many advantages over the unsupervised approach that not only traces ancestry to K abstract unmixed populations under the assumption that they evolved independently (Chakravarti 2009; Weiss and Long 2009) but also problematic when applied to study Jewish ancestry, which can be dated as far back as 3,000 years (Figure 2). Admixture was calculated with a reference set of seven populations representing genetically distinct regions: Pygmies (Africa), French Basque (West Europe), Chuvash (East Europe), Han Chinese (Asia), Palestinians (Middle East), Turk-Iranians (Near East), and Armenians (Caucasus) (Figure 5).But, Palestinians too have African admixture, so using them as a parental population conflates two separate issues: their old Near Eastern Semitic ancestors which could be reasonably inferred to be somewhat related to the Semitic ancestors of Jews, and their recent African admixture. Similarly, Turks have east Eurasian admixture, and Iranians have South Asian admixture.

On the other hand, there may be something to the Khazar story (but in the sense of admixture, rather than replacement). High IBD sharing with Caucasians is one such piece of evidence. Another is the presence of Y-haplogroup Q and R-Z93+, both of which could in principle track a Central Asian Turkic influence (although Z93 could also track an Iranian influence). Then, there is the limited but persistent evidence for a little East Eurasian admixture present in Ashkenazi Jews and not in Sephardic Jews, which might also be consistent with a little Turkic influence.
Overall, I am convinced that most modern Jewish groups have some variable old Near Eastern Jewish ancestry, primarily on the basis of the elevated "Southwest Asian" that seems to correlate reasonably well with groups of Semitic speakers. But, it is difficult to say "how much" and to identify all the potential sources of admixture. Jews have been an international people for quite a long time, so I would guess that fragments of different peoples they encountered may remain in their genomes. Perhaps something akin to Ralph and Coop (2012) may give more information about the timing of these admixture events, as well as the date of the common ancestry of different Jewish groups.
PS: I started a small fastIBD analysis of different Jewish and non-Jewish groups with a fairly large assortment of populations, and will probably post it here in the next few days.
PNAS doi: 10.1073/pnas.1204840109
North African Jewish and non-Jewish populations form distinctive, orthogonal clusters
Christopher L. Campbell et al.
North African Jews constitute the second largest Jewish Diaspora group. However, their relatedness to each other; to European, Middle Eastern, and other Jewish Diaspora groups; and to their former North African non-Jewish neighbors has not been well defined. Here, genome-wide analysis of five North African Jewish groups (Moroccan, Algerian, Tunisian, Djerban, and Libyan) and comparison with other Jewish and non-Jewish groups demonstrated distinctive North African Jewish population clusters with proximity to other Jewish populations and variable degrees of Middle Eastern, European, and North African admixture. Two major subgroups were identified by principal component, neighbor joining tree, and identity-by-descent analysis—Moroccan/Algerian and Djerban/Libyan—that varied in their degree of European admixture. These populations showed a high degree of endogamy and were part of a larger Ashkenazi and Sephardic Jewish group. By principal component analysis, these North African groups were orthogonal to contemporary populations from North and South Morocco, Western Sahara, Tunisia, Libya, and Egypt. Thus, this study is compatible with the history of North African Jews—founding during Classical Antiquity with proselytism of local populations, followed by genetic isolation with the rise of Christianity and then Islam, and admixture following the emigration of Sephardic Jews during the Inquisition.
Link
arXiv:1208.1092v1 [q-bio.PE]
The Missing Link of Jewish European Ancestry: Contrasting the Rhineland and the Khazarian Hypotheses
Eran Elhaik
The question of Jewish ancestry has been the subject of controversy for over two centuries and has yet to be resolved. The "Rhineland Hypothesis" proposes that Eastern European Jews emerged from a small group of German Jews who migrated eastward and expanded rapidly. Alternatively, the "Khazarian Hypothesis" suggests that Eastern European descended from Judean tribes who joined the Khazars, an amalgam of Turkic clans that settled the Caucasus in the early centuries CE and converted to Judaism in the 8th century. The Judaized Empire was continuously reinforced with Mesopotamian and Greco-Roman Jews until the 13th century. Following the collapse of their empire, the Judeo-Khazars fled to Eastern Europe. The rise of European Jewry is therefore explained by the contribution of the Judeo-Khazars. Thus far, however, their contribution has been estimated only empirically; the absence of genome-wide data from Caucasus populations precluded testing the Khazarian Hypothesis. Recent sequencing of modern Caucasus populations prompted us to revisit the Khazarian Hypothesis and compare it with the Rhineland Hypothesis. We applied a wide range of population genetic analyses - including principal component, biogeographical origin, admixture, identity by descent, allele sharing distance, and uniparental analyses - to compare these two hypotheses. Our findings support the Khazarian Hypothesis and portray the European Jewish genome as a mosaic of Caucasus, European, and Semitic ancestries, thereby consolidating previous contradictory reports of Jewish ancestry.
Link
July 18, 2012
fastIBD over 2,257 Europeans
Razib points me towards a very interesting new paper that applies fastIBD over the large POPRES dataset of Europeans. The most interesting thing about this is that the authors develop techniques for estimating the time depth of the pattern of common ancestry across Europe, and hence are able to conclude that the Slavic expansion has played a bigger role in European history than the Germanic one.
A worthwhile improvement would be to apply a clustering algorithm like I did back in January over the fastIBD output; that way, one does not have to arbitrarily partition Europe into regions, but have the partitions jump out of the data.
A different idea to confirm the scenario presented in this paper would be to drill into different European populations. For example, in the case of the Italians, it would be worthwhile to identify whether there are particular sub-populations with likely Greek or Albanian ancestry who share an excess of IBD with modern Greeks and Albanians.
Population averages may mask such interesting patterns lurking in the data. For example, sub-clusters within populations can be identified with both fineSTRUCTURE and fastIBD, and the corresponding clusters can be assessed with supervised ADMIXTURE to detect how they differ from each other. For example, using this technique, I was able to infer 3 sub-clusters within the ethnic Greek population:
Interestingly, ~5% North_European levels would be similar to those of Armenians who are the closest linguistic cousins of the Greeks within the Indo-European family, as well as the the Anatolian Turkish cluster pop13 at ~9%.
Overall, it would appear that some mainland Greek groups received some input as the result of the medieval Slavic intrusions, since the mainland North_European excess appears as a "wedge" within the South Italy/Sicily/Crete/Anatolia/Armenia arc and the fastIBD pattern of sharing suggests that this is due to fairly recent connections.
As I have pointed out before, one limitation of the method of counting shared blocks of ancestry is that it does not disclose the directionality of gene flow. For example, gene flow between Germans and Slavs is detected in this study, which could be ascribed to Germans living in eastern Europe and/or to Slavs becoming acculturated Germans as a result of living within Germanic states or intermarrying with them prior to the age of the nation state.
Finally -and most interestingly- I hope that similar haplotype-based methods can be applied to a wider dataset, because, as it is becoming clear, Europe has not been isolated from Asia or Africa during its long history. The authors mention "Slavic or Hunnic" as an explanation for the pattern of shared ancestry in eastern Europe, but it is only by including Asian groups that we can detect the existence of real Hunnic (or Avar, or Mongol, or Pecheneg, or, ...) ancestry.
Moreover, I am confident that the Bronze Age is well within the power of haplotype-based methods to detect IBD. For example, South Asian populations clearly show differential patterns of affiliation with modern West Eurasian groups, most of which can date to no later than the Bronze Age. Together with the gradual incorporation of the new ancient DNA genomes that are bound to be coming our way soon, it seems that our picture of not only recent history, but also of late prehistory is bound to become much sharper.
arXiv:1207.3815v1 [q-bio.PE]
The geography of recent genetic ancestry across Europe
Peter Ralph, Graham Coop
(Submitted on 16 Jul 2012)
The recent genealogical history of human populations is a complex mosaic formed by individual migration, large-scale population movements, and other demographic events. Population genomics datasets can provide a window into this recent history, as rare traces of recent shared genetic ancestry are detectable due to long segments of shared genomic material. We make use of genomic data for 2,257 Europeans (the POPRES dataset) to conduct one of the first surveys of recent genealogical ancestry over the past three thousand years at a continental scale. We detected 1.9 million shared genomic segments, and used the lengths of these to infer the distribution of shared ancestors across time and geography. We find that a pair of modern Europeans living in neighboring populations share around 10-50 genetic common ancestors from the last 1500 years, and upwards of 500 genetic ancestors from the previous 1000 years. These numbers drop off exponentially with geographic distance, but since genetic ancestry is rare, individuals from opposite ends of Europe are still expected to share millions of common genealogical ancestors over the last 1000 years. There is substantial regional variation in the number of shared genetic ancestors: especially high numbers of common ancestors between many eastern populations likely date to the Slavic and/or Hunnic expansions, while much lower levels of common ancestry in the Italian and Iberian peninsulas may indicate weaker demographic effects of Germanic expansions into these areas and/or more stably structured populations. Recent shared ancestry in modern Europeans is ubiquitous, and clearly shows the impact of both small-scale migration and large historical events. Population genomic datasets have considerable power to uncover recent demographic history, and will allow a much fuller picture of the close genealogical kinship of individuals across the world.
Link
A worthwhile improvement would be to apply a clustering algorithm like I did back in January over the fastIBD output; that way, one does not have to arbitrarily partition Europe into regions, but have the partitions jump out of the data.
A different idea to confirm the scenario presented in this paper would be to drill into different European populations. For example, in the case of the Italians, it would be worthwhile to identify whether there are particular sub-populations with likely Greek or Albanian ancestry who share an excess of IBD with modern Greeks and Albanians.
Population averages may mask such interesting patterns lurking in the data. For example, sub-clusters within populations can be identified with both fineSTRUCTURE and fastIBD, and the corresponding clusters can be assessed with supervised ADMIXTURE to detect how they differ from each other. For example, using this technique, I was able to infer 3 sub-clusters within the ethnic Greek population:
- pop8 (mainland Greek) with ~23% North_European
- pop11 (Greek Cypriot) with ~5% North_European
- pop14 (Cretan, islander, mainland+Asia Minor) with ~12% North_European
- I have also a strong hunch based on a few half Pontic Greek+half mainland Greek data points that unmixed Pontic Greeks would be related to pop22 (Northeastern Anatolia) with ~5% North_European
Interestingly, ~5% North_European levels would be similar to those of Armenians who are the closest linguistic cousins of the Greeks within the Indo-European family, as well as the the Anatolian Turkish cluster pop13 at ~9%.
Overall, it would appear that some mainland Greek groups received some input as the result of the medieval Slavic intrusions, since the mainland North_European excess appears as a "wedge" within the South Italy/Sicily/Crete/Anatolia/Armenia arc and the fastIBD pattern of sharing suggests that this is due to fairly recent connections.
As I have pointed out before, one limitation of the method of counting shared blocks of ancestry is that it does not disclose the directionality of gene flow. For example, gene flow between Germans and Slavs is detected in this study, which could be ascribed to Germans living in eastern Europe and/or to Slavs becoming acculturated Germans as a result of living within Germanic states or intermarrying with them prior to the age of the nation state.
Finally -and most interestingly- I hope that similar haplotype-based methods can be applied to a wider dataset, because, as it is becoming clear, Europe has not been isolated from Asia or Africa during its long history. The authors mention "Slavic or Hunnic" as an explanation for the pattern of shared ancestry in eastern Europe, but it is only by including Asian groups that we can detect the existence of real Hunnic (or Avar, or Mongol, or Pecheneg, or, ...) ancestry.
Moreover, I am confident that the Bronze Age is well within the power of haplotype-based methods to detect IBD. For example, South Asian populations clearly show differential patterns of affiliation with modern West Eurasian groups, most of which can date to no later than the Bronze Age. Together with the gradual incorporation of the new ancient DNA genomes that are bound to be coming our way soon, it seems that our picture of not only recent history, but also of late prehistory is bound to become much sharper.
arXiv:1207.3815v1 [q-bio.PE]
The geography of recent genetic ancestry across Europe
Peter Ralph, Graham Coop
(Submitted on 16 Jul 2012)
The recent genealogical history of human populations is a complex mosaic formed by individual migration, large-scale population movements, and other demographic events. Population genomics datasets can provide a window into this recent history, as rare traces of recent shared genetic ancestry are detectable due to long segments of shared genomic material. We make use of genomic data for 2,257 Europeans (the POPRES dataset) to conduct one of the first surveys of recent genealogical ancestry over the past three thousand years at a continental scale. We detected 1.9 million shared genomic segments, and used the lengths of these to infer the distribution of shared ancestors across time and geography. We find that a pair of modern Europeans living in neighboring populations share around 10-50 genetic common ancestors from the last 1500 years, and upwards of 500 genetic ancestors from the previous 1000 years. These numbers drop off exponentially with geographic distance, but since genetic ancestry is rare, individuals from opposite ends of Europe are still expected to share millions of common genealogical ancestors over the last 1000 years. There is substantial regional variation in the number of shared genetic ancestors: especially high numbers of common ancestors between many eastern populations likely date to the Slavic and/or Hunnic expansions, while much lower levels of common ancestry in the Italian and Iberian peninsulas may indicate weaker demographic effects of Germanic expansions into these areas and/or more stably structured populations. Recent shared ancestry in modern Europeans is ubiquitous, and clearly shows the impact of both small-scale migration and large historical events. Population genomic datasets have considerable power to uncover recent demographic history, and will allow a much fuller picture of the close genealogical kinship of individuals across the world.
Link
March 26, 2012
Similarity matrices and clustering (Lawson and Falush)
Lawson and Falush have a new review paper on different clustering methods using haplotype data such as their own ChromoPainter/fineSTRUCTURE methodology, as well as the MCLUST/fastIBD methods that I started playing with a while back.
I won't have much time for the next few days to comprehensively review this new work, but I will add one data point to the discussion, by pointing to my ChromoPainter and fastIBD analyses over the same dataset. I will also add any further comments on this blog post, once I get the opportunity to read the paper.
Another point that needs to be made is how commendable the ChromoPainter folks' attitude towards the topic has been. Not only did they post their ChromoPainter preprint and software online months before their original paper was published, but they quickly jumped on my comments and suggestions on their paper to write their new review paper, making at available as a preprint itself. I'm guessing this saved about a year or two over what would have been possible if all the formalities of "traditional" publishing had been observed. It's also a very nice example of synergy between professional and amateur science, that the Internet and social media has made possible.
Similarity matrices and clustering algorithms for population identification using genetic data
Daniel John Lawson and Daniel Falush
Abstract
A large number of algorithms have been developed to identify population
structure from genetic data. Recent results show that the information used
by both model-based clustering methods and Principal Components Analysis
can be summarised by a matrix of pairwise similarity measures between
individuals. Similarity matrices have been constructed in a number of ways,
usually treating markers as independent but differing in the weighting given
to polymorphisms of different frequencies. Additionally, methods are now being
developed that better exploit the power of genome data by taking linkage
into account. We review several such matrices and evaluate their ‘information
content’. A two-stage approach for population identification is to first construct
a similarity matrix, and then perform clustering. We review a range
of common clustering algorithms, and evaluate their performance through a
simulation study. The clustering step can be performed either directly, or
after using a dimension reduction technique such as Principal Components
Analysis, which we find substantially improves the performance of most algorithms.
Based on these results, we describe the population structure signal
contained in each similarity matrix, finding that accounting for linkage leads
to significant improvements for sequence data. We also perform a comparison
on real data, where we find that population genetics models outperform
generic clustering approaches, particularly in regards to robustness against
features such as relatedness between individuals.
Link
I won't have much time for the next few days to comprehensively review this new work, but I will add one data point to the discussion, by pointing to my ChromoPainter and fastIBD analyses over the same dataset. I will also add any further comments on this blog post, once I get the opportunity to read the paper.
Another point that needs to be made is how commendable the ChromoPainter folks' attitude towards the topic has been. Not only did they post their ChromoPainter preprint and software online months before their original paper was published, but they quickly jumped on my comments and suggestions on their paper to write their new review paper, making at available as a preprint itself. I'm guessing this saved about a year or two over what would have been possible if all the formalities of "traditional" publishing had been observed. It's also a very nice example of synergy between professional and amateur science, that the Internet and social media has made possible.
Similarity matrices and clustering algorithms for population identification using genetic data
Daniel John Lawson and Daniel Falush
Abstract
A large number of algorithms have been developed to identify population
structure from genetic data. Recent results show that the information used
by both model-based clustering methods and Principal Components Analysis
can be summarised by a matrix of pairwise similarity measures between
individuals. Similarity matrices have been constructed in a number of ways,
usually treating markers as independent but differing in the weighting given
to polymorphisms of different frequencies. Additionally, methods are now being
developed that better exploit the power of genome data by taking linkage
into account. We review several such matrices and evaluate their ‘information
content’. A two-stage approach for population identification is to first construct
a similarity matrix, and then perform clustering. We review a range
of common clustering algorithms, and evaluate their performance through a
simulation study. The clustering step can be performed either directly, or
after using a dimension reduction technique such as Principal Components
Analysis, which we find substantially improves the performance of most algorithms.
Based on these results, we describe the population structure signal
contained in each similarity matrix, finding that accounting for linkage leads
to significant improvements for sequence data. We also perform a comparison
on real data, where we find that population genetics models outperform
generic clustering approaches, particularly in regards to robustness against
features such as relatedness between individuals.
Link
January 11, 2012
Clusters Galore (fastIBD edition)
(You can scroll down to the Results section, if you are not interested in the technical stuff)
When I proposed Clusters Galore in November 2010, I was pleasantly surprised to see that very fine scale population structure could be uncovered using a combination of two algorithms:
I have always thinking since that time of ways to improve the methodology. Since MCLUST is hard to best in my experience, I thought that improvement could be produced in the first step of the analysis; I have tried various ideas about choosing how many dimensions to retain, based on test of normality, Tracy-Widom statistics or some newer ideas. My conclusion has been that one could expect only delta improvements with any of these ideas.
After reading an abstract by Myers et al. in last years's ICHG, I realized that further improvement in resolution might be had by exploiting the linkage structure of dense genotype data, i.e., the pattern of co-inheritance of alleles along a stretch of chromosome.
Since, I didn't want to reinvent the wheel, I found the paintmychromosomes website, which I've also covered here, noting that it is unclear to what extent the ability of this methodology to infer fine-scale population structure is due to its exploitation of linkage. Unfortunately, the processing pipeline for this technique is computationally daunting, and I would probably have to wait months to carry out any meaningful experiment on the types of datasets I'm used to working with.
An hour's worth of coding may save you a month of runtime, so I decided to look elsewhere.
I've been experimenting with fastIBD for a while now, so I invested some time to write some auxiliary code that would help me use it for my purposes. fastIBD finds identical-by-descent segments in a collection of individuals. It also has several attractive properties:
fastIBD is tunable in various ways, but the default parameters seem to work fine for my purposes.
The end result of my labors is an NxN matrix (if there are N individuals) of IBD-based distance between individuals (in Morgans not IBD between individuals). This can then be fed into R's MDS routine, and then it's business as usual.
Results
I assembled a North European dataset for testing my ideas. A thing that always bugged me was the lack of ability to detect much population structure in the British Isles. So, I hoped that the added "punch" of using fastIBD would finally uncover this structure. All analyses were run with 256,932 SNPs.
Clusters Galore (fastIBD)
The 26 first MDS dimensions deviated from normality according to a Shapiro-Wilk test, and MCLUST found a total of 21 clusters using these dimensions.
The clusters could be labeled as:
The entire analysis (fastIBD + MCLUST) took a few hours to run.
Clusters Galore (PLINK/MDS)
For comparison, using the "classical" Clusters Galore with PLINK's MDS facility, there were 15 non-normal dimensions. A total of 16 clusters were inferred:
Some of the distinctions lost: 2 Finnish clusters rolled into 1; Lithuanians and + Slavs rolled into 1; there are 3 British Isles clusters with substantial overlap between different populations as well as with Scandinavians; Mordovians and Russians overlap; no German cluster.
It seems pretty clear to me that Clusters Galore (fastIBD) is the way to go into the future for this type of analysis, and hopefully further refinements to the methodology and the addition of more project participants will add even more resolution.
Clustering relies on (i) the ability to detect "blobs" of individuals, and (ii) the existence of such "blobs" of individuals. Clusters Galore (fastIBD edition) seems to be pretty good at doing (i), but it's as good as the data it's fed. For example, currently the Dutch seem split between the English and the Germans, but I have little doubt that if their sample sizes were to grow, they would also form their own specific cluster.
If you are a Project participant from these groups, you can find the results of this run in this spreadsheet.
When I proposed Clusters Galore in November 2010, I was pleasantly surprised to see that very fine scale population structure could be uncovered using a combination of two algorithms:
- A dimensionality reduction technique (such as PCA or MDS) applied to dense genotypic data
- MCLUST, a state-of-the art model-based normal mixture clustering algorithm that had enough chops to uncover clusters of arbitrary size, shape, and orientation in multidimensional space
I have always thinking since that time of ways to improve the methodology. Since MCLUST is hard to best in my experience, I thought that improvement could be produced in the first step of the analysis; I have tried various ideas about choosing how many dimensions to retain, based on test of normality, Tracy-Widom statistics or some newer ideas. My conclusion has been that one could expect only delta improvements with any of these ideas.
After reading an abstract by Myers et al. in last years's ICHG, I realized that further improvement in resolution might be had by exploiting the linkage structure of dense genotype data, i.e., the pattern of co-inheritance of alleles along a stretch of chromosome.
Since, I didn't want to reinvent the wheel, I found the paintmychromosomes website, which I've also covered here, noting that it is unclear to what extent the ability of this methodology to infer fine-scale population structure is due to its exploitation of linkage. Unfortunately, the processing pipeline for this technique is computationally daunting, and I would probably have to wait months to carry out any meaningful experiment on the types of datasets I'm used to working with.
An hour's worth of coding may save you a month of runtime, so I decided to look elsewhere.
I've been experimenting with fastIBD for a while now, so I invested some time to write some auxiliary code that would help me use it for my purposes. fastIBD finds identical-by-descent segments in a collection of individuals. It also has several attractive properties:
- It is fast
- It does its own phasing
- It runs within BEAGLE, a very well-known genetic analysis software
fastIBD is tunable in various ways, but the default parameters seem to work fine for my purposes.
The end result of my labors is an NxN matrix (if there are N individuals) of IBD-based distance between individuals (in Morgans not IBD between individuals). This can then be fed into R's MDS routine, and then it's business as usual.
Results
I assembled a North European dataset for testing my ideas. A thing that always bugged me was the lack of ability to detect much population structure in the British Isles. So, I hoped that the added "punch" of using fastIBD would finally uncover this structure. All analyses were run with 256,932 SNPs.
Clusters Galore (fastIBD)
The 26 first MDS dimensions deviated from normality according to a Shapiro-Wilk test, and MCLUST found a total of 21 clusters using these dimensions.
| Population | N | 1 | 2 | 3 | 4 | 5 | 6 | 7 | 8 | 9 | 10 | 11 | 12 | 13 | 14 | 15 | 16 | 17 | 18 | 19 | 20 | 21 |
| Russian_D | 22 | 2 | 20 | |||||||||||||||||||
| Irish_D | 22 | 19 | 2 | 1 | ||||||||||||||||||
| Polish_D | 23 | 23 | ||||||||||||||||||||
| German_D | 21 | 1 | 18 | 2 | ||||||||||||||||||
| Finnish_D | 17 | 10 | 7 | |||||||||||||||||||
| Swedish_D | 13 | 1 | 12 | |||||||||||||||||||
| English_D | 12 | 12 | ||||||||||||||||||||
| British_D | 13 | 1 | 12 | |||||||||||||||||||
| Norwegian_D | 11 | 11 | ||||||||||||||||||||
| Lithuanian_D | 10 | 1 | 9 | |||||||||||||||||||
| Dutch_D | 9 | 5 | 3 | 1 | ||||||||||||||||||
| British_Isles_D | 8 | 8 | ||||||||||||||||||||
| Mixed_Scandinavian_D | 4 | 4 | ||||||||||||||||||||
| Danish_D | 3 | 3 | ||||||||||||||||||||
| Ukrainian_D | 2 | 2 | ||||||||||||||||||||
| Latvian_D | 1 | 1 | ||||||||||||||||||||
| Estonian_D | 1 | 1 | ||||||||||||||||||||
| Russian | 25 | 1 | 24 | |||||||||||||||||||
| Orcadian | 15 | 15 | ||||||||||||||||||||
| Lithuanians | 10 | 1 | 9 | |||||||||||||||||||
| Belorussian | 9 | 8 | 1 | |||||||||||||||||||
| Orkney_1KG | 25 | 19 | 2 | 2 | 2 | |||||||||||||||||
| Kent_1KG | 38 | 34 | 2 | 2 | ||||||||||||||||||
| Cornwall_1KG | 33 | 1 | 30 | 2 | ||||||||||||||||||
| Argyll_1KG | 4 | 1 | 3 | |||||||||||||||||||
| FIN30 | 30 | 14 | 16 | |||||||||||||||||||
| Ukranians_Y | 20 | 20 | ||||||||||||||||||||
| Mordovians_Y | 15 | 13 | 2 |
The clusters could be labeled as:
- Mordovian
- Slavic
- Irish
- English/British
- German
- Mini-cluster of 2 related Germans?
- Scandinavian
- Finnish 1
- Finnish 2
- Lithuanian
- Orkney
- Vologda Russians (HGDP)
- Mini-cluster of 2 Vologda Russians
- Mini-cluster of 2 Vologda Russians
- Mini-cluster of 2 Vologda Russians
- Mini-cluster of 2 Kent English
- Mini-cluster of 2 Kent English
- Cornwall
- Mini-cluster of 2 Cornwall
- Argyll
- Mini-cluster of 2 Mordovians
The entire analysis (fastIBD + MCLUST) took a few hours to run.
Clusters Galore (PLINK/MDS)
For comparison, using the "classical" Clusters Galore with PLINK's MDS facility, there were 15 non-normal dimensions. A total of 16 clusters were inferred:
| Population | N | 1 | 2 | 3 | 4 | 5 | 6 | 7 | 8 | 9 | 10 | 11 | 12 | 13 | 14 | 15 | 16 |
| Russian_D | 22 | 2 | 15 | 5 | |||||||||||||
| Irish_D | 22 | 6 | 6 | 10 | |||||||||||||
| Polish_D | 23 | 20 | 3 | ||||||||||||||
| German_D | 21 | 1 | 8 | 4 | 3 | 5 | |||||||||||
| Finnish_D | 17 | 17 | |||||||||||||||
| Swedish_D | 13 | 12 | 1 | ||||||||||||||
| English_D | 12 | 5 | 2 | 5 | |||||||||||||
| British_D | 13 | 1 | 3 | 9 | |||||||||||||
| Norwegian_D | 11 | 5 | 2 | 3 | 1 | ||||||||||||
| Lithuanian_D | 10 | 10 | |||||||||||||||
| Dutch_D | 9 | 2 | 4 | 3 | |||||||||||||
| British_Isles_D | 8 | 3 | 1 | 4 | |||||||||||||
| Mixed_Scandinavian_D | 4 | 4 | |||||||||||||||
| Danish_D | 3 | 1 | 1 | 1 | |||||||||||||
| Ukrainian_D | 2 | 1 | 1 | ||||||||||||||
| Latvian_D | 1 | 1 | |||||||||||||||
| Estonian_D | 1 | 1 | |||||||||||||||
| Russian | 25 | 8 | 1 | 16 | |||||||||||||
| Orcadian | 15 | 6 | 9 | ||||||||||||||
| Lithuanians | 10 | 10 | |||||||||||||||
| Belorussian | 9 | 9 | |||||||||||||||
| Orkney_1KG | 25 | 2 | 14 | 5 | 2 | 2 | |||||||||||
| Kent_1KG | 38 | 15 | 8 | 11 | 2 | 2 | |||||||||||
| Cornwall_1KG | 33 | 17 | 1 | 13 | 2 | ||||||||||||
| Argyll_1KG | 4 | 2 | 2 | ||||||||||||||
| FIN30 | 30 | 1 | 29 | ||||||||||||||
| Ukranians_Y | 20 | 20 | |||||||||||||||
| Mordovians_Y | 15 | 11 | 1 | 3 |
Some of the distinctions lost: 2 Finnish clusters rolled into 1; Lithuanians and + Slavs rolled into 1; there are 3 British Isles clusters with substantial overlap between different populations as well as with Scandinavians; Mordovians and Russians overlap; no German cluster.
It seems pretty clear to me that Clusters Galore (fastIBD) is the way to go into the future for this type of analysis, and hopefully further refinements to the methodology and the addition of more project participants will add even more resolution.
Clustering relies on (i) the ability to detect "blobs" of individuals, and (ii) the existence of such "blobs" of individuals. Clusters Galore (fastIBD edition) seems to be pretty good at doing (i), but it's as good as the data it's fed. For example, currently the Dutch seem split between the English and the Germans, but I have little doubt that if their sample sizes were to grow, they would also form their own specific cluster.
If you are a Project participant from these groups, you can find the results of this run in this spreadsheet.
Subscribe to:
Posts (Atom)