Antiquity / Volume 89 / Issue 343 / February 2015, pp 191-209
Representations of oxhide ingots in Scandinavian rock art: the sketchbook of a Bronze Age traveller?
Johan Ling and Zofia Stos-Gale
Bronze Age trade networks across Europe and the Mediterranean are well documented; Baltic amber and bronze metalwork were particularly valued commodities. Here it is argued that demand for copper and tin led to changes in Scandinavian trade routes around 1600 BC, which can be linked to the appearance of figurative rock art images in southern Scandinavia. Images identified as oxhide ingots have been discovered in Sweden and suggest that people from Scandinavia were familiar with this characteristically Mediterranean trading commodity. Using trace element and lead isotope analysis, the authors argue that some bronze tools excavated in Sweden could have been made of Cypriot copper; these two discoveries suggest that Scandinavians were travelling to the Mediterranean, rather than acting through a middle man.
Link

Showing posts with label Cyprus. Show all posts
Showing posts with label Cyprus. Show all posts
March 03, 2015
June 06, 2014
Ancient mtDNA from pre-pottery Neolithic B

PLOS Genetics DOI: 10.1371/journal.pgen.1004401
Ancient DNA Analysis of 8000 B.C. Near Eastern Farmers Supports an Early Neolithic Pioneer Maritime Colonization of Mainland Europe through Cyprus and the Aegean Islands
Eva Fernández et al.
The genetic impact associated to the Neolithic spread in Europe has been widely debated over the last 20 years. Within this context, ancient DNA studies have provided a more reliable picture by directly analyzing the protagonist populations at different regions in Europe. However, the lack of available data from the original Near Eastern farmers has limited the achieved conclusions, preventing the formulation of continental models of Neolithic expansion. Here we address this issue by presenting mitochondrial DNA data of the original Near-Eastern Neolithic communities with the aim of providing the adequate background for the interpretation of Neolithic genetic data from European samples. Sixty-three skeletons from the Pre Pottery Neolithic B (PPNB) sites of Tell Halula, Tell Ramad and Dja'de El Mughara dating between 8,700–6,600 cal. B.C. were analyzed, and 15 validated mitochondrial DNA profiles were recovered. In order to estimate the demographic contribution of the first farmers to both Central European and Western Mediterranean Neolithic cultures, haplotype and haplogroup diversities in the PPNB sample were compared using phylogeographic and population genetic analyses to available ancient DNA data from human remains belonging to the Linearbandkeramik-Alföldi Vonaldiszes Kerámia and Cardial/Epicardial cultures. We also searched for possible signatures of the original Neolithic expansion over the modern Near Eastern and South European genetic pools, and tried to infer possible routes of expansion by comparing the obtained results to a database of 60 modern populations from both regions. Comparisons performed among the 3 ancient datasets allowed us to identify K and N-derived mitochondrial DNA haplogroups as potential markers of the Neolithic expansion, whose genetic signature would have reached both the Iberian coasts and the Central European plain. Moreover, the observed genetic affinities between the PPNB samples and the modern populations of Cyprus and Crete seem to suggest that the Neolithic was first introduced into Europe through pioneer seafaring colonization.
Link
November 16, 2012
Pre-Neolithic Mediterranean Island settlement
PhysOrg coverage of a Science perspective:
Science 16 November 2012: Vol. 338 no. 6109 pp. 895-897 DOI: 10.1126/science.1228880
Mediterranean Island Voyages
Alan Simmons
Some of the classical world's most innovative cultures developed on Mediterranean islands, but their earlier human use is poorly known. The islands, particularly those further from the mainland such as Crete and Cyprus, were thought to have been first colonized about 9000 years ago by late Neolithic agriculturalists with domesticated resources. Until about 20 years ago, claims of earlier, pre-Neolithic occupations on any of the islands did not stand up to critical scrutiny (1), but current investigations are challenging these perceptions. Discoveries on Cyprus, Crete, and some Ionian islands suggest seafaring abilities by pre-Neolithic peoples, perhaps extending back to Neanderthals or even earlier hominins. In Cyprus, Neolithic sites have been documented that are nearly as early as those on the mainland.
Link
Modern science has held that islands such as Cyprus and Crete were first inhabited by seafaring humans approximately 9,000 years ago by agriculturists from the late Neolithic period. Simmons writes that research over the past 20 years has cast doubt on that assumption however and suggests that it might be time to rewrite the history books. He cites evidence such as pieces of obsidian found in a cave in mainland Greece that were found to have come from Melos, an island in the Aegean Sea and were dated at 11,000 years ago as well as artifacts from recent digs on Cyprus that are believed to be from approximately 12,000 years ago. He adds that some researchers have also found evidence that something, or someone caused the extinction of pygmy hippos on Cyprus around the same time.
Simmons also suggests that the first inhabitants of many of the Mediterranean islands may not have been modern humans at all. Instead, he says evidence has been found that shows that they might have been Neanderthals, or Homo Erectus. Recent excavations on Crete have turned up artifacts that are thought to be 110,000 years old, for example, and a stone axe was found that is believed to have been made on the same island as far back as 170,000 years ago. Since modern humans are believed to have come into being roughly 100,000 to 200,000 years ago, the possibility exists that such artifacts were left behind by an early ancestor or cousin.
Science 16 November 2012: Vol. 338 no. 6109 pp. 895-897 DOI: 10.1126/science.1228880
Mediterranean Island Voyages
Alan Simmons
Some of the classical world's most innovative cultures developed on Mediterranean islands, but their earlier human use is poorly known. The islands, particularly those further from the mainland such as Crete and Cyprus, were thought to have been first colonized about 9000 years ago by late Neolithic agriculturalists with domesticated resources. Until about 20 years ago, claims of earlier, pre-Neolithic occupations on any of the islands did not stand up to critical scrutiny (1), but current investigations are challenging these perceptions. Discoveries on Cyprus, Crete, and some Ionian islands suggest seafaring abilities by pre-Neolithic peoples, perhaps extending back to Neanderthals or even earlier hominins. In Cyprus, Neolithic sites have been documented that are nearly as early as those on the mainland.
Link
August 08, 2012
fastIBD analysis of several Jewish and non-Jewish groups
This is more of a "just the data" kind of post, inspired by the two recent papers on Jewish origins. A few quick points:
And, here are a couple of the visualizations for a few Jewish populations:


 Note that all sources of data are listed on the bottom left of the Dodecad blog.
- fastIBD was run with default parameters over a dataset of 512 individuals/264,539 SNPs
- fastIBD identifies segments of relatively recent origin that are shared by individuals. These results should not be construed as measures of overall genetic similarity or origins. Rather, they suggest which populations have exchanged genes in the relative recent past, say, the last two thousand years or so.
- I included all Ashkenazi_D and North_African_Jews_D samples; of the other Dodecad and reference populations, I took random samples of 10 each; running time of fastIBD increases with the square of the number of individuals, so doing this allowed me to run this in less than a day as opposed to about a week.
- Spreadsheet of numeric results, showing sharing (in centi-Morgans, cM)
- Population-level graphical results, showing an ordering of other populations based on mean IBD sharing.

And, here are a couple of the visualizations for a few Jewish populations:


July 24, 2012
Archaeometallurgy in the Mediterranean

Continuing a discussion on metallurgical innovation which I began here.
Some interesting excerpts from a book chapter:
Tin bronze first appeared in Mesopotamia and Anatolia during the third millennium B.C., or Early Bronze Age (Pare 2000a:6–7). In the Mediterranean,the transition from arsenical to tin bronze took place during the course of the Middle Bronze Age (late third to early second millennium B.C.in the eastern Mediter-ranean, somewhat later in the west). The implication (Renfrew 1972:313–319) that tin bronze was an independent development in the northeast Aegean is contradicted by lead isotope analyses which show that most copper or bronze objects from sites such as Troy, Poliochni, and Kastri were not produced from local ores (Muhly and Pernicka 1992; Pernicka 1998:140–141). Exactly what caused the transition from arsenical to tin bronze is not well understood: as an alloy, tin bronze is not mechanically superior to arsenical copper (Pernicka 1998:135–136).Unlike arsenic, moreover, tin is not widely available as a mineral, and new trade networks would have been required to enable its distribution. However, it may have been easier to control the quality of tin bronze, and the production of tin bronze would have overcome the problem of working with toxic arsenic fumes (Charles 1978:30;Pare 2000a:7).
Given the limited number of tin deposits in the region, the source(s) of tin usedin the prehistoric eastern Mediterranean has always been a highly controversial issue. The suggestion that Afghanistan served as a prime source of tin for Bronze Age eastern Mediterranean societies is based in part on the existence of its rich tin resources (Muhly and Pernicka 1992:315;Weeks 1999:60–61).Muhly (1999:21) recently argued that Afghanistan or central Asia provided the tin that supplied the bronze industries of Mesopotamia, Anatolia, and the eastern Mediterranean, including Cyprus. Cuneiform documents from the early second millennium B.C., moreover, point to a trade network that brought tin from the east to the early states of Anatolia and Mesopotamia (Maddin et al.1977:41:Weeks 1999),and thence to the Mediterranean. Weisgerber and Cierny (2002,with fuller references) now maintain that prehistoric tin mining (second millennium B.C.), attested at the sites of Karnab (Uzbekhistan) and Musciston (Tajikistan), provided an important source of tin for Anatolia and Mesopotamia, if not for the Mediterranean. In contrast, Yener and Vandiver (1993) have argued that (very limited) tin deposits in the Taurus Mountains of southern Turkey were exploited during the Early Bronze Age. Their argument has been challenged by several scholars (e.g.,Muhly 1993;Weisgerberand Chierny 2002:180–181;papers in Journal of Mediterranean Archaeology 5[1995]) who maintain that the archaeological evidence is unclear,and far too limited to demonstrate anything beyond local use. Even if tin from the Taurus were mined during the Early Bronze Age, it now seems more likely that central Asia provided at least some of the tin used during the Middle-Late Bronze Ages,when tin bronze was far more widely produced, traded, and consumed in the Mediterranean.
...
By the Late Neolithic period (ca.4800–3100 B.C.), most people living in the Mediterranean region produced their own food, lived the year round in sedentary communities and increasingly were involved in intricate social and economic exchanges. By the beginning of the Bronze Age, certain alliances, special-interest groups, or even individual local leaders came to control access to raw materials in demand: obsidian, precious or semi-precious stones, metals such as gold, silver, copper, and tin, and a range of more perishable goods. From about 3000 B.C.onward – corresponding to the Chalcolithic period (Argaric culture) in Spain, the Final Neolithic in Italy, and the Early Bronze Age in the Aegean and eastern Mediterranean – the production and trade in metals increasingly became a key factor in promoting social change (Giardino 2000b;Knapp 1990a;Levy et al.2002;Manning 1994;Ruiz Taboada and Montero Ruiz 1999).
...
Technological innovations may be seen as progressive by managers and elites, but for the people who mined ores or smelted metals they were also potentially disruptive, forming the backdrop for social change as well as social abuse (Heskel andLamberg-Karlovsky 1980:260–261;Stollner 2003:427–429). Miners and metal-smiths often use ideology as a means to maintain, resist,or change their power base within society. Because elites who control and organize metallurgical produc-tion often use material culture to restructure relations of power (Gamble 1986:39), we may also expect such transformations to be visible in the archaeological record.
...
Consequently, there is little room to doubt that innovations in technology had deep-seated and long-lasting social and ecological effects, placing constraints as well as conferring benefits on Bronze Age mining and metallurgical production. In social terms, whereas the intensified production of copper employing an advanced technology did not preclude a strong sense of local community, such factors served to increase social distinctions between those at the top of the control structure and those at the bottom (Hardesty 1988:102,116;Knapp 1986b;2003).
...
The trade in metals during the Chalcolithic period was carried out on a very limited scale, and most metals were certainly consumed in the same area where they were produced (cf.Gale 1991). During the Early Bronze Age (third millennium B.C.), technological innovations like the longboat and sail facilitated the bulk transport of raw materials or manufactured goods on a much larger scale than ever before (Broodbank 1989).
...
Metals and metallurgy wielded an immense impact on Mediterranean Bronze Age societies, clearly evident in all the fundamental changes seen in the archaeological record from the end of the Chalcolithic period (Copper Age) onward. During the Bronze Age,innovations in maritime transport and the earliest cultivation of olives and vines stimulated the economy of the Mediterranean region and spurred some of its inhabitants to produce metals, take part in maritime trade, manufacture distinctive artifacts, and build domestic and public structures that represented the earliest towns and ceremonial complexes in the Mediterranean. The advent and spread of metallurgy promoted greater social distinctions,as certain individuals or groups acquired new wealth and prestige items. Because tin had to be imported in order to produce bronze, long-distance trade was stimulated. Duringthe second millennium B.C., gold, silver, copper, and tin came to represent what Sherratt (2000:83) has termed “convertible”value, both in an economic sense and in the literal sense that they could be consumed, stored, redistributed, or recycled in diverse forms and for various symbolic or ideological ends.Such documentary evidence as exists, exclusively in the eastern Mediterranean, is frequently preoccupied with these self-same metals (Liverani 1990:205–223,247–266;Moran,inKnapp 1996:21–25).
A remarkable series of social and economic changes thus were linked closely to all the innovative developments in extractive and metallurgical technologies,and tothe increasingly widespread and intensified production and distribution of metalsand metal objects. These changes include but are not limited to: (1) the proliferation of settlements and the emergence of town centers;(2) the development and expansion in interregional trade;(3) the growth of palatial regimes and city-state kingdoms,with their attendant writing systems (notably in the eastern Mediterranean);(4) the development and refinement of craft specialization and the spread of an iconographic koine;(5) the elaboration of mortuary rituals and burials with large quantities of precious metal goods;(6) the widespread occurrence of metal hoards and the related trade in recycled and scrap metal. The circulation of goods, ideas, and ideologies across geographic,cultural,and economic boundaries represents a social transaction,one that entangled producers, distributors, and consumers in wider relations of alliance and dependence, patronage and privilege, prestige and debt (Thomas 1991:123–124). Certain occupational identities came to be focused around metallurgical production and trade, and Cyprus even gave its name to the island’s most prominent product: copper ore (Muhly 1973:174–175).The coming of the Age of Iron, subsequent to all the developments discussed in this study, itself relied on extractive and smelting technologies developed during theBronze Age,together with the use of carburization, all of which are linked directly(albeit over the millennia) to the dramatic social and economic changes that ushered in the Industrial Revolution and the beginnings of the modern era.If it is indeed the case that “metals make the world go round” (Pare 2000b),nowhere can this slogan be better and more widely illustrated than in the prehistoric Bronze Age of the Mediterranean.
Archaeometallurgy in the Mediterranean: The Social Context of Mining, Technology, and Trade
Vasiliki Kassianidou and A.Bernard Knapp
Link
July 18, 2012
fastIBD over 2,257 Europeans
Razib points me towards a very interesting new paper that applies fastIBD over the large POPRES dataset of Europeans. The most interesting thing about this is that the authors develop techniques for estimating the time depth of the pattern of common ancestry across Europe, and hence are able to conclude that the Slavic expansion has played a bigger role in European history than the Germanic one.
A worthwhile improvement would be to apply a clustering algorithm like I did back in January over the fastIBD output; that way, one does not have to arbitrarily partition Europe into regions, but have the partitions jump out of the data.
A different idea to confirm the scenario presented in this paper would be to drill into different European populations. For example, in the case of the Italians, it would be worthwhile to identify whether there are particular sub-populations with likely Greek or Albanian ancestry who share an excess of IBD with modern Greeks and Albanians.
Population averages may mask such interesting patterns lurking in the data. For example, sub-clusters within populations can be identified with both fineSTRUCTURE and fastIBD, and the corresponding clusters can be assessed with supervised ADMIXTURE to detect how they differ from each other. For example, using this technique, I was able to infer 3 sub-clusters within the ethnic Greek population:
Interestingly, ~5% North_European levels would be similar to those of Armenians who are the closest linguistic cousins of the Greeks within the Indo-European family, as well as the the Anatolian Turkish cluster pop13 at ~9%.
Overall, it would appear that some mainland Greek groups received some input as the result of the medieval Slavic intrusions, since the mainland North_European excess appears as a "wedge" within the South Italy/Sicily/Crete/Anatolia/Armenia arc and the fastIBD pattern of sharing suggests that this is due to fairly recent connections.
As I have pointed out before, one limitation of the method of counting shared blocks of ancestry is that it does not disclose the directionality of gene flow. For example, gene flow between Germans and Slavs is detected in this study, which could be ascribed to Germans living in eastern Europe and/or to Slavs becoming acculturated Germans as a result of living within Germanic states or intermarrying with them prior to the age of the nation state.
Finally -and most interestingly- I hope that similar haplotype-based methods can be applied to a wider dataset, because, as it is becoming clear, Europe has not been isolated from Asia or Africa during its long history. The authors mention "Slavic or Hunnic" as an explanation for the pattern of shared ancestry in eastern Europe, but it is only by including Asian groups that we can detect the existence of real Hunnic (or Avar, or Mongol, or Pecheneg, or, ...) ancestry.
Moreover, I am confident that the Bronze Age is well within the power of haplotype-based methods to detect IBD. For example, South Asian populations clearly show differential patterns of affiliation with modern West Eurasian groups, most of which can date to no later than the Bronze Age. Together with the gradual incorporation of the new ancient DNA genomes that are bound to be coming our way soon, it seems that our picture of not only recent history, but also of late prehistory is bound to become much sharper.
arXiv:1207.3815v1 [q-bio.PE]
The geography of recent genetic ancestry across Europe
Peter Ralph, Graham Coop
(Submitted on 16 Jul 2012)
The recent genealogical history of human populations is a complex mosaic formed by individual migration, large-scale population movements, and other demographic events. Population genomics datasets can provide a window into this recent history, as rare traces of recent shared genetic ancestry are detectable due to long segments of shared genomic material. We make use of genomic data for 2,257 Europeans (the POPRES dataset) to conduct one of the first surveys of recent genealogical ancestry over the past three thousand years at a continental scale. We detected 1.9 million shared genomic segments, and used the lengths of these to infer the distribution of shared ancestors across time and geography. We find that a pair of modern Europeans living in neighboring populations share around 10-50 genetic common ancestors from the last 1500 years, and upwards of 500 genetic ancestors from the previous 1000 years. These numbers drop off exponentially with geographic distance, but since genetic ancestry is rare, individuals from opposite ends of Europe are still expected to share millions of common genealogical ancestors over the last 1000 years. There is substantial regional variation in the number of shared genetic ancestors: especially high numbers of common ancestors between many eastern populations likely date to the Slavic and/or Hunnic expansions, while much lower levels of common ancestry in the Italian and Iberian peninsulas may indicate weaker demographic effects of Germanic expansions into these areas and/or more stably structured populations. Recent shared ancestry in modern Europeans is ubiquitous, and clearly shows the impact of both small-scale migration and large historical events. Population genomic datasets have considerable power to uncover recent demographic history, and will allow a much fuller picture of the close genealogical kinship of individuals across the world.
Link
A worthwhile improvement would be to apply a clustering algorithm like I did back in January over the fastIBD output; that way, one does not have to arbitrarily partition Europe into regions, but have the partitions jump out of the data.
A different idea to confirm the scenario presented in this paper would be to drill into different European populations. For example, in the case of the Italians, it would be worthwhile to identify whether there are particular sub-populations with likely Greek or Albanian ancestry who share an excess of IBD with modern Greeks and Albanians.
Population averages may mask such interesting patterns lurking in the data. For example, sub-clusters within populations can be identified with both fineSTRUCTURE and fastIBD, and the corresponding clusters can be assessed with supervised ADMIXTURE to detect how they differ from each other. For example, using this technique, I was able to infer 3 sub-clusters within the ethnic Greek population:
- pop8 (mainland Greek) with ~23% North_European
- pop11 (Greek Cypriot) with ~5% North_European
- pop14 (Cretan, islander, mainland+Asia Minor) with ~12% North_European
- I have also a strong hunch based on a few half Pontic Greek+half mainland Greek data points that unmixed Pontic Greeks would be related to pop22 (Northeastern Anatolia) with ~5% North_European
Interestingly, ~5% North_European levels would be similar to those of Armenians who are the closest linguistic cousins of the Greeks within the Indo-European family, as well as the the Anatolian Turkish cluster pop13 at ~9%.
Overall, it would appear that some mainland Greek groups received some input as the result of the medieval Slavic intrusions, since the mainland North_European excess appears as a "wedge" within the South Italy/Sicily/Crete/Anatolia/Armenia arc and the fastIBD pattern of sharing suggests that this is due to fairly recent connections.
As I have pointed out before, one limitation of the method of counting shared blocks of ancestry is that it does not disclose the directionality of gene flow. For example, gene flow between Germans and Slavs is detected in this study, which could be ascribed to Germans living in eastern Europe and/or to Slavs becoming acculturated Germans as a result of living within Germanic states or intermarrying with them prior to the age of the nation state.
Finally -and most interestingly- I hope that similar haplotype-based methods can be applied to a wider dataset, because, as it is becoming clear, Europe has not been isolated from Asia or Africa during its long history. The authors mention "Slavic or Hunnic" as an explanation for the pattern of shared ancestry in eastern Europe, but it is only by including Asian groups that we can detect the existence of real Hunnic (or Avar, or Mongol, or Pecheneg, or, ...) ancestry.
Moreover, I am confident that the Bronze Age is well within the power of haplotype-based methods to detect IBD. For example, South Asian populations clearly show differential patterns of affiliation with modern West Eurasian groups, most of which can date to no later than the Bronze Age. Together with the gradual incorporation of the new ancient DNA genomes that are bound to be coming our way soon, it seems that our picture of not only recent history, but also of late prehistory is bound to become much sharper.
arXiv:1207.3815v1 [q-bio.PE]
The geography of recent genetic ancestry across Europe
Peter Ralph, Graham Coop
(Submitted on 16 Jul 2012)
The recent genealogical history of human populations is a complex mosaic formed by individual migration, large-scale population movements, and other demographic events. Population genomics datasets can provide a window into this recent history, as rare traces of recent shared genetic ancestry are detectable due to long segments of shared genomic material. We make use of genomic data for 2,257 Europeans (the POPRES dataset) to conduct one of the first surveys of recent genealogical ancestry over the past three thousand years at a continental scale. We detected 1.9 million shared genomic segments, and used the lengths of these to infer the distribution of shared ancestors across time and geography. We find that a pair of modern Europeans living in neighboring populations share around 10-50 genetic common ancestors from the last 1500 years, and upwards of 500 genetic ancestors from the previous 1000 years. These numbers drop off exponentially with geographic distance, but since genetic ancestry is rare, individuals from opposite ends of Europe are still expected to share millions of common genealogical ancestors over the last 1000 years. There is substantial regional variation in the number of shared genetic ancestors: especially high numbers of common ancestors between many eastern populations likely date to the Slavic and/or Hunnic expansions, while much lower levels of common ancestry in the Italian and Iberian peninsulas may indicate weaker demographic effects of Germanic expansions into these areas and/or more stably structured populations. Recent shared ancestry in modern Europeans is ubiquitous, and clearly shows the impact of both small-scale migration and large historical events. Population genomic datasets have considerable power to uncover recent demographic history, and will allow a much fuller picture of the close genealogical kinship of individuals across the world.
Link
May 09, 2012
Agriculture arrived in Cyprus 10,600 years ago
PNAS doi: 10.1073/pnas.1201693109
First wave of cultivators spread to Cyprus at least 10,600 y ago
Jean-Denis Vigne et al.
Early Neolithic sedentary villagers started cultivating wild cereals in the Near East 11,500 y ago [Pre-Pottery Neolithic A (PPNA)]. Recent discoveries indicated that Cyprus was frequented by Late PPNA people, but the earliest evidence until now for both the use of cereals and Neolithic villages on the island dates to 10,400 y ago. Here we present the recent archaeological excavation at Klimonas, which demonstrates that established villagers were living on Cyprus between 11,100 and 10,600 y ago. Villagers had stone artifacts and buildings (including a remarkable 10-m diameter communal building) that were similar to those found on Late PPNA sites on the mainland. Cereals were introduced from the Levant, and meat was obtained by hunting the only ungulate living on the island, a small indigenous Cypriot wild boar. Cats and small domestic dogs were brought from the mainland. This colonization suggests well-developed maritime capabilities by the PPNA period, but also that migration from the mainland may have occurred shortly after the beginning of agriculture.
Link
April 23, 2011
Genetic structure of West Eurasians
I have decided to generate a new major data dump of ADMIXTURE results. In comparison to previous such experiments:
- The focus is entirely on West Eurasians (Caucasoids).
- I have excluded all potential relatives from the source datasets, as well as several populations that tend to create uninformative clusters of their own (e.g., Druze or Ashkenazi Jews); exceptions are populations of great anthropological interest (e.g., Basques).
- I have included all relevant Dodecad Ancestry Project populations with 5+ participants.
- I have developed a new way of "framing" the region of interest by choosing appropriate sets of individuals from outside of it.
I have, since the beginning of my ADMIXTURE experiments, emphasized the importance of including appropriate population controls designed to squeeze out minor distant admixture in populations of interest, so that it does not confound the inference of region-specific components.
This leads to a problem: there are many possible sources of admixture. For example, we do not know a priori which set of African populations may have contributed to Caucasoid populations, or which set of East Asian ones. We could choose e.g., the Yoruba and the Chinese to represent Sub-Saharans and East Asians, but that might exclude possible sources of variation, and lead to Yoruba- and Chinese- specific clusters rather than more general Sub-Saharan and East Asian ones. If we included more population controls, we would cover more possible sources of variation, but ADMIXTURE would infer components of little interest (e.g., between Pygmies vs. Bushmen or Mongols vs. Chinese)
To avoid this, I propose to create meta-populations consisting of a single individual from many populations, i.e., a Yoruba, a Mandenka, a San, a Mbuti Pygmy, etc. for Sub-Saharan Africa, or a Miaozu, a Han, a Mongol, a She, a Hezhen, etc. for East Asia. That way we are both helping ADMIXTURE infer general components, while at the same time preventing it from inferring non-region specific ones.
Results
The entirety of the results presented here can be downloaded. They include:
- Population sources
- ADMIXTURE proportions for populations
- Fst divergences between components
- Population portraits showing individual level variation

At K=3, we observe the emergence West Eurasian, Sub-Saharan, and East/South Asian components.
The impact of the Sub-Saharan component is felt most distinctly in North Africa and the Near East, especially among Arabs; the impact of the East/South Asian one in West Asia and Northeastern Europe, especially among Finnic and Turkic speakers.
It is interesting to note that 39.8% of the Indian_D sample is assigned to the E/S Asian component. I had previously estimated in a roundabout way, and in a slightly smaller sample that the Ancestral South Indian component in Project participants was 33.3%, so ADMIXTURE has roughly managed to infer correctly that about 1/3 of this Indian sample's ancestry is more closely related to East Asians than to West Eurasians.


At K=4, the first split within the Caucasoid group appears: a component centered onn Europe, and one on West/South Asia.
Many populations possess both these components in clinal proportions.
The European component shrinks to insignificance in Arabians, such as Saudis and Yemenese.
The West/South Asian component shrinks to insignificance in Northeast Europeans, such as Finns, Lithuanians, north Russians, and Chuvash.
 At K=5, a new Mediterranean component emerges. This is highly represented in populations to the North, South, and East of the Mediterranean sea.
This component is noteworthy for its absence in India and Northeastern Europe.
In Northeastern Europe, the Mediterranean component is hardly represented at all, whereas the West/South Asian component, freed of its K=4 Mediterranean associations now makes its appearance.
Conversely, in the West Mediterranean, among Basques, Sardinians, Moroccans, and Mozabites the West/South Asian component vanishes to non-existence.
 At K=6, a North African component emerges.
 Notice its presence in the Near East and parts of Southern Europe.
The two regions can be contrasted in terms of their African components, with very high North/Sub-Saharan African ratio in Europe vs. much lower in the Near East.
The explanation for this seems straightforward, as Europe was affected by North Africa in prehistoric and historic times, whereas the Near East also shares a border with more southern parts of the African continent, as well as the potential influence of the medieval slave trade that seems to have affected Muslim Near Eastern populations disproportionately.
 At K=7, a Southwest Asian component emerges which is highest in Arabia and East Africa. I could've called this Red Sea, but I've reserved this name for a similar component that emerges at higher K.
It is clear that this is the main Caucasoid component present in East Africa.
It vanishes to non-existence in the Northern fringe of Europe, in the British Isles, Scandinavia, and among the Finns and Lithuanians.
Another interesting aspect of its distribution is its presence in Pakistan but not India. Perhaps, in this case, it reflects historical contacts between the Islamic Near East and parts of South Asia.
 At K=8, we observe most of the familiar components from the K=10 analysis of the Dodecad Project. However, the use of the framing populations has meant that these components emerge before either Africans or East Eurasians split.
Now, the South Asian component appears, which swallows up most of the E/S Asian component that previously linked South with East Asians. This component extends a great way to the Near East and eastern parts of the Caucasus.
Quite interestingly, the remainder of the Caucasoid component in South Asia that is not absorbed by the new South Asian component seems to be split between the West Asian and North/Central European components, with an absence of the South European component.
It is among the Lezgins of the Caucasus that such a combination occurs, on the western shore of the Caspian Sea. The same combination of Caucasoid components also occurs in Uzbeks and Chuvash.
I conclude from this that the Caucasoids who entered South and Central Asia were probably derived from the eastern fringes of the Caucasoid world where only the West Asian (in the south) and North/Central European (in the north) are in existence. The area around the Caspian Sea seems like an excellent candidate for their origin, as I have speculated before, as that region has two important properties:
- It is transitional between predominantly N/C European populations to the north and predominantly W Asian populations to the south
- It is the border of the influence of the S European element, with Georgians possessing some of it, while Lezgins do not.
 At K=9, we see the emergence of specific Sardinian and Basque components. Normally this is undesirable, but, I believe this breakup serves to divide the previously inferred South European component meaningfully.
What was South European in lower K seems to have an Atlantic vs. Mediterranean dimension, with the Basque/Sardinian ratio being particularly high in the Atlantic facade of Europe. Conversely, this ratio is low in the Mediterranean as we move eastwards: it is already low in Italy and the Balkans and becomes virtually zero in Cypriots, Armenians, and Levantine Arabs.
North Africa is also particularly interesting in having a low Basque/Sardinian rate, even in Morocco. It appears that Sardinians are a much better proxy of European influences in the region than Basques are.
 K=10 is particularly exciting because, for the first time, there is clear evidence of structure in the North/Central European component that can now be split, for the first time, into Northwestern and Northeastern ones.
The NW European component is maximized in Orcadians, and people from the British Isles in general, as well as in Scandinavia. These populations have a low NE/NW ratio, as do the French, Iberians, and Italians.
Conversely, Balto-Slavs have a high NE/NW ratio.
Interestingly, Greeks have a balanced NE/NW ratio (1.2), intermediate between Italians and Balto-Slavs. Similar balanced ratios are also found among Lezgins (1.08), Turks, and Iranians. I conclude that Slavic or other Eastern European admixture cannot account for the totality of presence of this component in Greeks.
Indians have a 1.8 NE/NW ratio. In Pakistan this is 6.5, in Uzbeks it is 2.9, and in the North Eurasian_Ra it is 14.2. My conclusion is that a single migration of steppe people from eastern Europe cannot account for the presence of North European-like genes in Asia.
I propose that a palimpsest of population movements has brought such elements into the interior of Asia: the migration of the early Indo-Iranians from West Asia or the Balkans with a balanced NE/NW ratio, and, the migration of steppe people from Eastern Europe with a high NE/NW ratio. The latter, did affect much of Asia, but it is in India, where Iranian groups did not penetrate in great numbers the lower ratio of the Indo-Aryans has been best preserved.
The case of the Finns is also interesting, as there is a surplus of NE over NW European elements. Their position is intermediate between Scandinavians and Lithuanians/Russians but toward the latter. So, Finns appear to (i) have a substratum similar to Balto-Slavs, (ii) to be influenced by Scandinavians, and (iii) with a balance of East Eurasian elements (5.8% at this analysis) preserving the legacy of their linguistic ancestors from the east. At present it is difficult to determine how much of the NE European component in Finns is due to their eastern ancestors who were presumably mixed Caucasoid/Mongoloid long before they arrived in the Baltic, and how much was absorbed in situ.
 At K=11 the Ethiopian/East African component emerges, absorbing some of the Red Sea and Sub-Saharan components from the previous K=10 run.
In comparison to the East African component of the Dodecad Project analysis, this component is closer to West Eurasians than to Sub-Saharan Africans, and a residual Sub-Saharan element remains in the two East African (Ethiopian and East_African_D) population samples. Presumably this is due to the more complete sampling of Sub-Saharan genetic diversity using the Sub_Saharan_H "framing" population.
Outside Africa, both E African/Sub-Saharan components are present in the Near East and North Africa with higher E African/Sub-Saharan ratios in the Near East and lower ones in North Africa.
In Europe, there are low such ratios in the few populations where African admixture is present, together with some N African. We can probably conclude that African admixture is mostly due to North Africans, and African-influenced Near Eastern populations, rather than directly from Sub-Saharan Africa.
At K=12 the first uninformative cluster emerged, centered on Iraqi Jews, hence I decided to stop the analysis at this point.
Population Portraits
There is a plethora of population portraits in the download bundle, showing how admixture proportions vary in individuals within populations, and how they vary between successive K.
 Here is, for example, the K=11 portrait of Cypriots. A picture of overall homogeneity of this sample emerges, but notice how the NW European and NE European have disjoint presence in the Cypriot individuals, with 5 having some of the former, 6 having some of the latter, and only 1 of these having both.
 Compare with Lezgins (right) where these two components occur in all individuals. Whatever this admixture represents, it must be old enough if it is so uniformly distributed in the population.
Here are the Georgians at K=10. Notice that their NE European component is unevenly distributed, and in every case where it occurs it is accompanied by a thin slice of East Asian. This may well indicate partial Russian or other Eastern European ancestry in these individuals.
Side-by-side comparisons are also quite useful. Consider Armenians vs. Lezgins vs. Iranians at K=7


 Notice how Lezgins, who live north of the Caucasus mountains possess some of the N/C European component, which the Armenians, who live to the south of them lack. This should come as no surprise, as the Lezgins inhabit parts of the ancient Sarmatia Asiatica. Compare with Iranians, who are differentiated by their Indo-European Armenian neighbors by the presence of a "S Asian" component, which, in turn, ties them to their Indo-Aryan linguistic relatives.
Much more can be said, but I'll let readers explore the data on their own, and draw their own conclusions from them.
June 09, 2010
Genome-wide structure of Jews (Behar et al. 2010)
(Last Update: Jun 10)
Another comprehensive new study on Jews (after Atzmon et al. 2010). The paper also has freely available supplementary information online.
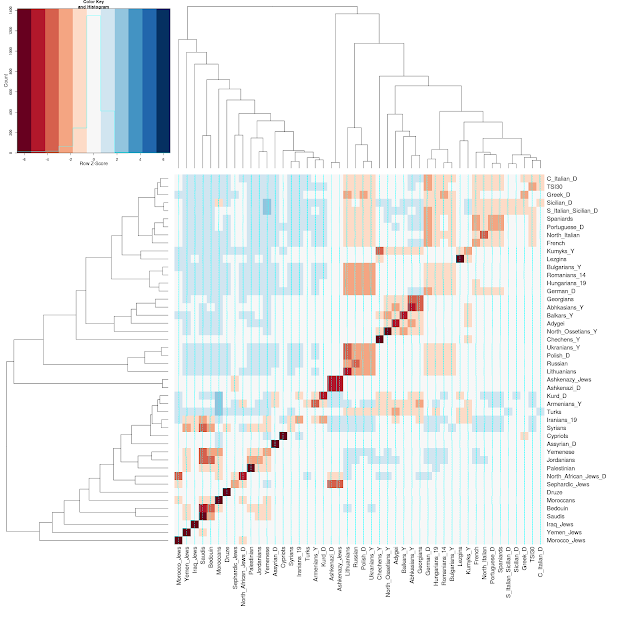
 On the left, PCA from Supplementary Figure 3, shows clearly at least three different Jewish clusters. Note the main Ashkenazi/Sephardi cluster halfway between Tuscans and Near Eastern populations, a Yemeni Jewish cluster coinciding with Bedouins and Saudi Arabians, and a West Asian cluster encompassing Georgian, Iranian, Iraqi, etc. Jews.
Below is ADMIXTURE analysis in the global context.
There is a ton of information in the above figure, for Jews and non-Jews alike. Some observations:

- Ethiopians and Ethiopian Jews look identical, between Sub-Saharan Africans and West Asians .
- Sub-Saharan admixture in Egyptians and Yemenites is quite evident; lack of such admixture in Europe and non-Arabs from West Asia.
- A little Caucasoid admixture in Mongols
- Split of Mongoloids into two clusters, which appear to be "northern" and "southern"
- Central Asian Turkic speakers (Uygur, Uzbek) derived from both Mongoloid sub-clusters; their Caucasoid components are mainly West Asian (light green) rather than north European (dark blue)
- Non-European components in Russians are resolved into Caucasoid light green and "north Mongoloid" (see above)
- A little of the "north Mongoloid" component in Turks and some populations from the Caucasus, not much elsewhere in West Eurasia
- South Asian (green) component in Cambodians
- Russians and Lithuanians lack south European (light blue) component but have some west Asian (light green)
- Cypriots are split between West Asia and Southern European components, with minority Semitic (Phoenicians or Syrian Christians?) and northern European ones.
- French Basque and Sardinians lack West Asian component (light green)
The regional ADMIXTURE analysis is also quite enlightening.

UPDATE I (Jun 10):
What does this study actually tell us about the origins of modern Jews? Are they descended from ancient Jews, and to what degree did they admix with non-Jewish populations either in West Asia or elsewhere?
The smoking gun of an ancestral Jewish gene pool is still missing. Note, for example, the emergence of a "purple" Mozabite cluster in the global ADMIXTURE analysis, or of three distinct Palestinian- Druze- and Bedouin- centered clusters in the regional analysis.
If modern Jews are descended from an ancient Jewish population, we would expect the emergence of such a Jewish-centered component in the ADMIXTURE analysis. Such a component would be centered on Jews but might also spill out to some degree to other populations.
Rather, Jews appear to be variable mixtures of three components (in the regional figure): pink, which is shared by them and Arab speakers; very light blue, which is shared by them and non-Arab West Asians and south Europeans; medium blue, which is centered on southern Europe.
The lack of a Jewish-centered cluster could be either due to a lack of a common core of shared ancestry in various Jewish groups, or to a lack of sufficient resolution in the genetic markers used. There is a common thread among Jewish groups (the pink element), but it is not specific to them.
Nonetheless, we can credit the two new studies with shrinking our universe of viable hypotheses: Ashkenazic Jews don't appear to be either Khazar or converted Slavs/Germans; Iraqi Jews don't appear to have any noticeable Arab-specific ancestry; the Jewish origin of Ethiopian Jews is a fable; Ashkenazic and Sephardic Jews appear to be closely related; and so on.
UPDATE II (Jun 10):
Supplementary Table 4 (pdf) has Y chromosome data for a wide assortment of populations. I find quite interesting the lack of E-M35 chromosomes in Georgian Jews (N=62) and Azerbaijani (N=57) Jews.
UPDATE III (Jun 10):
Notice how different Russians look in the global and regional analyses. In the former, they break down into three components (N/E European dark blue, W/C/S Asian light green, north Mongoloid), while in the latter they appear to have some of the S European light blue.
This should be useful as a cautionary tale to what happens when the full range of parental populations are not present: spurious results can appear.
UPDATE IV (Jun 10):
Consider Figure 2 from the paper:

Jews form three major clusters: one between West Asia and Europe (Ashkenazim and Sephardim); one right in the middle of West Asia (Caucasus Jews and Iranian Jews), and one in the middle of Arabs (Yemenite Jews).
The authors write:
This study further uncovers genetic structure that partitions most Jewish samples into Ashkenazi–north African– Sephardi, Caucasus–Middle Eastern, and Yemenite subclusters (Fig. 2). There are several mutually compatible explanations for the observed pattern: a splintering of Jewish populations in the early Diaspora period, an underappreciated level of contact between members of each of these subclusters, and low levels of admixture with Diaspora host populations.
It is difficult to see how splintering of Jewish populations in the early Diaspora period would result in the observed pattern. In such a scenario, we would expect European Jews to form a separate cluster from Yemenite and Middle Eastern Jews, but we would not expect the differences to be in the direction of the host populations.
It is also not clear why there should be "an underappreciated level of contact" between these subclusters: the fact that they are distinct suggests that there was not much contact, otherwise we would see "intermediate individuals" between the various clusters, which is not the case. Whatever the historical intermarriage across Jewish subgroup boundaries, it must've been low: both the distinctiveness of the three clusters, and the absence of individual variation in ancestral proportions within subgroups suggests that each of the three groups did not admix heavily (recently) with either Jews from elsewhere or non-Jewish host populations.
The evidence as it stands is indicative of relative isolation of three distinct subgroups of Jews in Western Eurasia. What the original makeup of these subgroups was (the Jewish-native mix), prior to isolation, is still up for grabs.
UPDATE V (Jun 10):
It would be tempting to see an Arab-Persian distinction in the neat arraying of West Asian populations in the PCA figure of the previous update with Bedouins and Persian-Caucasian populations occupying the different ends of the spectrum. However, that would be erroneous, I think, as it omits the crucial parameter of Sub-Saharan admixture.
Here is a magnification of the West Eurasian portion of the global PCA (Figure 1 from the paper):

"South" is towards Sub-Saharans and "East" is towards East Asians. Just as the ADMIXTURE analysis suggests, Arabs deviate towards the Sub-Saharan direction. Thus, Persian-Arab distinctions are not necessarily an indication only of differences between these two groups, but also of the presence of variable Sub-Saharan admixture in Arabs.
The global ADMIXTURE indicates why this is the case: Iranians have very little "Semitic" pink and no visible Sub-Saharan admixture, while Arabs have a little Sub-Saharan admixture, which, because of the great genetic distance between Sub-Saharan Africans and West Eurasians, pulls them apart substantially from the Caucasoid cluster.
Indeed, Arabians are intermediate between Caucasoids and East Africans, while the latter are intermediate between Arabians and Sub-Saharan Africans.
Nature doi:10.1038/nature09103
The genome-wide structure of the Jewish people
Doron M. Behar et al.
Contemporary Jews comprise an aggregate of ethno-religious communities whose worldwide members identify with each other through various shared religious, historical and cultural traditions1, 2. Historical evidence suggests common origins in the Middle East, followed by migrations leading to the establishment of communities of Jews in Europe, Africa and Asia, in what is termed the Jewish Diaspora3, 4, 5. This complex demographic history imposes special challenges in attempting to address the genetic structure of the Jewish people6. Although many genetic studies have shed light on Jewish origins and on diseases prevalent among Jewish communities, including studies focusing on uniparentally and biparentally inherited markers7, 8, 9,10, 11, 12, 13, 14, 15, 16, genome-wide patterns of variation across the vast geographic span of Jewish Diaspora communities and their respective neighbours have yet to be addressed. Here we use high-density bead arrays to genotype individuals from 14 Jewish Diaspora communities and compare these patterns of genome-wide diversity with those from 69 Old World non-Jewish populations, of which 25 have not previously been reported. These samples were carefully chosen to provide comprehensive comparisons between Jewish and non-Jewish populations in the Diaspora, as well as with non-Jewish populations from the Middle East and north Africa. Principal component and structure-like analyses identify previously unrecognized genetic substructure within the Middle East. Most Jewish samples form a remarkably tight subcluster that overlies Druze and Cypriot samples but not samples from other Levantine populations or paired Diaspora host populations. In contrast, Ethiopian Jews (Beta Israel) and Indian Jews (Bene Israel and Cochini) cluster with neighbouring autochthonous populations in Ethiopia and western India, respectively, despite a clear paternal link between the Bene Israel and the Levant. These results cast light on the variegated genetic architecture of the Middle East, and trace the origins of most Jewish Diaspora communities to the Levant.
Link
January 11, 2010
Guess the origin of these four composites
ANSWER (15/1/2010):
Russian, Cypriot
Romanian, Spanish
END ANSWER
You can guess their country of origin, language group (e.g., Slavic, Germanic, Romance, Finno-Ugrian, Greek, etc.), geographical origin (N/S/W/E Europe or W/S/C Asia), or whatever else you can intuit about them.


May 02, 2009
Supplement on Global distribution of genomic diversity (Auton et al. 2009)
I had blogged about this paper in February, and now I've had the opportunity to look at the supplementary data (pdf) that has just appeared. Read the original post for some background on this study.
Figure S3 contains the results of the STRUCTURE analysis (from K=2 top row). The broad results are consistent with similar past analyses, but many populations that were previously not examined in the global context are included. You can probably discern many interesting features with your magnifying glass, but I will limit myself to a handful:

Table S5 shows the percentage of haplotypes shared between different European regions and the African Yoruba (YRI) sample.
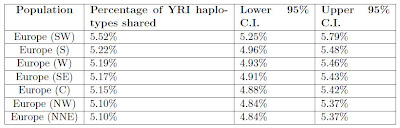 Most European regions are within 0.12% of each other, but Southwest Europe has an elevated percentage of 5.52% of 0.3% higher than the next highest percentage. Thus, the hypothesis of a separate influence in Iberia from Africa that did not pass from east-to-west seems reasonable.
However, the STRUCTURE analysis (see above) does not indicate a substantial presence of the Yoruba (dark green) element anywhere in Europe, consistent with the recent paper of Tishkoff et al. It appears more likely that the similarity is due to a (as of yet unsampled) element common to both populations, perhaps of North African or other intermediate origin.
In conclusion, this is a very interesting paper (of great interest for South Asia and the Americas as well, not covered in my post), as it furthers our understanding of the global distribution of genetic diversity. It would be wonderful to combine such a comprehensive global dataset with the substantial African one of the Tishkoff paper, but unfortunately the different types of markers genotyped make it at present impossible.
Figure S3 contains the results of the STRUCTURE analysis (from K=2 top row). The broad results are consistent with similar past analyses, but many populations that were previously not examined in the global context are included. You can probably discern many interesting features with your magnifying glass, but I will limit myself to a handful:

- Greeks from northern Greece (#15) and Cyprus (#9) appear fairly unremarkable in their genetic makeup; indeed most Europeans appear similar in this broad global context
- The small sample of 4 Turks (#38) shows a small membership in "Asian" clusters, although these appear to be mostly of the "Central/South Asian", rather than the "East Asian" variety. This probably makes them similar somewhat to the Adygei from the Caucasus in a previous analysis. This element does not, however, seem to be very important in Near Eastern Semitic populations included in the HGDP panel, so it would be interesting to see how the transition from European to Central/South Asian Caucasoids occurs in Transcaucasia, Iran, and the various -stans.
- CEU Utahns seem to lack the "purple" component altogether (bottom row), and in this they are most similar to Britons and Iberians, perhaps signifying a peculiarity of Western-most populations in Europe.
Table S5 shows the percentage of haplotypes shared between different European regions and the African Yoruba (YRI) sample.
 Most European regions are within 0.12% of each other, but Southwest Europe has an elevated percentage of 5.52% of 0.3% higher than the next highest percentage. Thus, the hypothesis of a separate influence in Iberia from Africa that did not pass from east-to-west seems reasonable.
However, the STRUCTURE analysis (see above) does not indicate a substantial presence of the Yoruba (dark green) element anywhere in Europe, consistent with the recent paper of Tishkoff et al. It appears more likely that the similarity is due to a (as of yet unsampled) element common to both populations, perhaps of North African or other intermediate origin.
In conclusion, this is a very interesting paper (of great interest for South Asia and the Americas as well, not covered in my post), as it furthers our understanding of the global distribution of genetic diversity. It would be wonderful to combine such a comprehensive global dataset with the substantial African one of the Tishkoff paper, but unfortunately the different types of markers genotyped make it at present impossible.
July 21, 2008
How Y-STR variance accumulates: a comment on Zhivotovsky, Underhill and Feldman (2006)
An important erratum for this post.
Additions to this entry at the bottom (last update July 29)
In recent years, in most population genetics papers, an evolutionary mutation rate for Y chromosome microsatellites (STRs) of 0.00069/locus/generation has been used. This rate was proposed by Zhivotovsky et al. (2004) (pdf), and defended in Zhivotovsky et al. (2005), and especially Zhivotovsky, Underhill and Feldman (2006) (henceforth Z.U.F.)
This mutation rate is smaller than the observed germline mutation rate by a factor of 3-4. The germline mutation rate is observed by counting mutations directly, e.g., in father-son pairs, or in known pedigrees. Zhivotovsky et al. have provided two pieces of evidence in favor of their evolutionary rate:
Methodology
The following assumptions, following Z.U.F. are made:
Patriarch vs. MRCA
A consequence of the time-forward methodology of simulation, is that a Patriarch may not be the Most Recent Common Ancestor (MRCA) of his descendants g generations into the future. Trivially, if a Patriarch has only one son, then, that son -not the Patriarch- is the MRCA of his descendants. But, even if the Patriarch has many sons, and his group of descendants grows, it is possible (due to randomness of the fathering process) that at some generation only 1 descendant will survive.
Suppose that the Patriarch has lived in generation 0, and the MRCA lived in generation i. Thus, STR variance in the descendants at generation g (today) has accumulated over a time span of g-i generations, since, of course, at the generation i (of the MRCA), STR variance is zero.
Now, if we use a time-forward methodology from known foundation events (e.g. the arrival of the Roma in Bulgaria, or the Maori in New Zealand), it is perfectly right to see how STR variance accumulates from the known foundational event. We would then divide the accumulated STR variance by the known time span to determine an effective evolutionary mutation rate, similar to Zhivotovsky et al. (2004).
But, when the foundational event is unknown, when we are trying to estimate its age, then we can only go as far back as the MRCA, since at his time variance is zero. Therefore, by dividing accumulated variance with the evolutionary mutation rate of Z.U.F., we are over-estimating the time to the MRCA.
For example, with g=100, the average STR variance for the descendants of N=10,000 Patriarchs is 0.0755. But, if we average only those Patriarchs who are also the MRCA of their descendants, we obtain a value of 0.0824, or about 9% higher.
In general, the over-estimate (as a percentage) decreases as g increases: as g increases, the average number of descendants of a Patriarch increases, making them much less susceptible to a variance-reset type of bottleneck described here.
Thus, while the age difference between the MRCA and the Patriarch is real, its effect in the age estimate is not very pronounced. There is, however, a second, and much more serious problem, with the Z.U.F. rates when applied to evolutionary studies.
Prolific vs. Non-Prolific Patriarchs: an Observation Selection effect
Patriarchs starting at generation 0 will have a very variable number of descendants at generation g. By averaging over all of them, we are estimating the average STR variance in the descendants of men who lived g generations ago.
Now, consider how this average changes if we average only over the k most "prolific" men (with the most descendants) out of all the N=10,000 Patriarchs:
It is clear that the STR variance in the descendants of the most "prolific" Patriarchs is much higher than in the descendants of the least "prolific" ones. In fact, for the most prolific Patriarchs, variance accumulates near the germline mutation rate, and not at the lower evolutionary effective rate.
Below is the cumulative percentage of the descendants of the k most prolific Patriarchs, with k from 1 to N.
 It can be seen that e.g., from the most prolific half of the Patriarchs stems 84% of the descendants. And this, assuming no social inequality in the number of progeny, i.e. each man having the exact same average probability (m=1) of fathering a son. Thus, in reality, the more prolific Patriarchs may have an even larger fraction of the descendants.
Why is this important? Because, in population studies, scientists are likely observe (in the finite samples they collect) multiple descendants only of the most prolific of the Patriarchs. Thus, for the vast majority of the Patriarchs with few descendants, we are likely to sample no, or few of their descendants.
This means that there is an inherent observation selection effect in the types of Patriarchs we are likely to study: they are much more likely to be among the prolific ones. Coupling this observation with the knowledge that STR variance in the descendants of prolific Patriarchs accumulates near the germline mutation rate (0.69µ for the 100 most prolific ones in my experiment), we, once again, conclude that the STR variance in haplogroups likely to be made the object of scientific study accumulates near the germline mutation rate, and at the very least, faster than the evolutionary rate of Z.U.F.
Closing Remarks
Z.U.F. have also proposed two additional demographic scenaria under which a higher effective mutation rate would be observed:
Moreover, it is reasonable to assume that in stratified human societies, a few males, (leaders, or conquerors), or groups of closely related males may have generated a disproportionate number of descendants in the short-term.
In summary:
1 Z.U.F. used a germline mutation rate of µ=0.001. For the purposes of simulation, this is not an important difference, as they themselves note. I choose the rate of 0.0025 because it is closer to the actual human germline mutation rate for STRs.
2 Z.U.F. generated 50,000 men and then averaged over the men who had descendants. I, on the other hand, generate as many men as it takes to harvest at least N men with descendants, to ensure that I average a substantially large number of such men.
Editorial change (Jul 22): erroneously written "exceeds",in paragraph 2, changed to "is smaller than".
Update (July 23):
To further elucidate how the observation selection effect may make lineages seem older than they really are, I carried out another small experiment (g=110, N=10,000, m=1).
The age of each group is inferred by dividing the accumulated variance by the evolutionary rate of 0.0006944 (=μ/3.6).
The average variance over all N in this experiment is 0.0867, thus, the average inferred age is 125 generations, close to the truth (110 generations), allowing for the correction in age between the Patriarch and the TMRCA.
However, if we calculated the average variance over ten groups of 1,000 lineages (out of all N=10,000) according to the number of descendants, we see, as described above, that more "prolific" lineages have accumulated more variance, whereas less "prolific" ones have accumulated less variance than the overall average of 0.0867.
 Thus, over the 10% most populous lineages (right of the figure), the average inferred age is 209 generations, or a 90% overestimate of the true age!
But, as I mentioned, it is precisely these populous lineages (which don't just have "some" descendants today, but thousands and millions of them) that are likely to be studied, because they are the only ones that have enough representatives in a sample of 100-1,000 men, typically seen in a population study, to allow for an age estimate via a variance calculation.
Update (July 24): Haplogroup sizes
The number of a Patriarch's descendants after g generations is a random variable which depends on the parameters m (the population growth constant), and g, the number of generations.
Scientists typically look at haplogroups with thousands or millions of existing members. Are such haplogroups produced in the types of simulations performed by Z.U.F.?
I estimate the average size of the haplogroups of the haplogroups produced by Z.U.F. for different g=10,20,...,700 and m=1.

It is evident that this number increases linearly with g at a rate estimated to be 0.5/generation [This was also noted by Z.U.F. who state: "the average size of the surviving haplogroups increased each generation by a value rapidly approaching 0.5"] However, this means, that the average haplogroup at 700 generations has a size of ~350 men.
Thus, not only is the average variance estimated by Z.U.F. inappropriate because of an observation selection effect (averaging over small and large haplogroups alike), but it seems to miss the relevant observations altogether, i.e. the really large haplogroups numbering in the hundreds of thousands or millions. Yet it is precise for such large haplogroups that it has often be used in the literature.
How can we produce "realistic" haplogroup sizes, close to those likely to become an object of scientific study in contemporary human populations? We can either:
Indeed, Z.U.F. produce some such large haplogroups in some of their simulations (Fig. 1 asterisks, Fig. 2 squares/diamonds), all of which show -predictably- a higher effective rate than their 3.6x slower rate.
They caution against such large haplogroup sizes ["population size exceeds 1 million by generation 1000, which is not realistic for many local tribes."]. Granted, -- if one looks at local tribes never growing to large numbers.
And yet, some or all of the co-authors of Z.U.F. did not limit their use of the 3.6x slower rate to local tribes: Cinnioglu et al. 2004 (pdf), Sengupta et al. (2006), King et al. (2008) all apply the 0.00069 rate for populations (and haplogroups) that have grown to much more than 1 million in less time, thus overestimating severely their age.
Update (July 24): Variance of a large haplogroup
Following the previous observations, naturally, I wanted to see for myself what the STR variance of an ancient lineage with a large number of modern descendants actually looks like. My target size is 1,000,000, which is about 20% of modern Greek males.
I consider two cases:
I harvest N=1,000 haplogroups for each of these cases. I set the growth constant at m=1.100694 for the Bronze Age, and m=1.039122 for the Neolithic. This ensures that enough "large" haplogroups will be generated during simulation. Naturally, the overall population grows at a smaller rate, but the successful lineages will grow much faster than the population average.
Note that I harvest only haplogroups whose MRCA lived in the specified time span. Also, I harvest haplogroups whose final size is between 750,000 and 1,250,000 to match my target size of 1,000,000. Indeed, the average size of the harvested haplogroups is 964,327 for the Bronze Age, and 979693 for the Neolithic.
Here are the results:
Let's look at some concrete examples of age estimates in the literature, where I compare my own (first) estimates with the published ones. Here is how my estimates are derived:
For a Bronze Age ancestor (g=120) it is: 0.269 =(approx) 0.9 μg
For a Neolithic ancestor (g=300) it is: 0.629 =(approx) 0.84 μg
Thus, the correction multiplier, if the variance is between 0.269 and 0.629 is between 0.84 and 0.9; I will use the midpoint 0.87. If the variance is less than 0.269, then I use 0.9. If the variance is more than 0.629 then I use 0.84. Of course, the correction factor could be expressed more accurately as a function of the variance.
Note that the generation length preferred by these authors is 25, by me it is 30. All ages are ky BC.
Cinnioglu et al. (2004)
In this paper, an evolutionary rate of 0.0007 is used.
E-M78 is dated to 400BC, only a couple of centuries after the historical Greek colonization. E-M78 reaches its maximum in the Peloponese, a major source of Greek colonists.
I-P37 and J-M12 are dated to 1,100BC and 1,200BC, at around the time that e.g. the Phrygians from the Balkans are believed to have migrated to Asia Minor. I-P37 and J-M12 reach their maxima in areas north of Greece where the Phrygians are said to have originated.
Sengupta et al. (2006)
Thus, all the exogenous West Asian lineages in India have post-Neolithic ages, with R-M17 having a suggestive age of 1,500BC coinciding with the suggested date for the Indo-Aryans.
King et al. (2008)
These are very localized samples, so they should not be interpreted as reflecting expansion times in Greece itself, however, they do suggest a Bronze Age expansion of E-V13 and a much later arrival of E-V13 in Crete.
Note that for Crete, the 1,000,000-haplogroup size assumption is a substantial overestimate, so my age estimates are also substantial underestimates.
Update (July 25): R-M17 in South Siberia
Derenko et al. (2006) "Contrasting patterns of Y-chromosome variation in South Siberian populations from Baikal and Altai-Sayan regions" calculate the variance of R-M17 chromosomes in South Siberia, using the Z.U.F. rate, arriving at an age of 11.3kya corresponding to a value of 0.31. This corresponds to 2,300BC according to my estimate (see previous update).
Recently Bouakaze et al. (Int J Legal Med (2007) 121:493–499) reported the presence of R-M17 chromosomes in ancient inhabitants of South Siberia and the Andronovo culture (2,500BC-1,500BC).
The Andronovo culture is widely believed to be of Eastern European ultimate origin, reflecting the eastward movement of the Kurgan culture, and is associated by some with the ancestors of the Indo-Iranians.
In the Balkans, again in Z.U.F. years, the age of R-M17 is 15.8kya corresponding to variation of 0.44, corresponding to ~4,000BC according to my estimate.
Update (July 25): Baltic Y chromosomes
Lappalainen et al. (2008) use the Z.U.F. rate to estimate the antiquity of lineages in the Baltic region. Dates are ky BC.
1,000BC for I1a in the Baltic region is within the time frame of the emergence of the Germanic people who did experience a strong demographic growth.
1,500BC for N3 shows a rather late time for Finno-Ugrians. However, it must be noted that smaller demographic sizes would impose more drift, and hence a slower accumulation of variance. Therefore, this time is probably underestimated.
1,900BC for R1a1 is consistent with the northern edge of the expansion of R1a1. Once again, reduced variance may also be influenced by smaller population numbers, making this a possible underestimate.
Update (July 25): Southeastern Europe (the Balkans)
Pericic et al. (2005) use the Z.U.F. rate to estimate ages of Y-chromosome lineages in the Balkans. Dates are ky BC.
Thus, Balkan haplogroup I seems related to a Bronze Age origin, with R-M17 being substantially older, and deriving perhaps from northern Balkan Neolithic or alternatively intrusive Kurgan populations. J-M241 seems to be quite young, similar to J-M12 in Nea Nikomedeia (see discussion of King et al. (2008) above).
The young ages of J-M12 and J-M241 also explain the striking inverse correlation between it and J-M410, which makes sense if it expanded later. A fairly late expansion also explains its under-representation in Southern Italy and Anatolia: it appears to be a rather young and "Epirotic" clade that was too late in coming to significantly participate in the historical Greek colonization.
Update (July 26): E3b in Cyprus and Southern Italy
Capelli et al. (2005) [Population Structure in the Mediterranean Basin: A Y Chromosome Perspective] study Y-chromosome variation in many Mediterranean populations including Cyprus. I use a mutation rate of 0.0018 for the six markers used in this study (Quintana-Murci et al. AJHG 68(2) pp. 537 - 542 ). Ages are in ky BC.
I come up with an age of 1.4ky BC for E3b in Cyprus, which is consistent with Mycenaean and later Greek settlements on the island.
I also looked at Southern Italian Y chromosomes. I removed those with values other than (13,12) in DYS19,DYS388), since these are universal in Greek E-V13, in order to remove possible contamination from non E-V13 chromosomes. The resulting age is 900BC, once again very close to the historical Greek colonization of Magna Graecia.
July (26): A more elaborate population growth model
Z.U.F. also propose (Fig. 2 triangles) a more elaborate population growth with:
I ran a simulation (g=1000, N=10,000) with this population growth model. The average size of the descent groups of the MRCAs is 692,982 men. Averaged all of them, variance is 1.37.
Thus, one can estimate that STR variance since the time of the MRCA accumulates at a rate of ~0.75μ / generation.
And, yet, the 0.00069 rate has been used to date Paleolithic events, e.g., by Semino et al. (2004) [Am. J. Hum. Genet. 74:1023–1034, 2004], leading to general age overestimates.
Update (July 29)
My discussion is continued in Haplogroup sizes and observation selection effects (continued)
Additions to this entry at the bottom (last update July 29)
In recent years, in most population genetics papers, an evolutionary mutation rate for Y chromosome microsatellites (STRs) of 0.00069/locus/generation has been used. This rate was proposed by Zhivotovsky et al. (2004) (pdf), and defended in Zhivotovsky et al. (2005), and especially Zhivotovsky, Underhill and Feldman (2006) (henceforth Z.U.F.)
This mutation rate is smaller than the observed germline mutation rate by a factor of 3-4. The germline mutation rate is observed by counting mutations directly, e.g., in father-son pairs, or in known pedigrees. Zhivotovsky et al. have provided two pieces of evidence in favor of their evolutionary rate:
- Study of accumalation of STR variation in populations with known founding events, namely Bulgarian Roma and Maori, in their 2004 paper.
- Simulations indicating a 3.6x discrepancy between the two rates in their 2006 paper, which is due to multiple bottlenecks in a haplogroup's history.
We need to obtain good estimates of the mutation rate in order to pinpoint in time the common ancestor of a set of Y chromosomes. A factor of 3, especially for relatively recent events may correspond to a difference between early historical and late Paleolithic events.Thus, I decided to look into the matter myself to be convinced -one way or another- of what the evolutionary mutation rate must be.
Methodology
The following assumptions, following Z.U.F. are made:
- A man has 0, 1, 2, ... sons according to a Poisson process with mean m=1.
- A step mutation (increase or decrease by 1 repeat) occurs with a mutation rate of µ=0.00251
- STR variance of the man's descendants is measured after g generations.
Patriarch vs. MRCA
A consequence of the time-forward methodology of simulation, is that a Patriarch may not be the Most Recent Common Ancestor (MRCA) of his descendants g generations into the future. Trivially, if a Patriarch has only one son, then, that son -not the Patriarch- is the MRCA of his descendants. But, even if the Patriarch has many sons, and his group of descendants grows, it is possible (due to randomness of the fathering process) that at some generation only 1 descendant will survive.
Suppose that the Patriarch has lived in generation 0, and the MRCA lived in generation i. Thus, STR variance in the descendants at generation g (today) has accumulated over a time span of g-i generations, since, of course, at the generation i (of the MRCA), STR variance is zero.
Now, if we use a time-forward methodology from known foundation events (e.g. the arrival of the Roma in Bulgaria, or the Maori in New Zealand), it is perfectly right to see how STR variance accumulates from the known foundational event. We would then divide the accumulated STR variance by the known time span to determine an effective evolutionary mutation rate, similar to Zhivotovsky et al. (2004).
But, when the foundational event is unknown, when we are trying to estimate its age, then we can only go as far back as the MRCA, since at his time variance is zero. Therefore, by dividing accumulated variance with the evolutionary mutation rate of Z.U.F., we are over-estimating the time to the MRCA.
For example, with g=100, the average STR variance for the descendants of N=10,000 Patriarchs is 0.0755. But, if we average only those Patriarchs who are also the MRCA of their descendants, we obtain a value of 0.0824, or about 9% higher.
In general, the over-estimate (as a percentage) decreases as g increases: as g increases, the average number of descendants of a Patriarch increases, making them much less susceptible to a variance-reset type of bottleneck described here.
Thus, while the age difference between the MRCA and the Patriarch is real, its effect in the age estimate is not very pronounced. There is, however, a second, and much more serious problem, with the Z.U.F. rates when applied to evolutionary studies.
Prolific vs. Non-Prolific Patriarchs: an Observation Selection effect
Patriarchs starting at generation 0 will have a very variable number of descendants at generation g. By averaging over all of them, we are estimating the average STR variance in the descendants of men who lived g generations ago.
Now, consider how this average changes if we average only over the k most "prolific" men (with the most descendants) out of all the N=10,000 Patriarchs:
| k | Average Variance | |
| 100 | 0.1721 | |
| 1000 | 0.1407 | |
| 2500 | 0.1219 | |
| 5000 | 0.1033 | |
| 10000 | 0.0755 |
It is clear that the STR variance in the descendants of the most "prolific" Patriarchs is much higher than in the descendants of the least "prolific" ones. In fact, for the most prolific Patriarchs, variance accumulates near the germline mutation rate, and not at the lower evolutionary effective rate.
Below is the cumulative percentage of the descendants of the k most prolific Patriarchs, with k from 1 to N.
 It can be seen that e.g., from the most prolific half of the Patriarchs stems 84% of the descendants. And this, assuming no social inequality in the number of progeny, i.e. each man having the exact same average probability (m=1) of fathering a son. Thus, in reality, the more prolific Patriarchs may have an even larger fraction of the descendants.
Why is this important? Because, in population studies, scientists are likely observe (in the finite samples they collect) multiple descendants only of the most prolific of the Patriarchs. Thus, for the vast majority of the Patriarchs with few descendants, we are likely to sample no, or few of their descendants.
This means that there is an inherent observation selection effect in the types of Patriarchs we are likely to study: they are much more likely to be among the prolific ones. Coupling this observation with the knowledge that STR variance in the descendants of prolific Patriarchs accumulates near the germline mutation rate (0.69µ for the 100 most prolific ones in my experiment), we, once again, conclude that the STR variance in haplogroups likely to be made the object of scientific study accumulates near the germline mutation rate, and at the very least, faster than the evolutionary rate of Z.U.F.
Closing Remarks
Z.U.F. have also proposed two additional demographic scenaria under which a higher effective mutation rate would be observed:
- A sudden jump in the size of the haplogroup after it appears
- An expanding population (m>1)
Moreover, it is reasonable to assume that in stratified human societies, a few males, (leaders, or conquerors), or groups of closely related males may have generated a disproportionate number of descendants in the short-term.
In summary:
- The age difference between the Patriarch and the MRCA indicates that Variance/0.00069 overestimates the age of the MRCA somewhat (but not very much).
- A prolific Patriarch's descendants are more likely to be sampled by scientists, and tend to have a higher STR variance. Hence, Variance/0.00069 overestimates the age of the MRCA, perhaps substantially.
- Demographic factors, such as population growth, or short-term success by related males indicates that Variance/0.00069 overestimates the age of the MRCA.
1 Z.U.F. used a germline mutation rate of µ=0.001. For the purposes of simulation, this is not an important difference, as they themselves note. I choose the rate of 0.0025 because it is closer to the actual human germline mutation rate for STRs.
2 Z.U.F. generated 50,000 men and then averaged over the men who had descendants. I, on the other hand, generate as many men as it takes to harvest at least N men with descendants, to ensure that I average a substantially large number of such men.
Editorial change (Jul 22): erroneously written "exceeds",in paragraph 2, changed to "is smaller than".
Update (July 23):
To further elucidate how the observation selection effect may make lineages seem older than they really are, I carried out another small experiment (g=110, N=10,000, m=1).
The age of each group is inferred by dividing the accumulated variance by the evolutionary rate of 0.0006944 (=μ/3.6).
The average variance over all N in this experiment is 0.0867, thus, the average inferred age is 125 generations, close to the truth (110 generations), allowing for the correction in age between the Patriarch and the TMRCA.
However, if we calculated the average variance over ten groups of 1,000 lineages (out of all N=10,000) according to the number of descendants, we see, as described above, that more "prolific" lineages have accumulated more variance, whereas less "prolific" ones have accumulated less variance than the overall average of 0.0867.
But, as I mentioned, it is precisely these populous lineages (which don't just have "some" descendants today, but thousands and millions of them) that are likely to be studied, because they are the only ones that have enough representatives in a sample of 100-1,000 men, typically seen in a population study, to allow for an age estimate via a variance calculation.
Update (July 24): Haplogroup sizes
The number of a Patriarch's descendants after g generations is a random variable which depends on the parameters m (the population growth constant), and g, the number of generations.
Scientists typically look at haplogroups with thousands or millions of existing members. Are such haplogroups produced in the types of simulations performed by Z.U.F.?
I estimate the average size of the haplogroups of the haplogroups produced by Z.U.F. for different g=10,20,...,700 and m=1.

It is evident that this number increases linearly with g at a rate estimated to be 0.5/generation [This was also noted by Z.U.F. who state: "the average size of the surviving haplogroups increased each generation by a value rapidly approaching 0.5"] However, this means, that the average haplogroup at 700 generations has a size of ~350 men.
Thus, not only is the average variance estimated by Z.U.F. inappropriate because of an observation selection effect (averaging over small and large haplogroups alike), but it seems to miss the relevant observations altogether, i.e. the really large haplogroups numbering in the hundreds of thousands or millions. Yet it is precise for such large haplogroups that it has often be used in the literature.
How can we produce "realistic" haplogroup sizes, close to those likely to become an object of scientific study in contemporary human populations? We can either:
- increase the number of initial representatives, i.e. start with many related men with identical Y chromosomes rather than just 1, or we can
- increase the population growth constant m to something higher than 1, i.e. a growing population.
Indeed, Z.U.F. produce some such large haplogroups in some of their simulations (Fig. 1 asterisks, Fig. 2 squares/diamonds), all of which show -predictably- a higher effective rate than their 3.6x slower rate.
They caution against such large haplogroup sizes ["population size exceeds 1 million by generation 1000, which is not realistic for many local tribes."]. Granted, -- if one looks at local tribes never growing to large numbers.
And yet, some or all of the co-authors of Z.U.F. did not limit their use of the 3.6x slower rate to local tribes: Cinnioglu et al. 2004 (pdf), Sengupta et al. (2006), King et al. (2008) all apply the 0.00069 rate for populations (and haplogroups) that have grown to much more than 1 million in less time, thus overestimating severely their age.
Update (July 24): Variance of a large haplogroup
Following the previous observations, naturally, I wanted to see for myself what the STR variance of an ancient lineage with a large number of modern descendants actually looks like. My target size is 1,000,000, which is about 20% of modern Greek males.
I consider two cases:
- Expansion commencing in the Late Bronze Age (g=120 or 1,600BC with a generation length of 30)
- Expansion commencing in the early Neolithic (g=300 or 7,000BC)
I harvest N=1,000 haplogroups for each of these cases. I set the growth constant at m=1.100694 for the Bronze Age, and m=1.039122 for the Neolithic. This ensures that enough "large" haplogroups will be generated during simulation. Naturally, the overall population grows at a smaller rate, but the successful lineages will grow much faster than the population average.
Note that I harvest only haplogroups whose MRCA lived in the specified time span. Also, I harvest haplogroups whose final size is between 750,000 and 1,250,000 to match my target size of 1,000,000. Indeed, the average size of the harvested haplogroups is 964,327 for the Bronze Age, and 979693 for the Neolithic.
Here are the results:
- ~1 million descendants of a Bronze Age (120 generations ago) ancestor have an STR variance of 0.269 +/ 0.087
- ~1 million descendants of a Neolithic (300 generations ago) ancestor have an STR variance of 0.629 +/- 0.156
- Bronze Age: 107.6 generations, or a 10% underestimate
- Neolithic: 251.6 generations, or a 16% underestimate
- Bronze Age: 389.9 generations, or a 225% overestimate
- Neolithic 911.6 generations, or a 203% overestimate
Let's look at some concrete examples of age estimates in the literature, where I compare my own (first) estimates with the published ones. Here is how my estimates are derived:
For a Bronze Age ancestor (g=120) it is: 0.269 =(approx) 0.9 μg
For a Neolithic ancestor (g=300) it is: 0.629 =(approx) 0.84 μg
Thus, the correction multiplier, if the variance is between 0.269 and 0.629 is between 0.84 and 0.9; I will use the midpoint 0.87. If the variance is less than 0.269, then I use 0.9. If the variance is more than 0.629 then I use 0.84. Of course, the correction factor could be expressed more accurately as a function of the variance.
Note that the generation length preferred by these authors is 25, by me it is 30. All ages are ky BC.
Cinnioglu et al. (2004)
In this paper, an evolutionary rate of 0.0007 is used.
| Variance | Cinnioglu | Dienekes | ||||
| E-M78 | 0.18 | 4.4 | 0.4 | |||
| G-P15 | 0.35 | 10.5 | 2.9 | |||
| I-P37 | 0.23 | 6.2 | 1.1 | |||
| J-M12 | 0.24 | 6.6 | 1.2 | |||
| J-M67 | 0.33 | 9.8 | 2.6 | |||
| R-M269 | 0.33 | 9.8 | 2.6 |
E-M78 is dated to 400BC, only a couple of centuries after the historical Greek colonization. E-M78 reaches its maximum in the Peloponese, a major source of Greek colonists.
I-P37 and J-M12 are dated to 1,100BC and 1,200BC, at around the time that e.g. the Phrygians from the Balkans are believed to have migrated to Asia Minor. I-P37 and J-M12 reach their maxima in areas north of Greece where the Phrygians are said to have originated.
Sengupta et al. (2006)
| Variance | Sengupta | Dienekes | ||||
| J2-M410 | 0.38 | 11.7 | 3.3 | |||
| R-M17 | 0.39 | 12 | 3.4 | |||
| R-M17 (upper caste) | 0.26 | 7.3 | 1.5 | |||
| G-P15 | 0.29 | 8.5 | 2 | |||
| J-M241 | 0.38 | 11.8 | 3.3 |
Thus, all the exogenous West Asian lineages in India have post-Neolithic ages, with R-M17 having a suggestive age of 1,500BC coinciding with the suggested date for the Indo-Aryans.
King et al. (2008)
| Variance | King | Dienekes | |||||
| J-M12 (Nea Nikomedeia) | 0.18 | 4.7 | 0.4 | ||||
| E-V13 (Sesklo/Dimini) | 0.24 | 6.6 | 1.2 | ||||
| E-V13 (Lerna Franchthi) | 0.25 | 7.2 | 1.3 | ||||
| J-M92 (Crete) | 0.14 | 3.1 | 0.1 | AD | |||
| J-M319 (Crete) | 0.14 | 3.1 | 0.1 | AD | |||
| E-V13 (Crete) | 0.09 | 1.1 | 0.8 | AD |
These are very localized samples, so they should not be interpreted as reflecting expansion times in Greece itself, however, they do suggest a Bronze Age expansion of E-V13 and a much later arrival of E-V13 in Crete.
Note that for Crete, the 1,000,000-haplogroup size assumption is a substantial overestimate, so my age estimates are also substantial underestimates.
Update (July 25): R-M17 in South Siberia
Derenko et al. (2006) "Contrasting patterns of Y-chromosome variation in South Siberian populations from Baikal and Altai-Sayan regions" calculate the variance of R-M17 chromosomes in South Siberia, using the Z.U.F. rate, arriving at an age of 11.3kya corresponding to a value of 0.31. This corresponds to 2,300BC according to my estimate (see previous update).
Recently Bouakaze et al. (Int J Legal Med (2007) 121:493–499) reported the presence of R-M17 chromosomes in ancient inhabitants of South Siberia and the Andronovo culture (2,500BC-1,500BC).
The Andronovo culture is widely believed to be of Eastern European ultimate origin, reflecting the eastward movement of the Kurgan culture, and is associated by some with the ancestors of the Indo-Iranians.
In the Balkans, again in Z.U.F. years, the age of R-M17 is 15.8kya corresponding to variation of 0.44, corresponding to ~4,000BC according to my estimate.
Update (July 25): Baltic Y chromosomes
Lappalainen et al. (2008) use the Z.U.F. rate to estimate the antiquity of lineages in the Baltic region. Dates are ky BC.
| Lappalainen | Dienekes | |||
| I1a | 5.7 | 1 | ||
| N3 | 6.8 | 1.5 | ||
| R1a1 | 8.7 | 1.9 | ||
1,000BC for I1a in the Baltic region is within the time frame of the emergence of the Germanic people who did experience a strong demographic growth.
1,500BC for N3 shows a rather late time for Finno-Ugrians. However, it must be noted that smaller demographic sizes would impose more drift, and hence a slower accumulation of variance. Therefore, this time is probably underestimated.
1,900BC for R1a1 is consistent with the northern edge of the expansion of R1a1. Once again, reduced variance may also be influenced by smaller population numbers, making this a possible underestimate.
Update (July 25): Southeastern Europe (the Balkans)
Pericic et al. (2005) use the Z.U.F. rate to estimate ages of Y-chromosome lineages in the Balkans. Dates are ky BC.
| Pericic | Dienekes | |||
| I1b* (xM26) | 8.1 | 2 | ||
| E3b1α | 5.3 | 0.9 | ||
| R-M17 | 13.8 | 3.8 | ||
| R-M269 | 9.6 | 2.3 | ||
| J-M241 (without Kosovars) | 1 | 0.8AD | ||
Thus, Balkan haplogroup I seems related to a Bronze Age origin, with R-M17 being substantially older, and deriving perhaps from northern Balkan Neolithic or alternatively intrusive Kurgan populations. J-M241 seems to be quite young, similar to J-M12 in Nea Nikomedeia (see discussion of King et al. (2008) above).
The young ages of J-M12 and J-M241 also explain the striking inverse correlation between it and J-M410, which makes sense if it expanded later. A fairly late expansion also explains its under-representation in Southern Italy and Anatolia: it appears to be a rather young and "Epirotic" clade that was too late in coming to significantly participate in the historical Greek colonization.
Update (July 26): E3b in Cyprus and Southern Italy
Capelli et al. (2005) [Population Structure in the Mediterranean Basin: A Y Chromosome Perspective] study Y-chromosome variation in many Mediterranean populations including Cyprus. I use a mutation rate of 0.0018 for the six markers used in this study (Quintana-Murci et al. AJHG 68(2) pp. 537 - 542 ). Ages are in ky BC.
I come up with an age of 1.4ky BC for E3b in Cyprus, which is consistent with Mycenaean and later Greek settlements on the island.
I also looked at Southern Italian Y chromosomes. I removed those with values other than (13,12) in DYS19,DYS388), since these are universal in Greek E-V13, in order to remove possible contamination from non E-V13 chromosomes. The resulting age is 900BC, once again very close to the historical Greek colonization of Magna Graecia.
July (26): A more elaborate population growth model
Z.U.F. also propose (Fig. 2 triangles) a more elaborate population growth with:
- m=1.002 before 400 generations
- m=1.012 from 400 to to 14 generations ago
- m=1.12 from 14 to 8 generations ago
- m=1.25 from 8 generations ago to current time
I ran a simulation (g=1000, N=10,000) with this population growth model. The average size of the descent groups of the MRCAs is 692,982 men. Averaged all of them, variance is 1.37.
- With the germline mutation rate, an estimate of 549 generations (45% underestimate)
- With the Z.U.F. evolutionary rate, an estimate of 1,988 generations (99% overestimate)
- With the germline mutation rate: 776, 747, 668 generations
- With the Z.U.F. evolutionary rate: 2,810, 2,707, 2,419 generations
Thus, one can estimate that STR variance since the time of the MRCA accumulates at a rate of ~0.75μ / generation.
And, yet, the 0.00069 rate has been used to date Paleolithic events, e.g., by Semino et al. (2004) [Am. J. Hum. Genet. 74:1023–1034, 2004], leading to general age overestimates.
Update (July 29)
My discussion is continued in Haplogroup sizes and observation selection effects (continued)
Subscribe to:
Posts (Atom)