Showing posts with label Saami. Show all posts

September 09, 2012

IE-speaking West Europeans are West Asian-admixed relative to Non-IE speaking Basques

Previous ADMIXTURE experiments have shown that the Basques differ from the Indo-European speaking Europeans primarily due to a lack of a "West Asian" genetic component most strongly represented on the highlands of West Asia, from Anatolia and the Caucasus through Iran to Baluchistan. The same component is "missing" from ancient European DNA prior to 5kya, making it a good candidate for an element present in the elusive Proto-Indo-Europeans.

I wanted to test the admixture of IE-speaking populations formally, so I used threepop as implemented in TreeMix which performs a formal f3 test of admixture. According to Patterson et al. (2012):

An important feature of this test is that it definitively shows that the history of mixture occurred in population C; a complex history for A or B cannot produce negative F3(C; A,B).
A negative Z-score of the f3 test is unambiguous evidence of admixture, but a zero or positive one does not exclude it.

I report f3 statistics of the following form:

f3(A; B, West_Asian)

where West_Asian consists of 50 random individuals drawn from the K7b West_Asian component.

The full list of populations used in this experiment can be seen below. They include two sources of Basques (from the HGDP and 1000Genomes Project, from France and Spain), as well as 22 Indo-European speaking populations from Western Europe


I set A as each of the 24 populations, and calculate f3-statistics of the form f3(A; B, West_Asian) where B is any one of the remaining 23 populations. Thus, there are 24*23 = 552 f3-statistics in total, of which  2*22 = 44 are of the form f3(IE; non-IE, West_Asian).

If my conjecture is correct, then I expect:
  1. the IE-speaking Europeans to show significantly negative f3(IE; non-IE, West_Asian) statistics
  2. the non-IE speaking Basques to show non-negative f3(non-IE; IE, West_Asian) statistics
  3. the remaining f3(IE1; IE2, West_Asian) statistics to be either negative or not, depending on different levels of West_Asian-related admixture in different IE populations associated with either the Indo-Europeans or other, later, population movements emanating from West Asia.

My expectation is confirmed by the evidence. You can see all f3 statistics in the spreadsheet. I note that:

(1) Here is a histogram of the 44 f3(IE; non-IE, West_Asian) comparisons:


42 of 44 Z-scores are negative and significant, suggesting that most  IE-speaking West European populations are West Asian-admixed relative to non-IE Basques. The two that are not, involve A='Orkney_1KG', which is a drifted island population. According to Patterson et al. (2012):
As mentioned earlier, the only case where the f3-statistic for a population that is truly admixed fails to be negative is when the population has experienced a high degree of population-specific genetic drift after the admixture occurred.
(2) All f3(non-IE; IE, West_Asian) statistics are positive. With the caveat about drift in mind, there does not seem to be any evidence that Basques are more West Asian-admixed than any other population.

(3) Here is a histogram of the 462 f3(IE1; IE2, West_Asian) statistics:


This shows evidence in differences in West_Asian admixture in some but not other IE populations. 55 of the 462 comparisons show significant evidence of admixture. These mostly involve German, French, and Italian populations vs. Iberian and British Isles ones. As mentioned above, this may reflect either the diminution of Indo-European-related West Asian ancestry across Europe, or it may be due to post-IE population movements.

Discussion

It is becoming increasingly apparent that modern Europeans are the descendants of both early Neolithic farmers, presumably from the Levant or Anatolia, as well as the indigenous Mesolithic hunter-gatherers. Neolithic ancestry has persisted most strongly in southern Europe, and in Sardinia above all. Mesolithic ancestry has persisted most strongly in northern Europe, and especially in the Baltic area; however, it is everywhere in the minority, as evidenced by the ~10-fold diminution of mtDNA haplogroup U related lineages from near 100% in the earliest samples until today.

In all probability there do not exist unmixed descendants of either early Neolithic or Mesolithic Euroeans. Intriguingly, one population that may be most strongly descended from the Mesolithic Europeans are the Saami, who possess very high levels of mtDNA haplogroup U5b. But even in their case, there is evidence of more recent influences, such as Y-haplogroup N1c.

The Saami have always been somewhat of a puzzle for prehistorians, with some attributing their physical appearance to survival of cold-adapted Paleolithic northern Europeans, while others attributing it to more recent movements from Siberia. As it is so often the case, both may have been partially right: it is now revealed that the Saami are not unique in possessing affinities with northeast Asians and Amerindians, so they are descended both from the Mesolithic northern European substratum (as evidenced by mtDNA haplogroup U5b) and from more recent Siberian peoples, and are thus positioned between east and west for more than one reason.

In the rest of Europe things were not any simpler. Both analysis of modern populations, as well as the mounting ancient DNA evidence ought to have convinced us by now that "there's something about Sardinians." It does seem to appear that this island population represents has preserved most faithfully the early Neolithic European gene pool, which, as it turns out, took its time mixing with the indigenous Mesolithic populations, since it is still evident down to the Iron Age. But, all things come to an end, and so did the domination of ancient Europe by Sardinian-like people.

In continental, and especially, northern Europe, the Neolithic inhabitants, resembling modern southern Europeans, eventually admixed with the Mesolithic foragers. A legacy of this event, as well as, possibly further incursions from the east, combined to give modern northern Europeans a greater affiliation with the east of Eurasia. But, it turns out, things were not much simpler in southern and western Europe.

The modern Basques share the East Eurasian-like admixture of continental Europeans, albeit to a smaller degree than people living in the north. They, like other Europeans are a mix of Mesolithic and Neolithic peoples. But, one thing stands out in their case: their language is not Indo-European and they live surrounded by Romance Indo-European speakers. In older times, their neighbors were Indo-European Celts, some of which have survived in places like Ireland. Further away, live Germanic peoples, some of which ventured into Iberia, without much affecting the local population. One thing is certain: the Basques can no longer be seen as unmixed descendants of Cro-Magnon man. But, if they have not continued as living fossils of Paleolithic man, then, what is to account for their linguistic peculiarity?

In the current post I make one such suggestion in the framework of my theory on the Indo-Europeanization of Europe. I showed that Basques differ from all their Romance, Celtic, and Germanic fellow West Europeans in lacking a "West_Asian" influence. I have previously investigated segments of such influence in two northern Europeans. In the future, with new instruments, such as ADMIXTOOLS, we may be able to figure out exactly when other European populations were affected by this influence. For peoples living close to West Asia (e.g., Greeks or Italians), the pattern may be obscured by recent historical contacts. But, the same will probably not be true for populations living in far Western Europe (e.g., Iberians or Irish).

If my theory is correct, then this signal will postdate the 5kya mark. By how much? It is not clear how long the Indo-Europeans of western Europe maintained themselves separately, perhaps as I have speculated, as a trading/military elite centered around metallurgy and its products. Ancient DNA research has the potential of resolving this issue by first identifying the earliest arrival of the West Asian influence, and, subsequently, detecting the first emergence of something akin to the modern population. One way or another, the cat is out of the bag, and in a the coming years many of these issues will be resolved.

August 31, 2011

ICHG 2011 abstracts are online

You can search here. I will update this entry with any interesting abstracts I've identified and my early comments on them, if any.

UPDATE:

I will add abstracts to this entry one by one, with the newer ones added to the top of the post.

Demographic histories of African hunting-gathering populations inferred from genome-wide SNP variation.
S. Soi et al.

Africa is the geographic origin of anatomically modern humans; it is also home to a third of all modern languages, including four major language families: Niger-Kordofanian, Afro-Asiatic, Nilo-Saharan, and Khoesan. Despite the importance of African populations for studying human origins and the complexity of demographic and linguistic relationships among African populations, genome-wide analyses of sub-Saharan variation have been sparse. To address this deficiency, we used Illumina 1M-Duo SNP arrays to genotype samples (N=697) from 44 sub-Saharan populations, which we supplemented with published data sets. Principal components analysis (PCA) and linear regression were used to assess the statistical effect of geography and linguistics on the partitioning of genetic variation. As ascertainment bias can distort the allele frequency spectrum, we examined patterns of linkage disequilibrium (LD), haplotype sharing, and identity by descent (IBD) to understand the demographic relationship among populations. To affirm that LD-based analyses were robust to ascertainment bias, we assessed the rank correlation of estimates of effective population size from the rate of LD decay within populations and estimates of population size based on the variance of microsatellite repeat lengths from previously published data (Spearman’s ρ=0.782, p=0.011). Additionally, the presence of long IBD tracts between individuals indicates recent common ancestry. Thus, we used the GERMLINE algorithm to infer IBD tracts between individuals in hunting-gathering populations and neighboring agriculturalist and pastoralist populations. To infer the time to most recent common ancestor and test demographic models while accounting for the confounding effects of migration and changes in population sizes, we employed Approximate Bayesian Computation (ABC) using summaries of haplotype frequency, diversity and sharing within and between populations. We report, for the first time, evidence for recent common ancestry of Ethiopian hunter-gatherers and the Kenyan Sanye/Dahalo, who speak a language with remnant clicks, with click-speaking eastern African Khoesan populations. This work supports archaeological and linguistic studies that indicate that the distribution of Khoesan speaking populations may have extended as far north as Ethiopia.
Not very surprising to me, as I detected a contribution of the "Palaeo_African" component (which has one of its peaks in San) in East Africans.

Comparative study of the Y chromosome diversity in some ethnic groups living in Iran and populations of the Middle East.
L. Andonian et al.

Background: The main goal of this study is to conduct a population genetic study of: a) Armenians living in Iran, in the context of general Armenian population; and b) Iranian Azeris, one of the biggest ethno-linguistic communities, in comparison with other Turkic-speaking populations of the Middle East (from eastern Turkey, Azerbaijan Republic and Turkmenistan). Methods: Buccal cells of 89 Armenian males from central Iran, the descendants of Armenians forcibly moved to Iran in the beginning of 17th century CE, and 105 Turkic-speaking Azeri males from north-west Iran (Tabriz) were collected by mouth swabs. The samples were screened for 12 Single Nucleotide (SNP) and 6 microsatellite markers on the non-recombining portion of the Y chromosome. The results of genetic typing were statistically analyzed using Arlequin software. Results: Iranian Armenians display a moderate level of genetic variation and are genetically closer to Western Armenians which is in agreement with historical records. Iranian Azeris demonstrate much weaker genetic resemblance with Turkmens (as putative source population) than with their geographic neighbors. Conclusion: Political, religious and geographic isolation had moderate influence on the genetic structure of modern Iranian Armenians during the last four centuries, which is expressed in lower diversity of their patrilineal genetic legacy. The imposition of Turkic language to the populations of north-west Iran was realized predominantly by the process of elite dominance,i.e. by the limited number of invaders who left weak traces in the patrilineal genetic history of Iranian Azeris.

A direct characterization of human mutation.
J. X. Sun et al.

Mutation and recombination provide the raw material of evolution. This study reports the largest study of new mutations to date: 2,058 germline mutations discovered by analyzing 85,289 Icelanders at 2,477 microsatellites. We find that the paternal-to-maternal mutation rate ratio is 3.3, and that the mutation rate in fathers doubles between the ages of 15 to 45 whereas there is no association to age in mothers. Strong length constraints apply for microsatellites, with longer alleles tending to mutate more often and decrease in length, whereas shorter alleles tending to mutate less often and increase in length. Based on these direct observations of the microsatellite mutation process, we build a model to estimate key parameters of evolution without calibration to the fossil record. The sequence substitution rate per base pair is estimated to be 1.84-2.21×10⁻⁸ per generation (95% credible interval). Human-chimpanzee speciation is estimated to be 3.92-5.91 Mya, challenging views of the Toumaï fossil as dating to >6.8 Mya and being on the hominin lineage since the final separation of humans and chimpanzees.
This microsatellite based estimate of human-chimp speciation contrasts with a recent SNP-based estimate of 7 million years.

Genetic structure of Jewish populations on the basis of genome-wide single nucleotide polymorphisms.
N. M. Kopelman

The Jewish population forms a genetically structured population, due to historical migrations and diverse histories of the various Jewish communities. Discerning the ancestry and population structure of different Jewish populations is important for understanding the complex history of the Jewish communities as well as for research on the genetic basis of disease. Using >500,000 genome-wide single-nucleotide polymorphisms, we investigated patterns of population structure in 438 samples from 30 Jewish populations in the context of additional samples from non-Jewish populations. The collection of Jewish populations studied incorporates a variety of populations not previously included in other genomic population structure studies of Jewish groups (e.g. NM Kopelman et al. 2009 BMC Genet 10:80; G Atzmon et al. 2010 AJHG 86:850-859; DM Behar et al. 2010 Nature 466:238-242; SM Bray et al. 2010 PNAS 107:16222-16227; JB Listman et al. 2010 BMC Genet 11:48). We identify fine-scale population structure within the Jewish samples, including notable distinctions separating Ashkenazi, Mizrahi, Sephardi, and North African populations. Additionally, we identify distinctions within major regional groups, including a separation among the North African populations of Libyan, Moroccan, and Tunisian Jewish samples and a separation among the Mizrahi populations of Bukharan, Georgian, Iranian, and Iraqi Jewish samples. These results supply enhanced information regarding Jewish population structure, providing a basis for further detailed analysis of the genetic history of Jewish populations.
Hopefully the wealth of this new Jewish and non-Jewish data will be made publicly available.

LD patterns in dense variation data reveal information about the history of human populations worldwide.
S. Myers et al.

A detailed understanding of population structure in genetic data is vital in many applications, including population genetic analyses and disease gene mapping, and relates directly to human history. However, there are still few methods that directly utilize information contained in the haplotypic structure of modern dense, genome-wide variation datasets. We have developed a set of new approaches, founded on a model first introduced by Li and Stephens, which fully use this powerful information, and are able to identify the underlying structure in large datasets sampling 50 or more populations. Our methods utilize both Bayesian model-based clustering and principal component analyses, and by using LD information effectively, consistently outperform existing approaches in both simulated and real data. This allows us to infer ancestry with unprecedented geographical precision, in turn enabling us to characterize the populations involved in ancient admixture events and, critically, to precisely date such events. We applied our new techniques to combined data for 30 European populations sampled by us, or publicly available, and the worldwide HGDP data. We find almost all human populations have been influenced by mixture with other groups, with the Bantu expansion, the Mongol empire and the Arab slave trade leaving particularly widespread genetic signatures, and many more local events, for example North African (Moroccan) admixture into the Spanish that we date to 834-1394AD. Dates of admixture events between European groups and groups from North Africa and the Middle East, seen in multiple Mediterranean countries, vary between 800 and 1700 years ago, while Greece, Croatia and other Balkan states show signals of admixture consistent with Slavic migration from the north, which we date to 600-1000AD. At the finest scale, we are able to study admixture patterns in data gathered by a project (POBI) examining people within the British Isles. Our approaches reveal genetic differences between individuals from different UK counties, and show that the current UK genetic landscape was formed by a series of events in the millennium following the fall of the Roman Empire.
Existing methods (see comments below) for dating historical admixture events differ from each other by a factor of two, and they all assume a 2-population model. Hopefully the research described here will be an improvement, especially if it is encapsulated in an easy-to-use piece of software. It will definitely be interesting to see the evidence for Slavic admixture in the Balkans, which probably corresponds somewhat to the "East European" component discovered in the Dodecad Project which differentiates Balkan populations from their Italian and West Asian neighbors.


Evidence for extensive ancient admixture in different human populations.
J. Wall et al.

We generated whole-genome sequences from four Biaka pygmies and analyzed them along with the publicly available genomes of 69 individuals from a range of different ethnicities. We scanned each of the 73 genomes for regions with unusual patterns of genetic variation that might have arisen due to ancient admixture with an ‘archaic’ human group. While a majority of the most extreme regions were really misalignment errors, we did find hundreds of regions that likely introgressed in from archaic human ancestors, and we estimate the amount and the timing of these ancient admixture events. These regions were found in the genomes of both sub-Saharan African and non-African populations. While Neandertals are a natural source population for ancient admixture into non-Africans, the source for ancient admixture into sub-Saharan African populations is less obvious.
Wall and Hammer have been arguing for archaic admixture for years, and there's a good chance they finally found the "smoking gun" here. I've argued before that Homo sapiens was not the only species in Africa at the time of its emergence, due to the great ecological diversity of the continent, and the long adaptation of humans there. We are unlikely to ever be able to find and sequence Paleolithic non-sapiens Homo from tropical Africa, but the signal is there to be discovered in modern African hunter-gatherers.

Validating the authenticity of the pedigrees of Chinese Emperor CAO Cao of 1,800 years ago.
H. Li

Deep pedigrees are of great value for studying the Y chromosome evolution. However, the authenticity of the pedigree information requires careful validation. Here, we validated some deep pedigrees in China with full records of 70-100 generations spanning over 1,800 years by comparing their Y chromosomes. The present clans of these pedigrees claim to be descendants of Emperor CAO Cao (155AD-220AD). Haplogroup O2-M268 is the only one that is enriched significantly in the claimed clans (P=9.323×10⁻⁵, OR=12.72), and therefore, is most likely to be that of the Emperor. Moreover, our analysis showed that the Y chromosome haplogroup of the Emperor is different from that of his claimed ancestry of the earlier CAO aristocrats (Haplogroup O3-002611). This study offers a successful showcase of the utility of genetics in studying the ancient history.
This is probably the oldest attested Y-chromosome lineage currently available. Confucius next? It will be interesting to know how many likely Cao descendants there are today, as a control on the rate with which a socially-selected lineage can grow.

Exceptions to the "One Drop Rule"? DNA evidence of African ancestry in European Americans.
J. L. Mountain et al.

Genetic studies have revealed that most African Americans trace the majority (75-80%, on average) of their ancestry to western Africa. Most of the remaining ancestry traces to Europe, and paternal lines trace to Europe more often than maternal lines. This genetic pattern is consistent with the "One Drop Rule,” a social history wherein children born with at least one ancestor of African descent were considered Black in the United States. The question of how many European Americans have DNA evidence of African ancestry has been studied far less. We examined genetic ancestry for over 77,000 customers of 23andMe who had consented to participate in research. Most live in the United States. A subset of about 60,000 shows genetic evidence of fewer than one in 16 great-great-grandparents tracing ancestry to a continental region other than Europe. They are likely to consider themselves to be entirely of European descent. We conducted two analyses to understand what fraction of this group has genetic evidence of some ancestry tracing recently to Africa. We first identified individuals whose autosomal DNA indicates that they are predominantly of European ancestry, but who carry either a mitochondrial (mt) DNA or Y chromosome haplogroup that is highly likely to have originated in sub-Saharan Africa. Of the 60,000 individuals with 95% or greater European ancestry, close to 1% carry an mtDNA haplogroup indicating African ancestry. Of approximately 33,000 males, about one in 300 trace their paternal line to Africa. We then identified the subset of these European Americans who have estimates of between 0.5% and 5.0% of ancestry tracing to Africa. This subset constitutes about 2% of this set of individuals likely to be aware only of their European ancestry. The majority (75%) of that group has a very small estimated fraction of African ancestry (about 0.5%), likely to reflect African ancestry over seven generations (about 200 years) ago. We estimate that, overall, at least 2-3% of individuals with predominantly European ancestry have genetic patterns suggesting relatively deep ancestry tracing to Africa. This fraction is far lower than the genetic estimates of European ancestry of African Americans, consistent with the social history of the United States, but reveals that a small percentage of “mixed race” individuals were integrating into the European American community (passing for White) over 200 years ago, during the era of slavery in the United States.
Hopefully this was not done with 23andMe's "Ancestry Painting" that grossly overestimates European ancestry with even East Africans and South Asians often getting >90% "European". The search for non-white ancestry seems to be a favorite pastime of many people who test at 23andMe, so this could potentially bias the results; on the other hand, I've encountered many, many more people who are seeking that illusive Amerindian ancestor of family lore, so, perhaps this is not as big of a problem for the detection of African ancestry.

Estimating a date of mixture of ancestral South Asian populations.
P. Moorjani

Linguistic and genetic studies have shown that most Indian groups have ancestry from two genetically divergent populations, Ancestral North Indians (ANI) and Ancestral South Indians (ASI). However, the date of mixture still remains unknown. We analyze genome-wide data from about 60 South Asian groups using a newly developed method that utilizes information related to admixture linkage disequilibrium to estimate mixture dates. Our analyses suggest that major ANI-ASI mixture occurred in the ancestors of both northern and southern Indians 1,200-3,500 years ago, overlapping the time when Indo-European languages first began to be spoken in the subcontinent. These results suggest that this formative period of Indian history was accompanied by mixtures between two highly diverged populations, although our results do not rule other, older ANI-ASI admixture events. A cultural shift subsequently led to widespread endogamy, which decreased the rate of additional population mixtures.
I have previously highlighted that ROLLOFF, the method used by these authors produces age estimates that are about half the age of HAPMIX and StepPCO. As of this writing, ROLLOFF does not seem to be available for independent evaluation, so it is not entirely clear to me whether it, or the older methods, are right. It would be great if this issue is dealt with in the publication arising from this research.

Another issue that must be dealt with is the spurious inference that Ancestral North Indians are more closely related to Europeans than to West Asians in the previous publication on the ANI/ASI division, an inference that was an artifact of unequal sample sizes between Adygei and CEU.

Synthesis of autosomal and gender-specific genetic structures of the Uralic-speaking populations.
K. Tambets et al.
The variation of uniparentally inherited genetic markers - mitochondrial DNA (mtDNA) and non-recombining part of Y chromosome (NRY) - has suggested somewhat different demographic scenarios for the spread of maternal and paternal lineages of North Eurasians, in particular those speaking Uralic languages. The west-east-directed geographical component has evidently been the most important factor that has influenced the proportion of western and eastern Eurasian mtDNA types among Uralic-speakers. The palette of maternal lineages of Uralic-speakers resemble that of geographically close to them European or Western Siberian Indo-European and Altaic-speaking neighbours. However, the most frequent in North Eurasia NRY type N1c, that is a common patrilineal link between almost all Uralic-speakers of eastern and western side of the Ural Mountains, is rare among Indo-European-speakers, with a notable exception of Latvians, Lithuanians and North Russians. In this study the information of genetic variation of uniparentally inherited markers in Uralic-speaking populations from 13 Finno-Ugric and 3 Samoyedic speakers is combined with the results of their genome-wide analysis of 650 000 SNPs (Illumina Inc.) to assign their place in a landscape of autosomal variation of North Eurasian populations and globally. The genome-wide analysis of the genetic profiles of studied populations showed that the proportion between western and eastern ancestry components of Uralic-speakers is concordant with their mtDNA data and is determined mostly by geographical factors. Interestingly, among the Saami - the population which is often considered as a genetic outlier in Europe - the dominant western component is accompanied by about one third of the eastern component, making the Saami genetically more similar to Volga-Finnic populations than to their closest Fennoscandian-East Baltic neighbors. The high frequency of pan-northern-Eurasian paternal lineage N1c among Saami cannot explain this phenomenon alone - genetic ancestry profiles of autosomes of other Finnic- and Baltic-speaking populations, who share the high N1c with the Saami, do not show a considerable eastern Asian contribution to their genetic makeup.
This study seems to include more Northern Eurasian references, but we will have to wait and see how its components are defined. Notice the slight discrepancy between its eastern Saami estimate (1/3) and that of the following study (22%), which is probably an artefact of the different range of samples used.

Population genetics of Finland revisited - looking Eastwards.
K. Rehnström et al.

We have previously reported that the genetic structure within Finland correlates well both with geography and known population history. While these studies have quantified the genetic distances between Finland and European neighbours to the south and the west, the influence of the Eastern and the Northern populations have not been described using genome-wide tools. Here we investigated the degree of Asian ancestry in Northern Europe. We also studied the genetic ancestry of geographic and linguistic neighbours of Finns, using genome-wide SNP data in a dataset comprising over 2200 individuals. First we quantied the proportions of European (represented by HapMap CEU) and Asian (HapMap CHB/JPT) genetic ancestry. Within Finland, the average Asian ancestry proportion varied from 2.5% in the Swedish speaking Finns to 5.1% in Northern Finland. The Saami population, being the indigenous inhabitants of Northern Finland, showed a surprisingly high proportion of Asian genetic ancestry (17.5%). We therefore hypothesize that, as genetic sharing between individuals in Northern Finland and Saami are higher than in other parts of the country, the Asian genetic ancestry in Finland could partly be through admixture with the Saami. Using a model-based estimation of individual ancestry, three ancestral populations provided a best fit for the combined Finnish and Saami dataset. Particularly, one of these ancestral populations was predominant in the Saami (average 78%), and higher in Northern Finland (average 14%) compared to the rest of the country (average 4%). Despite the fact that Finns are the closest relatives of the Saami of all populations included in this study, in general, our results show that language and genetics are only weakly related. The Finns are more closely related to most Indo-European speaking populations than to linguistically related populations such as the Saami. These analyses are currently being extended to sequence level variation using genome-wide sequence data for 100 Finns as part of the 1000 Genomes project, and 200 further individuals from the North-Eastern Finnish subisolate of Kuusamo. These 200 individuals provide good power to identify founder haplotypes within this isolate. Next, we aim to investigate the power to extend the imputation of haplotypes to the rest of Northern Finland as well as to the rest of the country.
It is unfortunate that these researchers used HapMap populations to study admixture in Finns; the Chinese are, especially, not a very good proxy for the East Eurasian element in the Finnish population. There are much data available on North Eurasian populations at this point, so I find the continued use of HapMap populations puzzling; hopefully this will be remedied when this research finds itself in the journals.

The current Dodecad estimate of East Eurasian admixture in the 1000 Genomes FIN population is 5.9%, the bulk of which is "Northeast Asian", a component which peaks in Nganasan, Chukchi, and Koryak, and is also well-represented in Central Siberia among Selkups. I don't have 5 Swedish-speaking Finns to report an average yet, but the ones I have are in the ~2-4% "Northeast Asian" range.

I also ran a quick test of FIN together with CEU and CHB and ~186k SNPs I am currently considering for the next version Dodecad v4 of my ancestry analysis. At K=2, FIN is 3.7% Asian, which seems consistent with the authors reporting the highest Asian ancestry of 5.1% in northern Finland, and also shows how the use of CHB as an Asian reference underestimates the degree of Eastern Eurasian admixture.

August 05, 2011

Genetic structure of Swedish population


PLoS ONE 6(8): e22547. doi:10.1371/journal.pone.0022547

The Genetic Structure of the Swedish Population

Keith Humphreys et al.

Patterns of genetic diversity have previously been shown to mirror geography on a global scale and within continents and individual countries. Using genome-wide SNP data on 5174 Swedes with extensive geographical coverage, we analyzed the genetic structure of the Swedish population. We observed strong differences between the far northern counties and the remaining counties. The population of Dalarna county, in north middle Sweden, which borders southern Norway, also appears to differ markedly from other counties, possibly due to this county having more individuals with remote Finnish or Norwegian ancestry than other counties. An analysis of genetic differentiation (based on pairwise Fst) indicated that the population of Sweden's southernmost counties are genetically closer to the HapMap CEU samples of Northern European ancestry than to the populations of Sweden's northernmost counties. In a comparison of extended homozygous segments, we detected a clear divide between southern and northern Sweden with small differences between the southern counties and considerably more segments in northern Sweden. Both the increased degree of homozygosity in the north and the large genetic differences between the south and the north may have arisen due to a small population in the north and the vast geographical distances between towns and villages in the north, in contrast to the more densely settled southern parts of Sweden. Our findings have implications for future genome-wide association studies (GWAS) with respect to the matching of cases and controls and the need for within-county matching. We have shown that genetic differences within a single country may be substantial, even when viewed on a European scale. Thus, population stratification needs to be accounted for, even within a country like Sweden, which is often perceived to be relatively homogenous and a favourable resource for genetic mapping, otherwise inferences based on genetic data may lead to false conclusions.

Link

December 08, 2010

Genome-wide analysis of population structure in the Finnish Saami

The K=6 ADMIXTURE results from the supplementary material can be seen below:

This is based on ~38k SNPs.

It is unfortunate that they included Native American HGDP populations, but did not include the most relevant published data on Siberians that I first used to study population structure across north Eurasia here and here and here.

Hence, they discover a "Native American"-like component in Saami, which in all likelihood can be further resolved into Siberian-specific components utilizing the Rasmussen et al. dataset.

The "closest approximation" to the East Eurasian component in Saami in the HGDP panel are the Yakuts, but finer-scale analysis (see my previous posts) reveals that the Yakuts are made up almost entirely of an Altaic-specific component tying them to Turkic, Mongol, and Tungusic populations, while the eastern component in European Finns, Vologda Russians and Chuvashs has relationships with Central Siberians such as Kets, Selkups, and Nganasans, all of which are missing in this paper.

Hopefully this data will become publicly available online for re-analysis with the relevant populations included.

European Journal of Human Genetics advance online publication 8 December 2010; doi: 10.1038/ejhg.2010.179

A genome-wide analysis of population structure in the Finnish Saami with implications for genetic association studies

Jeroen R Huyghe et al.

The understanding of patterns of genetic variation within and among human populations is a prerequisite for successful genetic association mapping studies of complex diseases and traits. Some populations are more favorable for association mapping studies than others. The Saami from northern Scandinavia and the Kola Peninsula represent a population isolate that, among European populations, has been less extensively sampled, despite some early interest for association mapping studies. In this paper, we report the results of a first genome-wide SNP-based study of genetic population structure in the Finnish Saami. Using data from the HapMap and the human genome diversity project (HGDP-CEPH) and recently developed statistical methods, we studied individual genetic ancestry. We quantified genetic differentiation between the Saami population and the HGDP-CEPH populations by calculating pair-wise FST statistics and by characterizing identity-by-state sharing for pair-wise population comparisons. This study affirms an east Asian contribution to the predominantly European-derived Saami gene pool. Using model-based individual ancestry analysis, the median estimated percentage of the genome with east Asian ancestry was 6% (first and third quartiles: 5 and 8%, respectively). We found that genetic similarity between population pairs roughly correlated with geographic distance. Among the European HGDP-CEPH populations, FST was smallest for the comparison with the Russians (FST=0.0098), and estimates for the other population comparisons ranged from 0.0129 to 0.0263. Our analysis also revealed fine-scale substructure within the Finnish Saami and warns against the confounding effects of both hidden population structure and undocumented relatedness in genetic association studies of isolated populations.

Link

July 19, 2009

Regional homogeneity of mtDNA in Sweden

Int J Legal Med. 2009 Jul 10.

Homogeneity in mitochondrial DNA control region sequences in Swedish subpopulations.

Tillmar AO et al.

In order to promote mitochondrial DNA (mtDNA) testing in Sweden we have typed 296 Swedish males, which will serve as a Swedish mtDNA frequency database. The tested males were taken from seven geographically different regions representing the contemporary Swedish population. The complete mtDNA control region was typed and the Swedish population was shown to have high haplotype diversity with a random match probability of 0.5%. Almost 47% of the tested samples belonged to haplogroup H and further haplogroup comparison with worldwide populations clustered the Swedish mtDNA data together with other European populations. AMOVA analysis of the seven Swedish subregions displayed no significant maternal substructure in Sweden (F (ST) = 0.002). Our conclusion from this study is that the typed Swedish individuals serve as good representatives for a Swedish forensic mtDNA database. Some caution should, however, be taken for individuals from the northernmost part of Sweden (provinces of Norrbotten and Lapland) due to specific demographic conditions. Furthermore, our analysis of a small sample set of a Swedish Saami population confirmed earlier findings that the Swedish Saami population is an outlier among European populations.

Link

May 09, 2008

Domestication of reindeer

Proc Biol Sci. 2008 May 6 [Epub ahead of print]

Genetic analyses reveal independent domestication origins of Eurasian reindeer.

Røed KH, Flagstad O, Nieminen M, Holand O, Dwyer MJ, Røv N, Vilà C.

Although there is little doubt that the domestication of mammals was instrumental for the modernization of human societies, even basic features of the path towards domestication remain largely unresolved for many species. Reindeer are considered to be in the early phase of domestication with wild and domestic herds still coexisting widely across Eurasia. This provides a unique model system for understanding how the early domestication process may have taken place. We analysed mitochondrial sequences and nuclear microsatellites in domestic and wild herds throughout Eurasia to address the origin of reindeer herding and domestication history. Our data demonstrate independent origins of domestic reindeer in Russia and Fennoscandia. This implies that the Saami people of Fennoscandia domesticated their own reindeer independently of the indigenous cultures in western Russia. We also found that augmentation of local reindeer herds by crossing with wild animals has been common. However, some wild reindeer populations have not contributed to the domestic gene pool, suggesting variation in domestication potential among populations. These differences may explain why geographically isolated indigenous groups have been able to make the technological shift from mobile hunting to large-scale reindeer pastoralism independently.

Link

February 28, 2008

Migrations in the Baltic region inferred from Y chromosomes and mtDNA


From the paper on Y-haplogroup I1a:
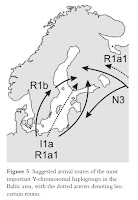
Haplogroup I1a is suggested to have its origins in the Iberian refugium, from where it spread northward and now has its highest frequencies in Northern Europe (Rootsi et al. 2004). The haplotype matches to Germany and Poland imply that I1a has arrived to the Nordic countries from the Southern Baltic Sea region, which is historically plausible. The coalescense age of the haplogroup is about 5000 years lower than the age of the earliest archaeological findings from the Northern Baltic Sea region, which suggests a Neolithic arrival. There are two possible migration routes from Central Europe to the Northern Baltic Sea region: an exclusive western route via Sweden, an eastern route via the Baltic states, or via both to Eastern Finland and Karelia (Fig. 5). The surprisingly high diversities of I1a among the eastern Finnish and Baltic populations, and the lack of association between the Western Finns and the Swedes in SAMOVA analysis suggest that I1a has been involved in bifurcating migrations both via Sweden and the Baltic states, and that the presence of the haplogroup in Finland and Karelia is not merely due to Swedish influence. The low frequency of I1a among the Baltic populations may be due to later effects of genetic drift or replacement.

I am personally doubtful of the Iberian origin of Y-haplogroup I1a. Its presence in Iberia and France, as well as its high diversity there may be the result of migration from northern Europe, a genetic trace of the Germanic Volkerwanderung. One certainly needs to consider this effect. There are probably a couple of papers just waiting to be written by looking at Y-chromosomes of Germanic descendants in Southwestern Europe by looking at either surnames or early cemetaries.

With regard to Y-haplogroup N3:
The frequency distribution and age of haplogroup N3 in our study sample was consistent with the earlier studies (Lahermo et al. 1999, Zerjal et al. 2001, Tambets et al. 2004, Karlsson et al. 2006, Rootsi et al. 2007). According to the YHRD database, the haplotypes most common in Finland and Karelia were relatively unique, which is not unexpected, since data from most Eurasian populations where N3 is common is not publicly available. It seems evident that the Finns and Karelians share a history regarding haplogroup N3. In the database comparisons, we also observed that N3 may mark a westward diffusion in the north from Finland to Sweden and in the south from the Baltic countries to Poland and Germany.
The researchers also reiterated the previous idea of a dual origin of N3, as shown in the figure, with different clades being represented in Finland and the Baltic states, with Estonia being intermediate between the two.

With regard to Y-haplogroup R1a1:
It is plausible that both R1a1 and I1a were carried to the Baltic Sea region via the same Neolithic migrations from Germany/Poland. The higher coalescence age and the starlike network structure of R1a1 are consistent with the probable higher diversity and frequency of R1a1 in the original source population(s), a consequence of the wider geographical distribution of the haplogroup. It is an important observation that in the Baltic Sea region R1a1 is mainly associated to Central European rather than eastern or Russian influence. However, haplotype frequency comparisons (Derenko et al. 2006, Willuweit & Roewer 2007) give some indication of Russian gene flow as a partial source of R1a1 in Karelia, which would be plausible given the long period of admixture with Slavs (Fig. 5). However, the Y-chromosomal diversity in Karelia has been heavily affected by drift and founder effects. Another haplogroup with eastern affinity is I1b (Rootsi et al. 2004), whose presence in Karelia and the Baltic states is probably a sign of Russian gene flow.

This is an important discovery, and a great first step in uncovering the structure within this widespread haplogroup. Even though R1a1 Y-chromosomes were studied in a lot of populations, including e.g., the Balkans, India, the Altai, unfortunately we know next to nothing about its phylogenetic substructure. Without such knowledge, R1a1 spread has been variously interpreted as a signal of postglacial colonization, Kurgan expansions, or the spread of Slavic languages.

Finally, the genetic legacy of the Saami is visible in mtDNA:
The eastern elements in the mtDNA variation of the Baltic Sea region are intertwined with the Saami influence. Recent studies of the mtDNA variation among the Saami show a link to the Volga-Ural region (Tambets et al. 2004, Ingman & Gyllensten 2006), which is now shown to exist also among the Karelians and, to a lesser degree, among the other populations from the Baltic Sea region as well. Additionally, the presence of U4 in the Eastern Baltic Sea populations may represent eastern influence, since it is typical for the Volga-Ural region (Bermisheva et al. 2002). The high diversity of this haplogroup in the Baltic region, observable in the haplotype network, suggests a complex history, and rules genetic drift out as a cause of the high frequency. All in all, these mtDNA haplogroups may be maternal reflections of the eastern influence that can be most clearly observed in the Y-chromosomal haplogroup N3.

Annals of Human Genetics doi:10.1111/j.1469-1809.2007.00429.x

Migration Waves to the Baltic Sea Region

T. Lappalainen et al.

In this study, the population history of the Baltic Sea region, known to be affected by a variety of migrations and genetic barriers, was analyzed using both mitochondrial DNA and Y-chromosomal data. Over 1200 samples from Finland, Sweden, Karelia, Estonia, Setoland, Latvia and Lithuania were genotyped for 18 Y-chromosomal biallelic polymorphisms and 9 STRs, in addition to analyzing 17 coding region polymorphisms and the HVS1 region from the mtDNA. It was shown that the populations surrounding the Baltic Sea are genetically similar, which suggests that it has been an important route not only for cultural transmission but also for population migration. However, many of the migrations affecting the area from Central Europe, the Volga-Ural region and from Slavic populations have had a quantitatively different impact on the populations, and, furthermore, the effects of genetic drift have increased the differences between populations especially in the north. The possible explanations for the high frequencies of several haplogroups with an origin in the Iberian refugia (H1, U5b, I1a) are also discussed.

Link

December 30, 2006

New edition of YHRD database is online

From the curators of YHRD:
Hi Dienekes,

we have launched release 20 of the YHRD database, the largest update ever with 4,755 new haplotypes. See the news below and a geographical overview as an attachment.

December 28 YHRD update (Lutz Roewer, Sascha Willuweit)

The largest update since the database was started in 2000! Release 20 is out with 46,720 haplotypes in 386 populations. 44,863 haplotypes of these are completely typed for 9 and 17,824 for 11 loci. Twenty-nine populations were added today: from Ningxia in China (Han), from Qinghai in China (Salar), from Hungary including Romani speakers, from Germany (Bonn), from Sweden (Saami from Jokkmokk), from Norway (Bergen), from Libya (Tripolis), from Yemen (Sanaa), from Mexico (Chihuahua and Mexico City), from Serbia (Novi Sad), from Siberia (Stony Tunguska Evenks, Yakut speaking Evenks, Yakuts, Yukaghir, Tuva), from Western Russia (Belgorod, Kaluga, Mineralnye Vody, Nizhnii Novgorod, Orel, Pskov, Saratov, Tula, Vladimir, Volot, Yaroslavl) and from Southeastern Poland. Ten populations were updated: from Colombia (province Antioquia), from Ningxia in China (Hui), from Taiwan (Han), from Norway (Eastern, Central, Northern, Southern, Western parts and from Oslo) as well as from Russia (Novgorod). In two populations erroneous allele calls were corrected: Taraz (Kazakhstan) and Andalucia/Extremadura (Spain). We would like to thank the following colleagues for submissions, updates and corrections: Bofeng Zhu and his group (Shaanxi, P.R.China), Pamszav Horolma and her group (Budapest, Hungary), Anke Junge and her group (Bonn, Germany), Cheng-Hwai Tzeng and his group (Taipei, Taiwan), Andreas Karlsson and his group (Linkoeping, Sweden), Anibal Gaviria and his group (Medellin, Colombia), Thomas Rothaemel and his group (Hannover, Germany), Berit Myhre Dupuy and her group (Oslo, Norway), Uta Immel and her group (Halle, Germany), Hector Rangel-Villalobos and his group (Ocotlan, Mexico), Miljen Maletin and his group (Novi Sad, Serbia), Brigitte Pakendorf and her group (Leipzig, Germany), Marcin Wozniak and his group (Bydgoszcz, Poland), Grzegorz Kaczmarczyk and his group (Krakow, Poland) and Maria Jose Farfan and her group (Sevilla, Spain).

We wish you a happy new year !

Lutz Roewer, Sascha Willuweit
YHRD curators

November 06, 2006

ASHG 2006 abstracts

The meeting of the American Society of Human Genetics took place this October and the abstracts of the meeting are online in a big pdf file. A few items of interest:

The genetic variation and population history in the Baltic Sea region
Sharp genetic borders within a geographically restricted region are known to exist among the populations around the northern Baltic Sea on the northern edge of Europe. We studied the population history of this area in greater detail from paternal and maternal perspectives with Y chromosomal and mitochondrial DNA markers. Over 1700 DNA samples from Finland, Karelia, Estonia, Latvia, Lithuania and Sweden were genotyped for 18 Y-chromosomal biallelic polymorphisms and 8 microsatellite loci, together with 18 polymorphisms from the coding area of mtDNA and sequencing of the HVR1. Y chromosomal haplogroups from the biallelic data indicate both various phases of gene flow and existence of genetic barriers within the Baltic region. Haplogroup N3, being abundant on the eastern side of the Baltic, differentiates between eastern and western sides of the Baltic Sea, just like R1b that has a reverse frequency pattern to N3. The typically Scandinavian haplogroup Ia1 has a high frequency of up to 40%, separating not only Sweden but also Western Finland from the other populations. The frequency of haplogroup R1a1, most characteristic to Slavic peoples, varied substantially across the populations. In addition to biallelic markers, Y-chromosomal microsatellite loci were analyzed for a more detailed approach to the history of the paternal lineages in the region. We also analyzed mtDNA markers with special interest for sub-haplogroups of H and U, that among other haplogroups, show substantial variation between the populations (e.g. haplogroups H1, H2, T and J1). In conclusion, our current Y-chromosomal and mtDNA data suggest various incidents of gene flow from different sources, each reaching partly different areas of the Baltic region, which can be thus seen as a meeting point of a not only culturally but also genetically diverse set of populations.
Asian Nomads traces in the mitochondrial gene pool of Slavs.
Mitochondrial DNA (mtDNA) variability was studied in a sample of 179 individuals representing Czech population from west Bohemia. MtDNA analysis revealed that the majority of Czech mtDNAs belongs to the common West Eurasian mitochondrial haplogroups. However, about 3 per cent of Czech mtDNAs encompass East Eurasian lineages (A, N9a, D4, M*). Comparative analysis of published data has shown that different Slavonic populations contain small but marked amount of East Eurasian mtDNAs (e.g. 1.3 per cent in Eastern Slavs, 1.8 per cent in Western Slavs, and 1.2 per cent in Southern Slavs). It is noteworthy that Baltic populations (Latvians, Lithuanians and Estonians) have avoided a marked influence of maternal lineages of East Eurasian origin (0.3-0.6 per cent). The two East Eurasian mtDNA haplogroups, Z1 and D5, are present in gene pools of North European Finnic populations (Saami, Finns, and Karelians). Unlike them, Slavonic populations in general are characterized by heterogeneous mtDNA structure, defined, in addition to Z1 and D5, by haplogroups A, C, D4, G2a, M*, N9a, F and Y. Therefore, different scenarios of female-mediated East Eurasian genetic influence on Northern and Eastern Europeans should be highlighted: (1) the most ancient, probably originated in the early Holocene, influx of Asian tribes, which brought a few selected East Asian mtDNA haplotypes (like Z and D5) to Fennoscandia (Tambets et al. 2004), and (2) gradual gene flows of historic times occurred mostly in the Middle Ages due to migrations of nomadic peoples (such as the Huns, Avars, Bulgars, Mongols) to Eastern and Central European territories inhabited mainly by Slavonic tribes. We suggest that the presence of East Eurasian mtDNA haplotypes is not original feature of gene pool of the proto-Slavs, but mostly is a consequence of admixture with Central Asian nomadic tribes, who migrated into Central and Eastern Europe in the early middle Ages.
Use of Forensic Markers in the Assessment of Population Stratification.
Assignment of individuals to population groups is important to genetic case control association studies, admixture mapping, medical risk assessment, genealogy, and forensic studies. Polymorphic sequences can be used to infer ancestry but their utility for such an application is related to the number of alleles and relative frequency differences of these alleles between the population groups under study. Multiple study designs differing in numbers and types of polymorphic markers with differing levels of informativeness make comparison of studies difficult. The use of commercially-available highly-informative markers that are used internationally in forensic applications could provide a universal first tier analysis for assignment of individuals to population groups prior to inclusion in association and admixture studies. We evaluated the utility of the PowerPlex kit of 16 markers from Promega for this purpose. Multiple population groups including African, Bengalis, Chinese, Japanese, Koreans, Crypto Jews, Sephardic Jews, and Dutch were genotyped using the PowerPlex kit. The data were analyzed with STRUCTURE (Pritchard et al.) using an admixture model, correlated alleles and 3 clusters. Africans, Asians (Bengalis, Koreans, Chinese and Japanese), and Caucasians (Dutch, Sephardic Jews, and Crypto Jews) were clearly delineated. Individuals showing admixture were detectable and their removal resulted in more discrete clustering. An independently collected and genotyped set of Dutch individuals was indistinguishable from the original Dutch group providing reproducibility across data sets. The sensitivity conferred by the number of markers used in the analysis was assessed by removing markers. Delineation of population groups was apparent when 14 markers were used, although clusters were noisier; however it was not possible to delineate population groups when only 8 markers were used. The use of forensic markers is a promising strategy for clustering individuals into population groups and will be an inevitable outcome of their forensic use.
Evaluation of Ancestry and Linkage Disequilibrium Sharing in Admixed Population in Mexico
National Institute of Genomic Medicine, Mexico. More than 80% of the Mexican population is considered Mestizo, resulting from the admixture of ethnic groups with Spaniards. To generate an initial estimate of ancestral contribution (AC) of populations from Europe, Africa and Asia to the Mexican Mestizos, we genotyped 104 samples from the states of Sonora (n=20), Yucatan (n=17), Guerrero (n=21), Zacatecas (n=19), Veracruz (n=18) and Guanajuato (n=8) using the 100K Affymetrix SNP array, and used data from the International HapMap Project as the parental population information. From 3,055 ancestry informative SNPs reported by Smith et al. and Choudhry et al., we identified 105 present in the 100K array and used them to calculate AC from each population to our sample. To infer AC we used Structure software under the admixture model. Based on this analysis, the average AC in our samples is 58.96% European, 10.03% African and 31.05% Asian. Sonora shows the highest European contribution (70.63%) and Guerrero the lowest (51.98%) where we also observe the highest Asian contribution (37.17%). African contribution ranges from 7.8% in Sonora to 11.13% in Veracruz. Based on these data, we grouped our population according to European AC (<50%,>70%). We used the Carlson algorithm to derive European tagSNPs from the 100K marker set. To explore Linkage Disequlibrium Sharing (LDS) between Mestizos and Europeans, we calculated the proportion of tagSNP-marker pairs that maintained an r2≥0.8 in each evaluated population. In general, comparison of LDS between European and Asian population is ~73%, whereas comparison with African population is ~40%. Mestizos from Guerrero show the lowest LDS (74%), whereas those from Sonora show the highest (77%). Similar results are seen in the group of lower (<50%)>70%) European ancestry. Our results suggest that the Mexican Mestizo population shows ancestry-based stratification that will requiere the appropriate corrections to avoid spurius results in association studies. Our results show that admixed populations have unique patterns of LD depending on levels of ancestral contribution.
European mitochondrial haplogroups exhibit differential risk of developing presbycusis.
The genetic basis of human presbycusis (age-related hearing loss) is unknown. This common disorder is characterized by difficulty understanding conversation, particularly in noisy backgrounds. Audiograms of presbycusics show sloping hearing loss, with greatest deficiencies at the highest frequencies, and over time an individual’s hearing loss progresses into the lower frequencies that are more important for understanding speech. We investigated the hypothesis that the mitochondrial (mt) genome plays a role in presbycusis. Subjects of European ancestry, all over age 58, were tested using both classical and advanced audiometric measures and then genotyped to determine mt haplogroups. We found that subjects belonging to haplogroup H (N=93) had better hearing than other Europeans (N=80), with the greatest differences observed in the right ear at 3 kHz (p=0.017) and 10-14 kHz (p=0.016). The difference at 3 kHz correlates with the common noise notch location, and thus may indicate a difference in susceptibility to noise damage. Distortion product otoacoustic emissions also indicated better hair cell health in haplogroup H subjects, at higher frequencies and in the right ear (average DPOAEfor 4-6 kHz, p= 0.010). These results support the hypothesis that a mitochondrial factor influences susceptibility to the development of presbycusis. We are currently investigating the mt genome for causative mutations linked to the haplogroups.

Estimating the split time of Human and Neanderthal populations
Previous genetic studies of Neanderthal ancestry have used mtDNA and thus have been limited in their conclusions on the relationship of humans and Neanderthals. We present here the first use of Neanderthal genomic DNA to assess the joint history of human and Neanderthal populations. Our data consist of 37kb of short fragments of genomic DNA sequenced in Neanderthal. By studying the degree to which modern human diversity is shared with Neanderthal we can assess the time at which the human and Neanderthal populations split. We use a flexible simulation based approach that demonstrates the power of using human variation data in such analyses. We find that the two populations split ~400,000 years, predating the emergence of modern humans. Our best fitting model predicts that the Neanderthal lineage will be outgroup to the human population ~52% of the time.
The Genetic Structure of Human Populations in Africa.
Africa contains the greatest levels of human genetic variation and is the source of the worldwide range expansion of all modern humans. Knowledge of the genetic population boundaries within Africa has important implications for the design and implementation of genetic epidemiologic studies of Africans and African Americans, and for reconstructing modern human origins. A dataset consisting of ~3.7 million genotypes has been generated from the Marshfield panel of 773 microsatellites and 392 in-del polymorphic genetic markers. These markers were genotyped in ~3,200 individuals from >100 diverse ethnic populations across Africa as well as in 118 African Americans and in the CEPH Human Genome Diversity Panel, consisting of 1048 individuals from 51 globally diverse populations. Preliminary analysis of population structure using the program STRUCTURE1 indicates considerably more substructure amongst global populations (estimate for the number of genetic clusters, K, is 12) and amongst African populations (K = 9) than had previously been recognized2. Population clusters are correlated with self-described ethnicity and shared cultural and/or linguistic properties (e.g. Pygmies, Khoisan-speakers, Bantu-speakers, etc). African Americans have predominantly West African Bantu (~80%) and European (~17%) ancestry, although individual admixture levels vary considerably. These results justify the need to include a broad range of geographically and ethnically diverse African populations in studies of human genetic variation. 1Pritchard JK, et al. Genetics 155:945-59 (2000) 2Rosenberg NA, et al. Science 298:2381- 5 (2002).
Patterns of admixture in Latino populations
We examined the diversity of 13 Latino populations from seven countries (Mexico, Guatemala, Costa Rica, Colombia, Chile, Argentina and Brazil) typing 745 autosomal microsatellite markers in 250 individuals. Estimates of genetic ancestry for these populations varied substantially. Native American ancestry varied between 19.6% and 70.3%, European ancestry between 26.9% and 70.6%, and African ancestry between 1.1% and 9.8%. Genetic structure analysis provides evidence of a genetic continuity between pre- and post-Columbian populations for specific geographic regions. For instance, a Chibchan-Paezan ancestry is detectable in Latinos from lower Central America and northwest South America. Individual admixture estimates vary considerably between populations. Some Latinos (e.g. Mexico City) show marked variation in individual admixture, whereas others (e.g. Antioquia and Costa Rica) show little variation. This variation is likely to reflect the history of admixture of each geographic region examined: some Latino populations are still undergoing substantial admixture whereas others underwent admixture mostly in early colonial times. These results have important implications for admixture mapping and association mapping studies in Latino populations.


Genomic diversity and population structure of Native Americans
We examined 745 autosomal microsatellite markers in 432 individuals sampled from 24 indigenous populations in the Americas. These data were analyzed jointly with similar data available in 54 other indigenous populations from across the world (including an additional 5 Native American groups). The populations from the Americas show lower diversity and more differentiation than populations from other continental regions (global Fst=0.08). Signals of long-range linkage disequilibrium are detectable to a greater extent in Native Americans than in other populations, as are signals of recent bottlenecks followed by population growth. A negative correlation is observed between population diversity and geographic distance from the Bering Strait, an observation consistent with the north-to-south dispersal of humans upon initial entry into the continent. A higher diversity is observed in western vs. eastern South American populations, potentially reflecting differences in long-term effective population size or in colonization routes within South America. Phylogenetic trees relating Native American populations show a marked differentiation between Canadian and other Native populations. Canadian natives also show a detectable shared ancestry with contemporary Siberian populations, which is less visible for more southerly Americans. A substantial agreement is observed between phylogenetic relatedness and population affiliation according to the linguistic classification of Greenberg.

The rare nonsynonymous SCN5A-S1103Y variant in Caucasians is due to recent African Admixture as revealed by 100k SNP genotyping.
The SCN5A-S1103Y variant is an established and confirmed risk factor conferring an odds ratio up to 8.5 for cardiac ventricular arrhythmias and sudden cardiac death (Splawski et al, Science, 2002, Burke et al., Circulation, 2005, Plant et al., J. Clin. Invest. 2006). In Africans it is a common nonsynonymous SNP (MAF=8%), but it is rarely observed in Caucasians (Chen et al, J. Med. Genet. 2002). In a Bavarian family appearing of entirely Caucasian descent and affected with long QT Syndrome we have detected this variant in heterozygote state as the only causal nonsynonymous variation upon diagnostic ion channel resequencing. To resolve the question, whether in the family the variant was (a) of ancient African descent, (b) due to recent African admixture or (c) a de novo mutation, we analyzed the genetic segment it resided on. Dense SNP genotyping in admixed individuals allows to infer the ethnicity of chromosomal regions if allele frequencies are known in the original populations. Ethnicity inference for any given locus can be carried out by applying the product rule to a sliding window of neighboring SNPs or via modeling ancestry by hidden Markov Chain Monte Carlo Methods (Tang et al. Am. J. Hum. Genet, 2006). By 100k SNP genotyping of the Bavarian family, we demonstate that the S1103 variant is due to recent African admixture (b) and could rule out possibilities (a) and (c). This application demonstrates that inferring ethnicity of chromosomal regions by high density SNP genotyping is a powerful approach with prospects also to admixture mapping of disease loci and population stratification correction of genomewide association mapping of complex disease loci.

Allele frequency estimates from DNA pools for 317,000 SNPs for multiple European and worldwide populations and discovery of Ancestry Informative Markers for Europe.
The identification of Ancestry Informative Markers (AIMs) and inference of individual genetic history is useful in many applications, including studies of geography and evolution of human populations, forensic sciences, pharmacogenomics, admixture mapping and association studies of complex diseases. While many AIMs have been reported that define strong genetic differences between major continents, it is more difficult to identify markers that reflect subtle, within-continent diversity, such as the heterogeneous ancestry of European Americans contributed by different populations within Europe. We have analyzed DNA pools, each for a different population, on Illumina HumanHap300 BeadArrays to estimate allele frequencies for ~317,000 Single Nucleotide Polymorphisms for 9 European, 6 African, and 2 Amerindian populations in the Human Genome Diversity Project collection. We have also evaluated the performance of this method by analyzing three HapMap pools (YRI, CHB, and JPT), for which the true allele frequencies are already known from the International HapMap Project. We found that the allele frequency estimates differed between replicate chips by less than +/-5% for 95% of the SNPs, and that the estimated frequencies and the true frequencies differed by +/-5-10% for 90% of the SNPs. The data for nine European populations, from western Caucasus, Scotland, Tuscany, Sardinia, France, Iberia, Russia, Northern Italy, and a Basque region, showed a clear excess of SNPs having large allele frequency differences (e.g. >30%) between most pairs of populations, compared to what would be expected given the sample sizes. These results provide a valuable resource of European AIMs for monitoring within-continent stratification in association studies. We are currently validating the most informative SNPs by individually genotyping samples that formed the pools as well as those from additional European populations.


Mitochondrial haplogroups are associated with asthma and total serum IgE levels
Maternal history of asthma and/or atopy is a major risk factor for the subsequent development of asthma and allergy in childhood. Although mitochondrial mutations have been implicated in several maternally inherited monogenic disorders, no studies of mitochondrial polymorphisms and asthma have been reported.Weevaluated whether common mitochondrial haplogroups are associated with asthma and total serum IgE levels. 8 common mitochondrial single nucleotide polymorphisms (mtSNP) were genotyped in two cohorts of European ancestry: 512 adult women with incident asthma and 517 matching controls participating in the Nurses’ Health Study (NHS) and 654 children ages 5-12 years with mild to moderate asthma participating in the Childhood Asthma Management Program (CAMP). Genotyping was performed using TaqMan® probe hybridization assays. 93 random NHS samples were run in duplicate for all assays and demonstrated 100% concordance. In the CAMP Study, genotype data from probands’ mothers was also 100% concordant across all assays. Completion rates in both cohorts were > 95% for all markers. mtSNP 9055 was seen at higher frequency in NHS asthma cases (frequency 11.1%) than controls (8.0%, p = 0.02). Association analysis using haplo.score identified two haplogroups associated with asthma: one haplogroup at a frequency of 3.83% among cases compared to 1.27% among controls (p=0.0002) and another at a frequency of 9.97% among cases and 11.3% among controls (p=0.04). The CAMP Study is a case-only (family-based) cohort, thus precluding evaluation of mitochondrial SNP associations with asthma status. However, quantitative analysis of mitochondrial haplogroups identified two haplogroups of 11.0% and 1.87% frequency that were associated with log-transformed total serum IgE levels, an important intermediate phenotype in asthma and atopy (p=0.006 and 0.01, respectively). These data suggest that common mitochondrial haplogroups influence asthma diathesis.

September 20, 2006

Haplogroup Z in the Saami

From the article:
The presence of haplogroup Z implies a contribution, albeit limited, to the Sami gene pool from Asia. The close relationship of Z1a lineages from Finns and Sami with those of the Volga-Ural again implicates that region as a probable source for Sami mitochondrial diversity. There is, however, a difference in the apparent ages of the different Sami haplogroups. The nucleotide diversity among Sami sequences for the three haplogroups studied here is very low. The ages of the variation for U5b1b1 and V among Swedish Sami are similar (5500 and 7600 YBP, respectively) but considerably older than for Z (2700 YBP). The surprisingly close link between haplogroup Z1a among Sami and the Volga-Ural sequences suggest that this haplogroup was brought in during the last 2–3000 YBP. Our data supports that a migration from Eastern Europe, in the vicinity of the Volga-Ural region, is the likely source for much of the Sami mtDNA diversity14 but indicates multiple migrations, the first being 6–7000 YBP and at least one additional migration 2–3000 YBP. Considering the similarity observed between Sami and Finnish mitochondrial lineages, this observation of multiple migration events would also support previous population genetic studies that have indicated dual origins of the Finnish people.37


European Journal of Human Genetics advance online publication 20 September 2006; doi: 10.1038/sj.ejhg.5201712

A recent genetic link between Sami and the Volga-Ural region of Russia

Max Ingman and Ulf Gyllensten

Abstract

The genetic origin of the Sami is enigmatic and contributions from Continental Europe, Eastern Europe and Asia have been proposed. To address the evolutionary history of northern and southern Swedish Sami, we have studied their mtDNA haplogroup frequencies and complete mtDNA genome sequences. While the majority of mtDNA diversity in the northern Swedish, Norwegian and Finnish Sami is accounted for by haplogroups V and U5b1b1, the southern Swedish Sami have other haplogroups and a frequency distribution similar to that of the Continental European population. Stratification of the southern Sami on the basis of occupation indicates that this is the result of recent admixture with the Swedish population. The divergence time for the Sami haplogroup V sequences is 7600 YBP (years before present), and for U5b1b1, 5500 YBP amongst Sami and 6600 YBP amongst Sami and Finns. This suggests an arrival in the region soon after the retreat of the glacial ice, either by way of Continental Europe and/or the Volga-Ural region. Haplogroup Z is found at low frequency in the Sami and Northern Asian populations but is virtually absent in Europe. Several conserved substitutions group the Sami Z lineages strongly with those from Finland and the Volga-Ural region of Russia, but distinguish them from Northeast Asian representatives. This suggests that some Sami lineages shared a common ancestor with lineages from the Volga-Ural region as recently as 2700 years ago, indicative of a more recent contribution of people from the Volga-Ural region to the Sami population.

Link

May 24, 2006

Y chromosomes of Sweden

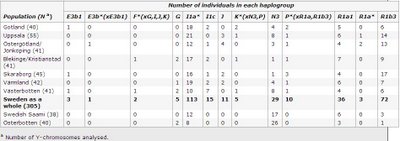
Haplogroup frequencies:


European Journal of Human Genetics (advance online publication)

Y-chromosome diversity in Sweden – A long-time perspective

Andreas O Karlsson et al.

Abstract

Sixteen Y-chromosomal binary markers and nine Y-chromosome short tandem repeats were analyzed in a total of 383 unrelated males from seven different Swedish regions, one Finnish region and a Swedish Saami population in order to address questions about the origin and genetic structure of the present day population in Sweden. Haplogroup I1a* was found to be the most common haplogroup in Sweden and accounted, together with haplogroups R1b3, R1a1 and N3, for over 80% of the male lineages. Within Sweden, a minor stratification was found in which the northern region Västerbotten differed significantly (P<0.05) from the other Swedish regions. A flow of N3 chromosomes into Västerbotten mainly from Saami and Finnish populations could be one explanation for this stratification. However, the demographic history of Västerbotten involving a significant male absence during the 17th Century may also have had a large impact. Immigration of young men from elsewhere to Värmland at the same time, can be responsible for a similar deviation with I1a* haplotypes. Y chromosomes within haplogroup R1b3 were found to have the highest STR variation among all haplogroups and could thus be considered to be one of the earliest major male lineages present in Sweden. Regional haplotype variation, within R1b3, also showed a difference between two regions in the south of Sweden. This can also be traced from historical time and is visible in archaeological material. Overall this Y chromosome study provides interesting information about the genetic patterns and demographic events in the Swedish population.

Link

December 13, 2005

Y chromosomes of Norway

This should be of interest to Norwegians and those suspecting "Viking" ancestry.

Image Hosted by ImageShack.us

From the paper:
Haplogroup frequency distributions in the different Norwegian regions are presented (Fig. 1). The frequency of P*(xR1a) varied from 26% in the east to 45% in the south, BR*(xDE, J, N3, P) from 30% in the west to 42% in the south and R1a from 13% in the south to 32% in the middle. N3 was most frequent in the north (11%; 18.6% in the northernmost county Finnmark) and totally absent in the south. Haplogroup DE and J were rare in all regions. We observe a relatively high frequency of P*(xR1a) and R1a in the population sample from south-west and east, respectively.


Frequency of haplotypes:
Free Image Hosting at www.ImageShack.us

Uralic admixture in the non-Saami Norwegian population:
Haplogroup N3 has been interpreted as a signature of Uralic Finno-Ugric speaking males migrating to northern Scandinavia about 4000–5000 years ago [9], [17], [35] and [60]. In the present study, N3 is observed at 4% in the overall population and at 11% in the northern region corresponding to 150,000 and 50,000 inhabitants, respectively. These numbers exceed the total number of Saami inhabitants, which is officially recognized as about 50,000 (http://www.sametinget.se). In northern Norway, the N3 percentage is 18.6% in Finnmark, 8.6% in Troms and 8.4% in Nordland (which are the three northernmost counties—Nordland being located to the south of the other two (Supplementary Data Online, Fig. 2)). There is thus a considerable pool of Saami and/or Finnish Y-chromosomes in the Norwegian population and particularly in the north.


Also of interest is the discovery of a new haplogroup:
A new haplogroup, not described earlier, was found in a single sample. Deduced from its biallelic type, it might represent a new 12f2 deletion within haplogroup P*(xR1a). The haplogroup it defines has been given the temporary name P*(xR1a)/12f2c (M. Jobling personal communication). Its haplotype composition is 15-10-17-24-10-13-14-11,14-12. There are already two known 12f2 deletions within hgJ and hgD2.


Forensic Sci Int. 2005 Dec 6; [Epub ahead of print] Links

Geographical heterogeneity of Y-chromosomal lineages in Norway.

Dupuy BM, Stenersen M, Lu TT, Olaisen B.

Y-chromosomal variation at five biallelic markers (Tat, YAP, 12f2, SRY(10831) and 92R7) and nine multiallelic short tandem repeat (STR) loci (DYS19, DYS389I, DYS389II, DYS390, DYS391, DYS392, DYS393, DYS385I/II and DYS388) in a Norwegian population sample are presented. The material consists of 1766 unrelated males of Norwegian origin. The geographical distribution of the population sample reflects fairly well the population distribution around the year 1942, which is the median birth year of the index persons. Seven hundred and twenty-one different Y-STR haplotypes but 726 different lineages (Y-STRs plus biallelic markers) were encountered. We observed six known (P*(xR1a), BR(xDE, J, N3, P), R1a, N3, DE, J), and one previously undescribed haplogroup (probably a subgroup within haplogroup P*(xR1a)). Four of the haplogroups (P*(xR1a), BR(xDE, J, N3, P), R1a and N3) represented about 98% of the population sample. The analysis of population pairwise differences indicates that the Norwegian Y-chromosome distribution most closely resembles those observed in Iceland, Germany, the Netherlands and Denmark. Within Norway, geographical substructuring was observed between regions and counties. The substructuring reflects to some extent the European Y-chromosome gradients, with higher frequency of P*(xR1a) in the south-west and of R1a in the east. Heterogeneity in major founder groups, geographical isolation, severe epidemics, historical trading links and population movements may have led to population stratification and have most probably contributed to the observed regional differences in distribution of haplotypes within two of the major haplogroups.

Link

November 16, 2005

Y-chromosomal microsatellites in Northern and Southern Russians

Genetika. 2005 Aug;41(8):1125-31.

[Polymorphism of Y-chromosomal microsatellites in Russian populations from the northern and southern Russia as exemplified by the populations of Kursk and Arkhangel'sk Oblast]

[Article in Russian]

Khrunin AV et al.

Allelic polymorphisms at five Y-chromosomal microsatellite loci (DYS19, DYS390, DYS391, DYS392, and DYS393) were typed in 87 individuals from male population samples from two geographically isolated regions (Arkhangelsk oblast and Kursk oblast) of the European part of Russia. The populations examined demonstrated substantial differences in the distribution of the DYS392 (P = 0.005) and DYS393 (P = 0.003) alleles. Estimates of genetic relationships between these populations and some other European populations (including Eastern-Slavic) showed that irrespectively of the measure of genetic distance chosen, Arkhangelsk population was closer to the populations belonging to the Finno-Ugric linguistic group (Saami and Estonians) and to the Estonian geographical neighbors, Latvians, while Kursk population was the member of a cluster formed by Eastern-Slavic populations (Russians of Novgorod oblast, Ukrainians, and Belarussians). Phylogenetic analysis of the most frequent haplotypes indicated that these differences between Kursk and Arkhangelsk populations were associated with high prevalence in the latter of major haplotypes characteristic primarily of the Finno-Ugric populations.

Link