January 18, 2017
Dysgenic trend in educational attainment in Iceland
But, this assumes that these differences are long-standing and date to the time that modern humans left Africa for more northern (and colder) latitudes. There is good reason to doubt this explanation: ancient writers of the Mediterranean classical world predictably identified themselves as the optimum, but remarked on the spiritedness and dullness of northerners in contrast to the lack of spirit but intelligence of southerners, which seemingly contradicts present-day cognitive ability distributions. But, it may very well be that cognitive ability has changed dramatically over this time period; certainly the fact that one of its correlates (educational attainment) can change in a small isolated population (Icelanders) over a century does not add to one's confidence that this is a trait that has been stable for millennia (let alone since the time of harsh Ice Age winters). As more markers are discovered to predict cognitive ability in human populations and it becomes easier to study ancient ones, it might be possible to track this trait convincingly.
On the positive side, the pliability of the genetic influences on cognition undercuts arguments that possible differences in this trait among human races and ethnic groups are solidly entrenched and unalterable,. Rather they may be accidents of recent evolution which could, in principle, be reversed.
PNAS doi: 10.1073/pnas.1612113114
Selection against variants in the genome associated with educational attainment
Augustine Kong et al.
Epidemiological and genetic association studies show that genetics play an important role in the attainment of education. Here, we investigate the effect of this genetic component on the reproductive history of 109,120 Icelanders and the consequent impact on the gene pool over time. We show that an educational attainment polygenic score, POLYEDU, constructed from results of a recent study is associated with delayed reproduction (P less than 10−100) and fewer children overall. The effect is stronger for women and remains highly significant after adjusting for educational attainment. Based on 129,808 Icelanders born between 1910 and 1990, we find that the average POLYEDU has been declining at a rate of ∼0.010 standard units per decade, which is substantial on an evolutionary timescale. Most importantly, because POLYEDU only captures a fraction of the overall underlying genetic component the latter could be declining at a rate that is two to three times faster.
Link
March 25, 2015
Icelanders galore
When this rate was applied to estimate the TMRCA between two Y chromosomes that encompass the oldest known patrilineal bifurcation between any humans (representing haplogroups A00 and A0, with 75 derived mutational differences in 180 kb of XDG sequence)19, we obtained a maximum-likelihood estimate21 of 239,000 years ago and a 95% CI of 188,000–296,000 years ago (174,000–321,000 years ago when incorporating the 95% CI of our mutation rate).This seems similar to the 254kya estimated by Karmin et al.
Nature Genetics (2015) doi:10.1038/ng.3247
Large-scale whole-genome sequencing of the Icelandic population
Daniel F Gudbjartsson et al.
Here we describe the insights gained from sequencing the whole genomes of 2,636 Icelanders to a median depth of 20×. We found 20 million SNPs and 1.5 million insertions-deletions (indels). We describe the density and frequency spectra of sequence variants in relation to their functional annotation, gene position, pathway and conservation score. We demonstrate an excess of homozygosity and rare protein-coding variants in Iceland. We imputed these variants into 104,220 individuals down to a minor allele frequency of 0.1% and found a recessive frameshift mutation in MYL4 that causes early-onset atrial fibrillation, several mutations in ABCB4 that increase risk of liver diseases and an intronic variant in GNAS associating with increased thyroid-stimulating hormone levels when maternally inherited. These data provide a study design that can be used to determine how variation in the sequence of the human genome gives rise to human diversity.
Link
Nature Genetics (2015) doi:10.1038/ng.3171
The Y-chromosome point mutation rate in humans
Agnar Helgason et al.
Mutations are the fundamental source of biological variation, and their rate is a crucial parameter for evolutionary and medical studies. Here we used whole-genome sequence data from 753 Icelandic males, grouped into 274 patrilines, to estimate the point mutation rate for 21.3 Mb of male-specific Y chromosome (MSY) sequence, on the basis of 1,365 meioses (47,123 years). The combined mutation rate for 15.2 Mb of X-degenerate (XDG), X-transposed (XTR) and ampliconic excluding palindromes (rAMP) sequence was 8.71 × 10⁻¹⁰ mutations per position per year (PPPY). We observed a lower rate (P = 0.04) of 7.37 × 10⁻¹⁰ PPPY for 6.1 Mb of sequence from palindromes (PAL), which was not statistically different from the rate of 7.2 × 10⁻¹⁰ PPPY for paternally transmitted autosomes1. We postulate that the difference between PAL and the other MSY regions may provide an indication of the rate at which nascent autosomal and PAL de novo mutations are repaired as a result of gene conversion.
Link
Nature Genetics (2015) doi:10.1038/ng.3246
Loss-of-function variants in ABCA7 confer risk of Alzheimer's disease
Stacy Steinberg et al.
We conducted a search for rare, functional variants altering susceptibility to Alzheimer's disease that exploited knowledge of common variants associated with the same disease. We found that loss-of-function variants in ABCA7 confer risk of Alzheimer's disease in Icelanders (odds ratio (OR) = 2.12, P = 2.2 × 10⁻¹³) and discovered that the association replicated in study groups from Europe and the United States (combined OR = 2.03, P = 6.8 × 10⁻¹⁵).
Link
Nature Genetics (2015) doi:10.1038/ng.3243
Identification of a large set of rare complete human knockouts
Patrick Sulem et al.
Loss-of-function mutations cause many mendelian diseases. Here we aimed to create a catalog of autosomal genes that are completely knocked out in humans by rare loss-of-function mutations. We sequenced the whole genomes of 2,636 Icelanders and imputed the sequence variants identified in this set into 101,584 additional chip-genotyped and phased Icelanders. We found a total of 6,795 autosomal loss-of-function SNPs and indels in 4,924 genes. Of the genotyped Icelanders, 7.7% are homozygotes or compound heterozygotes for loss-of-function mutations with a minor allele frequency (MAF) below 2% in 1,171 genes (complete knockouts). Genes that are highly expressed in the brain are less often completely knocked out than other genes. Homozygous loss-of-function offspring of two heterozygous parents occurred less frequently than expected (deficit of 136 per 10,000 transmissions for variants with MAF less than 2%, 95% confidence interval (CI) = 10–261).
Link
November 17, 2010
mtDNA haplogroup C1 in Icelanders: a genetic mystery
A new subclade of mtDNA haplogroup C1 found in icelanders: Evidence of pre-columbian contact?
Sigríður Sunna Ebenesersdóttir et al.
Although most mtDNA lineages observed in contemporary Icelanders can be traced to neighboring populations in the British Isles and Scandinavia, one may have a more distant origin. This lineage belongs to haplogroup C1, one of a handful that was involved in the settlement of the Americas around 14,000 years ago. Contrary to an initial assumption that this lineage was a recent arrival, preliminary genealogical analyses revealed that the C1 lineage was present in the Icelandic mtDNA pool at least 300 years ago. This raised the intriguing possibility that the Icelandic C1 lineage could be traced to Viking voyages to the Americas that commenced in the 10th century. In an attempt to shed further light on the entry date of the C1 lineage into the Icelandic mtDNA pool and its geographical origin, we used the deCODE Genetics genealogical database to identify additional matrilineal ancestors that carry the C1 lineage and then sequenced the complete mtDNA genome of 11 contemporary C1 carriers from four different matrilines. Our results indicate a latest possible arrival date in Iceland of just prior to 1700 and a likely arrival date centuries earlier. Most surprisingly, we demonstrate that the Icelandic C1 lineage does not belong to any of the four known Native American (C1b, C1c, and C1d) or Asian (C1a) subclades of haplogroup C1. Rather, it is presently the only known member of a new subclade, C1e. While a Native American origin seems most likely for C1e, an Asian or European origin cannot be ruled out.
June 05, 2009
Regional population structure in Iceland (Price et al. 2009)
A new paper shows that such structure exists in Iceland, a population often used for association studies, because of its presumed homogeneity.
From the paper:The ancestry predictions were correct for 47% of samples, correct to within a distance of one region for 74% of samples, and correct to within a distance of two regions for 93% of samples. The accuracy increased to 58% (87% to within one region, 97% to within two regions) when restricting to the 98 (of 250) samples with at least 16 of 32 ancestors from a single region.Figure 3 shows the Icelandic populations in the context of Scotland and Norway. From the paper:
Based on the available data, the optimal linear combination yielded an estimate of 64% Norse and 36% Scottish ancestry, with a standard error of less than 2%. [...] For each region, the estimate of Norse ancestry was between 62% and 65%, with a standard error of less than 2% (except region 1, for which we obtained 61% with a standard error of less than 3%).
Finally:
A consequence of the recent origin of the genetic differences between Icelandic subpopulations is that allele frequency differences follow the null distribution predicted by neutral drift. Thus, there is little risk of false positive associations due to population stratification in disease association studies, despite the fact that there are genuine differences between regions.
PLoS Genetics doi:10.1371/journal.pgen.1000505
The Impact of Divergence Time on the Nature of Population Structure: An Example from Iceland
Alkes Price et al.
Abstract
The Icelandic population has been sampled in many disease association studies, providing a strong motivation to understand the structure of this population and its ramifications for disease gene mapping. Previous work using 40 microsatellites showed that the Icelandic population is relatively homogeneous, but exhibits subtle population structure that can bias disease association statistics. Here, we show that regional geographic ancestries of individuals from Iceland can be distinguished using 292,289 autosomal single-nucleotide polymorphisms (SNPs). We further show that subpopulation differences are due to genetic drift since the settlement of Iceland 1100 years ago, and not to varying contributions from different ancestral populations. A consequence of the recent origin of Icelandic population structure is that allele frequency differences follow a null distribution devoid of outliers, so that the risk of false positive associations due to stratification is minimal. Our results highlight an important distinction between population differences attributable to recent drift and those arising from more ancient divergence, which has implications both for association studies and for efforts to detect natural selection using population differentiation.
Link
January 16, 2009
Ancient mtDNA from Iceland
Using the sequence data described in Table 1, we obtained an estimate of 58% ancestry from Scotland and Ireland for contemporary Icelanders (95% C.I.: 44.6–71.2%). In comparison, the IEMS [DP: Iceland Early Medieval Sample] yielded an estimate of 64.7% (95% C.I.: 36.8–90.3%), indicating a similar excess of matrilineal ancestry from Scotland and Ireland.PLoS Genetics doi: 10.1371/journal.pgen.1000343
Sequences From First Settlers Reveal Rapid Evolution in Icelandic mtDNA Pool
Agnar Helgason et al.
Abstract
A major task in human genetics is to understand the nature of the evolutionary processes that have shaped the gene pools of contemporary populations. Ancient DNA studies have great potential to shed light on the evolution of populations because they provide the opportunity to sample from the same population at different points in time. Here, we show that a sample of mitochondrial DNA (mtDNA) control region sequences from 68 early medieval Icelandic skeletal remains is more closely related to sequences from contemporary inhabitants of Scotland, Ireland, and Scandinavia than to those from the modern Icelandic population. Due to a faster rate of genetic drift in the Icelandic mtDNA pool during the last 1,100 years, the sequences carried by the first settlers were better preserved in their ancestral gene pools than among their descendants in Iceland. These results demonstrate the inferential power gained in ancient DNA studies through the application of population genetics analyses to relatively large samples.
Link
May 12, 2008
Iron Age, Viking Age, and Eskimo mtDNA
See also mtDNA from Iron Age Denmark.
Journal of Archaeological Science
Volume 35, Issue 6, June 2008, Pages 1445-1452
On the elimination of extraneous DNA in fossil human teeth with hypochlorite
Jørgen Dissing, Margrét A. Kristinsdottir and Camilla Friis
Abstract
Elimination of extraneous DNA in fossil specimens is of paramount importance for the successful isolation and analysis of authentic DNA; this is especially true when the specimens are of human origin. Bones and teeth are commonly decontaminated with bleach containing the powerful oxidising hypochlorite ion. The procedures involve either submersion in or wiping with the chlorine agent. Using the radioactive isotope Cl36 we showed that submersion of fossil teeth in solutions of small ions such as Cl− or hypochlorite, ClO−, cause that they migrate right into the pulp. This may lead to the unwanted destruction of authentic DNA. However, using pairs of teeth from the remains of four ancient Europeans (1000–2000 YBP) as well as tooth and hair from an Inuit skull (>300 YBP) we provide evidence that at least some endogenous human fossil DNA survives in powdered pulp/dentin that has been submersed in 2% hypochlorite. Further, we show that powdered pulp/dentin deliberately contaminated with huge amounts of a 414 bp PCR product is effectively decontaminated by suspension in 2% hypochlorite for 5 min. Decontamination of fossil material from teeth may therefore be accomplished by a short direct action of hypochlorite on the powdered specimen rather than less controllable and less efficient external treatments of the whole specimen.
LinkFebruary 11, 2008
Third cousin marriage and maximum fertility
In a paper published today deCODE scientists establish a substantial and consistent positive correlation between the kinship of couples and the number of children and grandchildren they have. The study, which analyzes more than 200 years of deCODE’s comprehensive genalogical data on the population of Iceland, shows that couples related at the level of third cousins have the greatest number of offspring.It is of course clear why close relatives (closer than 3rd cousins) should have fewer children: this is due to the well known phenomenon of inbreeding depression. However, why should fertility increase up to a certain degree of kinship (~3rd cousins) and decrease after that?
One explanation is that there is some biological factor which decreases fitness as genetic dissimilarity increases. Perhaps more distantly related genomes don't "mesh" that well.
I suggest that the phenomenon could be partially explained by the fact that as kinship decreases, the age distribution of potential marriage partners becomes more varied.
A man's age difference from his sister is constrained by the fact that one's mother has a limited reproductive age range. In other words, one's sister is usually a few years older or younger than oneself, and rarely much older or younger.
But, if we look at first or second cousins, this difference increases. Your uncle or aunt is younger or older than your parents, and correspondingly their children can be more different than you in age.
As kinship decreases, your n-degree cousins become less constrained to be close to you in age. They could be much much older (if they are descended from short branches of one's family tree), or much much younger (if they are descended from long ones).
Of course, men usually marry women who are not that different from them in age (see data for Norway). But, the opportunity to marry someone much younger (or much older) than oneself is greater as kinship decreases.
It would be interesting to see data on average age differences correlated with degree of kinship in Iceland. If it turns out that, say, third-cousin marriage partners are less different in age than fourth-cousin partners, then an alternative explanation may be behind the observed fertility curve: age difference among spouses is negatively correlated with fertility.
August 27, 2006
Population age structure and prosperity
This relation between the number of people who aren’t of working age and the number of people who are is captured in the dependency ratio. In Ireland during the sixties, when contraception was illegal, there were ten people who were too old or too young to work for every fourteen people in a position to earn a paycheck. That meant that the country was spending a large percentage of its resources on caring for the young and the old. Last year, Ireland’s dependency ratio hit an all-time low: for every ten dependents, it had twenty-two people of working age. That change coincides precisely with the country’s extraordinary economic surge.
...
Economists have long paid attention to population growth, making the argument that the number of people in a country is either a good thing (spurring innovation) or a bad thing (depleting scarce resources). But an analysis of dependency ratios tells us that what’s critical is not just the growth of a population but its structure. “The introduction of demographics has reduced the need for the argument that there was something exceptional about East Asia or idiosyncratic to Africa,” Bloom and Canning write, in their study of the Irish economic miracle. “Once age-structure dynamics are introduced into an economic growth model, these regions are much closer to obeying common principles of economic growth.”
I was extremely pleased to see this point being argued. I had made a similar observation back in 2003 in Fishing in the Pond of Correlation.
Let's take factor #1: Demographic Structure. I used % of population under age 15 as a proxy for this factor. The intuition goes that since children don't have the capacity (muscle or intellectual) to produce as much as adults, a nation with a large number of children will have a lower per capita income.Indeed, there is a -0.71 correlation between % of population under 15 and per capita PPP, accounting for 50% of the variance of the dependent variable.
Roughly half the population in the world is women. Women get pregnant and while pregnant or rearing young children can't be as productive as men. So, we expect that nations where women have lots of children will have a lower per capita income, simply because half their population spends quite a lot of time being pregnant, breastfeeding or changing diapers. This is factor #2, which also relates to Demographic Structure.
Steve brings the example of Ukraine as an argument against the idea that population structure affects prosperity. I had actually observed this discrepancy in my original post:
Finally, I list the 10 countries whose per capita PPP is most overestimated by the model: Ukraine, Georgia, Bulgaria, Croatia, Cuba, Romania, Bosnia and Herzegovina, Moldova, Rep. of, Sri Lanka, Russian Federation
It is clear that adding "democracy" as a value, would help eliminate these residual errors. The 10 countries whose income is most underestimated are: Australia, Brunei Darussalam, Switzerland, Denmark, Canada, Equatorial Guinea, Norway, Iceland, Ireland, United States
It is notable that many of these countries have abundant natural resources (e.g., Iceland, Norway, Brunei), special financial status (Switzerland), or a large territory with respect to their population (Canada, Australia).
So, yes, demographic age structure is indeed a major determinant of economic prosperity as measured by per capita PPP, more so, once we control for factors such as recent history or natural resources.
Update (Aug 28): I have re-uploaded the data file in the old entry; it was missing from the old blog archive in 50webs. The link to the UNDP report from 2003 is also outdated. Here is a link to the latest 2006 report.
Here are the statistics on population under age 15. and PPP per capita from the UNDP website.
After repeating the calculations, I have found a correlation of -0.69 between population under age 15 and GDP per capita (US$ PPP). The scatterplot is even more informative.
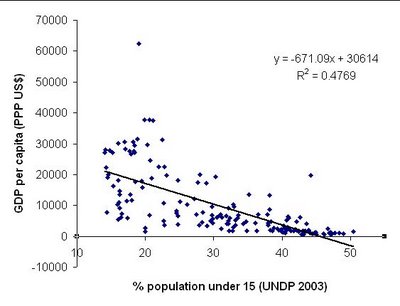
It is clear that countries with large populations of dependents (on the right of the figure) all have small per capita income. Other factors may play a bigger role in countries with moderate and small populations of dependents.
The outliners in the graph are Equatorial Guinea and Luxembourg. If they are removed, the correlation becomes even more pronounced (-0.73)
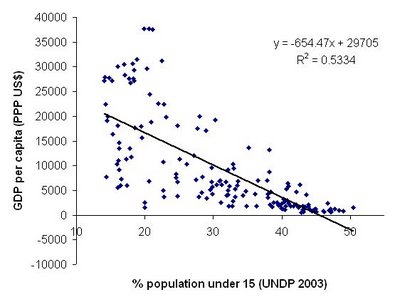
I have often tried tried to show (e.g., for disease or hair dye sales) that we do not need to postulate elaborate explanations for phenomena when simpler ones suffice.
In this case, the lower per-capita GDP is a logical consequence of a high population of children: Per-capita GDP can be expressed as (Number of productive individuals)*(Average Individual Production)/(Total Population). Countries with a great number of children are expected to have a low (Number of productive individuals)/(Total Population Ratio), or conversely a high dependency ratio, and hence we expect them to have a low per capita GDP! This is a logical consequence and requires no assumptions about, say, the relative ability of different populations.
So, why should we bother with Lynn-ian speculations about intelligence and prosperity which depend on the unsubstantiated assumption of substantial genetic differences in cognitive ability among major races when a simpler model, which makes no such assumptions is able to capture the data as well, or even better?
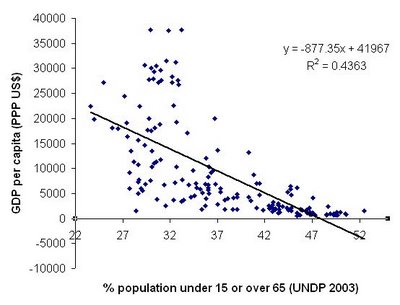
Update II: A reader makes the interesting point that children, rather than dependents are the critical parameter. I have calculated the correlation between GDP per capita (US$ PPP) and population over 65 (without the outliers mentioned above) and obtained a value of +0.7, consistent with the idea that people in prosperous societies live longer.
Then I added up the fraction of people age less than 15 with that more than 65, to obtain a total fraction of the population that is expected to be "dependent" on the productive population between ages 15 and 65. The new correlation is -0.66. Thus, both the fraction of the productive population (aged 15 to 65) as well as the fraction of the adult population (aged 15+) both have roughly the same explanatory power.
Update III (Aug 29): Here is a comment I left in Jane Galt's topic on the subject:Observable GDP/capita is not caused by any single factor. However, it is partially caused by demographic structure. By "caused" I mean that if we change the variable "dependency ratio" then we expect to immediately and predictably change the variable "GDP per capita".Incidentally, as I have mentioned in my blog, the reduction in per capita income is not caused only directly from the smaller fraction of active individuals: an even smaller fraction of individuals can really be active, since a substantial part of them, especially young mothers, spend a lot of time in activities of little economic value.
For example, imagine a toy society in which active individuals produce 100 units. If one society has 50% dependents, and another 25% dependents, then we expect the per capita income of the first one to be 50 and of the second one to be 75. But, the first society also has lots of individuals who do not produce a lot because they take care of the dependent population. If, say, 2 dependents use up the resources of an active individual, then the "real" active fraction in the first population will be 25%, and 62.5% in the second one, and the corresponding per capita income will of course be 25 and 62.5. Thus, even though individuals produce exactly the same in both societies, demographic factors cause one to exhibit 2.5 more per capita GDP than the other.
August 09, 2006
August 1 update of YHRD
The following populations were added today: Iceland, Elista (Russia, Kalmyks), Ecuador (Mestizo, Afroamerican, Quichua, Huaorani), Bama (China, Yao), Chengdu (China, Han), Zhenning (China, Buyi), Molidawa (China, Daur and Ewenki), Yuanjiang (China, Hani), Tongjiang (China, Hezhen), Tongxin (China, Hui), Yanji (China, Korean), Tongshi (China, Li), Xiuyan (China, Manchu), Alihe (China, Oroqen), Maowen (China, Qiang), Luoyuan (China, Fujian), Lhasa (China, Tibet), Yili (China, Xibe, Uigur and Han), Harbin (China, Han), Hailar (China, Mongolian), Lanzhou (China, Han), Liannan (China, Yao), Meixian (China, Han), Urumqi (China, Uigur), Mongolia, Japan, Korea, Gdansk (Poland), Nepal, Sao Paulo State (Brazil, European, African, Oriental and Pardo), Buenos Aires (Argentina), Santa Fe (Argentina), Mendoza (Argentina), Rio Negro (Argentina), Chubut (Argentina), Misiones (Argentina), Corrientes (Argentina), Formosa (Argentina), Chaco (Argentina), Salta (Argentina). We would like to thank the following colleagues for submitting these population samples: Daniel Corach and his group (Buenos Aires), Rune Andreassen and his group (Oslo, Norway), Ivan Nasidze and his group (Leipzig, Germany), Fabricio Gonzalez and his group (Quito, Ecuador), Chris Tyler-Smith, Yali Xue and their group (Cambridge, UK), Richard Pawlowski and his group (Gdansk, Poland), Rogerio Nogueira Oliveira and his group (Sao Paulo, Brazil), Gustavo Penacino and his group (Buenos Aires, Argentina), Emma Parkin, Mark Jobling and their group (Leicester, UK).
So, head on there to see if you get any new matches for your Y-chromosome samples.
March 12, 2006
Migration and evolution
One promising possibility is the old chestnut question about why the personalities of today's Scandinavians don't seem all that much like their Viking ancestors. It's possible that the aggressive Viking personality was a winning hand in Darwinian terms back in the Dark Ages when other Europeans didn't have adequate defenses against Viking predations. But by the Middle Ages, Europeans had evolved the security system called feudalism and the Vikings were forced to stay home. The most aggressive then tended to slaughter each other in the kind of honor feuds described in Icelandic sagas, while the milder sorts kept their heads down, survived, and multiplied. (On the other hand, I'm rather skeptical of the notion that one group is more or less violent than another group, since humans seem to have a lot of capacity for violence. A nonviolent group probably wouldn't have survived. The obvious differences are in tendencies toward organized and disorganized violence.)
I was planning to compose a longer entry on the importance of migration in human evolution, but I don't think I will have the time to finish it (with all the morphing that I've been doing lately :) ) But, here is the gist of the idea:
Often, when we think of evolution, we think of it as being driven by differences in genetic fitness of different phenotypes, which correspond to differences in genetic fitness of individual "selfish" genes. Thus, we think of evolution if one phenotype or gene is more successful than another, and hence produces more of its copies in the next generation.
However, evolution can still occur even if all phenotypes and genes are equally successful in reproducing themselves. This is due to the fact that human populations are geographically and socially structured.
If in a given environment E, phenotype A is superior to phenotype B, then we would expect (over time) to see more of phenotype A and less of phenotype B. That is the essence of selection.
But, in the words of Epicurus "necessity is evil, but there is no reason to live under necessity".
In other words, humans -being the adaptible creatures that we are- often don't stick around in adverse environment E. Rather, quite often, the members of the disadvantaged phenotype B will find a new niche for themselves, either a new social niche, or -by migration- a new geographical one.
This type of population partition is -I believe- an important feature of human evolution, because of our enormous capacity to foresee the future and plan ahead.
Let's take Sailer's Vikings who inspired this blog entry. The Vikings stand at the middle of a long history of migrations of Germanic peoples out of northern Europe. Importantly, the people who left northern Europe (e.g., the Visigoths , the Varangians, the Vandals, etc.) represented the more active and warlike elements in the local population. They were the ones who when faced with poverty, climatic change, or population overflow, decided to find a new home by migration, war, and conquest. Consequently, modern Scandinavians are descended from the leftovers of those great movements. So, it should not come as a surprise that they are so passive, peace-loving and unlike the medieval Scandinavians who terrorized Europe.
Even earlier events in human evolution can be explained by looking at migration processes. For example, Polynesians and Ethiopians are both descended from the same African ancestors of the Upper Paleolithic. But, whereas the Ethiopians stayed close to the human cradle, the Polynesians are descended from the people who moved across Eurasia in a few thousand years and then made an almost crazy journey of colonization with primitive boats across the vast expanses of the Pacific Ocean. So, we should be willing to concede that some of the differences between the two peoples are due not only to long separate evolution, but also to the different kinds of people that would end up in the middle of the Pacific vs. the ones who would remain in the Horn of Africa.
The recent Americans are of course another classical example of the same process. European Americans differ from Europeans because they evolved (biologically and culturally) separately from their European ancestors, but they are also different because they are descended from a particular kind of European, who, being uncomfortable at home, decided to make a fresh start in the New World.
The destinations of migration processes tend to accumulate two kinds of individuals:
The adventurer type is the one who perceives opportunity and seizes it. The early Neolithic colonization, or the early American colonization is probably attributed to adventurer types.
The outcast type is the one who is uncompetitive and seeks a new homeland where competition is less fierce. The later American colonization, and probably the colonization of the ecologically extreme regions of the world was (is?) effected chiefly by outcast types.
(More later...)
February 09, 2006
Ethnicity-specific disease risk in African Americans
This paper shows how a particular gene variant was introduced to the African American population by admixture with Europeans and how African Americans are at a higher risk of heart disease because of it.
This illustrates how a gene that has originated in one population can lead to problems when it is found in a different genetic-environmental context.
Nature Genetics 38, 68 - 74 (2006)
Published online: 10 November 2005; | doi:10.1038/ng1692
A variant of the gene encoding leukotriene A4 hydrolase confers ethnicity-specific risk of myocardial infarction
Anna Helgadottir et al.
Variants of the gene ALOX5AP (also known as FLAP) encoding arachidonate 5-lipoxygenase activating protein are known to be associated with risk of myocardial infarction1. Here we show that a haplotype (HapK) spanning the LTA4H gene encoding leukotriene A4 hydrolase, a protein in the same biochemical pathway as ALOX5AP, confers modest risk of myocardial infarction in an Icelandic cohort. Measurements of leukotriene B4 (LTB4) production suggest that this risk is mediated through upregulation of the leukotriene pathway. Three cohorts from the United States also show that HapK confers a modest relative risk (1.16) in European Americans, but it confers a threefold larger risk in African Americans. About 27% of the European American controls carried at least one copy of HapK, as compared with only 6% of African American controls. Our analyses indicate that HapK is very rare in Africa and that its occurrence in African Americans is due to European admixture. Interactions with other genetic or environmental risk factors that are more common in African Americans are likely to account for the greater relative risk conferred by HapK in this group.
Link
December 13, 2005
Y chromosomes of Norway
From the paper:
Haplogroup frequency distributions in the different Norwegian regions are presented (Fig. 1). The frequency of P*(xR1a) varied from 26% in the east to 45% in the south, BR*(xDE, J, N3, P) from 30% in the west to 42% in the south and R1a from 13% in the south to 32% in the middle. N3 was most frequent in the north (11%; 18.6% in the northernmost county Finnmark) and totally absent in the south. Haplogroup DE and J were rare in all regions. We observe a relatively high frequency of P*(xR1a) and R1a in the population sample from south-west and east, respectively.
Frequency of haplotypes:
Uralic admixture in the non-Saami Norwegian population:
Haplogroup N3 has been interpreted as a signature of Uralic Finno-Ugric speaking males migrating to northern Scandinavia about 4000–5000 years ago [9], [17], [35] and [60]. In the present study, N3 is observed at 4% in the overall population and at 11% in the northern region corresponding to 150,000 and 50,000 inhabitants, respectively. These numbers exceed the total number of Saami inhabitants, which is officially recognized as about 50,000 (http://www.sametinget.se). In northern Norway, the N3 percentage is 18.6% in Finnmark, 8.6% in Troms and 8.4% in Nordland (which are the three northernmost counties—Nordland being located to the south of the other two (Supplementary Data Online, Fig. 2)). There is thus a considerable pool of Saami and/or Finnish Y-chromosomes in the Norwegian population and particularly in the north.
Also of interest is the discovery of a new haplogroup:
A new haplogroup, not described earlier, was found in a single sample. Deduced from its biallelic type, it might represent a new 12f2 deletion within haplogroup P*(xR1a). The haplogroup it defines has been given the temporary name P*(xR1a)/12f2c (M. Jobling personal communication). Its haplotype composition is 15-10-17-24-10-13-14-11,14-12. There are already two known 12f2 deletions within hgJ and hgD2.
Forensic Sci Int. 2005 Dec 6; [Epub ahead of print] Links
Geographical heterogeneity of Y-chromosomal lineages in Norway.
Dupuy BM, Stenersen M, Lu TT, Olaisen B.
Y-chromosomal variation at five biallelic markers (Tat, YAP, 12f2, SRY(10831) and 92R7) and nine multiallelic short tandem repeat (STR) loci (DYS19, DYS389I, DYS389II, DYS390, DYS391, DYS392, DYS393, DYS385I/II and DYS388) in a Norwegian population sample are presented. The material consists of 1766 unrelated males of Norwegian origin. The geographical distribution of the population sample reflects fairly well the population distribution around the year 1942, which is the median birth year of the index persons. Seven hundred and twenty-one different Y-STR haplotypes but 726 different lineages (Y-STRs plus biallelic markers) were encountered. We observed six known (P*(xR1a), BR(xDE, J, N3, P), R1a, N3, DE, J), and one previously undescribed haplogroup (probably a subgroup within haplogroup P*(xR1a)). Four of the haplogroups (P*(xR1a), BR(xDE, J, N3, P), R1a and N3) represented about 98% of the population sample. The analysis of population pairwise differences indicates that the Norwegian Y-chromosome distribution most closely resembles those observed in Iceland, Germany, the Netherlands and Denmark. Within Norway, geographical substructuring was observed between regions and counties. The substructuring reflects to some extent the European Y-chromosome gradients, with higher frequency of P*(xR1a) in the south-west and of R1a in the east. Heterogeneity in major founder groups, geographical isolation, severe epidemics, historical trading links and population movements may have led to population stratification and have most probably contributed to the observed regional differences in distribution of haplotypes within two of the major haplogroups.
Link
September 10, 2005
Ancient British mtDNA
UPDATE
The comparative modern mtDNA were taken from the following regions. It is a bit peculiar that more continental European samples are missing, while Armenians and Palestinians are listed.
The comparative data set from modern populations of Europe for the founder and genetic distance analyses consisted of mtDNA HVS-I sequences from the following populations: Armenia (N=191), England (N=258), Estonia (N=149), northern France (N=101), Finland (N=176), Iceland (N=467), Norway (N=565), northern Germany (N=107), Palestine (N=117), Saami (N=176), Scotland (N=981), Spain (N=181) and Western Isles (N=181).Molecular Biology and Evolution (advance access)
Tracing the Phylogeography of Human Populations in Britain Based on 4th-11th Century mtDNA Genotypes
A. Töpf et al.
Abstract
Some of the transitional periods of Britain during the first millennium AD are traditionally associated with the movement of people from continental Europe, composed largely of invading armies (e.g. the Roman, Saxon and Viking invasions). However, the extent to which these were migrations (as opposed to cultural exchange) remains controversial. We investigated the history of migration by women by amplifying mtDNA from ancient Britons who lived between approximately 300-1,000 AD, and compared these with 3,549 modern mtDNA database genotypes from England, Europe and the Middle East. The objective was to assess the dynamics of the historical population composition by comparing genotypes in a temporal context. Towards this objective we test and calibrate the use of rho-statistics to identify relationships between founder and source populations. We find evidence for shared ancestry between the earliest sites (predating Viking invasions) with modern populations across the north of Europe from Norway to Estonia, possibly reflecting common ancestors dating back to the last glacial epoch. This is in contrast with a late Saxon site in Norwich, where the genetic signature is consistent with more recent immigrations from the south, possibly as part of the Saxon invasions.
Link
July 19, 2005
Neighborhood segregation in the United States
Timberlake and Iceland examined all 323 of the nation's metropolitan areas, using Census data from 1970-2000. They searched for trends by exploring four key measures of residential inequality: dissimilarity, entropy, isolation and net difference. The researchers focused on four racial and ethnic groups: Caucasians, African Americans, Asians and Latinos. "African Americans continue to be the most segregated group from whites, but we also found that on average, African Americans have experienced greater declines in segregation," Timberlake says. "So, if that trend continues, Latinos will become the most segregated population by the middle-to-end of the next decade," he says.
May 19, 2005
The importance of large genomic differences
However, two genomes may differ in other ways as well. Entire segments of DNA may be duplicated in some, or missing in others, or they could exist, but written "backwards".
Until recently, it was generally assumed that differences between individuals and populations were due to the really small changes in our genes. But, as reported in Nature, scientists are discovering that the large differences in which big chunks of DNA are duplicated, missing, or inverted, may be even more important for explaining human variation.
Two years ago, a group of researchers led by Michael Wigler at Cold Spring Harbor Laboratory found the first evidence that some of us have more copies of certain genes than do others (R. Lucito et al. Genome Res. 13, 2291−2305; 2003). And at last week's meeting, Evan Eichler of the University of Washington in Seattle reported that this is just the beginning: not only do we carry different copy numbers of parts of our DNA, we also have varying numbers of deletions, insertions and other major rearrangements in our genomes.
In fact, Eichler found at least 297 places in the genome where different individuals have different forms of these major structural variations. At these spots, some of us might carry a major deletion, for example, or an extra hundred bases of DNA.
But do such differences mean anything? Here, too, fresh evidence paints an intriguing picture. In January, scientists at the Iceland-based company deCODE Genetics found a long inversion — a stretch of DNA that is flipped around backwards — that is common in Europeans, but not in Asians and Africans (H. Stefánsson et al. Nature Genet. 37, 129−137; 2005). They also found that women who have this inversion bear more children than those who don't — a classic sign that the inversion confers an evolutionary advantage.
At the Cold Spring Harbor meeting, scientists presented more evidence that structural differences are important in human evolution. Duc-Quang Nguyen, a postdoctoral fellow in Chris Ponting's laboratory at the University of Oxford, UK, reported an analysis of areas where there are different numbers of copies of DNA stretches. Nguyen found that natural selection is actively working on these genes.
What's more, he found that many of these genes belong to groups that seem to help us interact with our environment. For instance, many work in the immune system, and affect how we fight off disease. These are exactly the sort of genes that could explain our diversity — why some of us get asthma when exposed to air pollution, or why some of us can eat plenty of cheeseburgers without gaining weight.
"We knew these variations existed, but this year we're asking, do they matter?" says Ewan Birney, head of bioinformatics for the European Molecular Biology Laboratory, based in Cambridge, UK. "The answer seems to be yes."
April 11, 2005
Family-based Viking settlement of Shetland and Orkney
Genetic evidence for a family-based Scandinavian settlement of Shetland and Orkney during the Viking periods.
Goodacre S et al.
The Viking age witnessed the expansion of Scandinavian invaders across much of northwestern Europe. While Scandinavian settlements had an enduring cultural impact on North Atlantic populations, the nature and extent of their genetic legacy in places such as Shetland and Orkney is not clear. In order to explore this question further, we have made an extensive survey of both Y-chromosomal and mitochondrial DNA (mtDNA) variation in the North Atlantic region. Our findings indicate an overall Scandinavian ancestry of approximately 44% for Shetland and approximately 30% for Orkney, with approximately equal contributions from Scandinavian male and female subjects in both cases. This contrasts with the situation for the Western Isles, where the overall Scandinavian ancestry is less ( approximately 15%) and where there is a disproportionately high contribution from Scandinavian males. In line with previous studies, we find that Iceland exhibits both the greatest overall amount of Scandinavian ancestry (55%) and the greatest discrepancy between Scandinavian male and female components. Our results suggest that while areas close to Scandinavia, such as Orkney and Shetland, may have been settled primarily by Scandinavian family groups, lone Scandinavian males, who later established families with female subjects from the British Isles, may have been prominent in areas more distant from their homeland.
Link
January 17, 2005
3-million year old polymorphism in Europeans
The presence of such an ancient mutation is still a mystery, but two alternative explanations are proposed. The first one is that the polymorphism has been maintained in the human gene pool through balancing selection, which would indicate that its fitness benefits in heterozygotes might have corresponding fitness costs in homozygotes, which remain to be discovered. Since the polymorphism is more frequent in Europeans, it may be the case that there is something in the European environment which allows the fitness benefit to manifest itself, similar to the malarial environments in many places of the world which allow sickle-cell alleles to persist.
The second explanation -which is more likely in my opinion- is that ancestral Caucasoids underwent admixture with a different type of hominin which survived in Western Eurasia and which partially interbred with incoming modern sapiens humans. The mutation subsequently may have spread in the Caucasoid population by balancing selection (since it has not been fixed), and its absence in other populations may indicate simply that they did not interbreed with the different type of hominin.
As far as we know, during the radiation of anatomically modern Homo sapiens, the only candidate species for hybridization with it would be Homo neandertalensis. It's possible then that this was the source of the mutation in question, but since Neanderthals are also a relatively young species (less than 1 million years old) it may be the case that they also received it from a previous hominin species.
After the contested Flores hominin and the recent discovery of possible hybridization of Mongoloids with Homo erectus, this new study presents a new mystery about the origin of modern humans. It remains to be seen how these developments will eventually affect the current picture about human origins which insists on a recent African origin for our species. mtDNA research on humans and Neanderthals suggests no significant hybridization between the two species, and the arguments of the multiregionalists have been severely criticized, but I suspect that in the end the Out-of-Africa theory will have to accommodate the presence of (at least limited) admixture from older forms of Homo in the origins of modern humankind.
For more info Genes Promoting Fertility Are Found in Europeans, Scientists Find Effect of Natural Selection on Human Genome, Gene Arrangement Makes Some Europeans More Fertile.
Nature Genetics (published online)
A common inversion under selection in Europeans
Hreinn Stefansson et al.
A refined physical map of chromosome 17q21.31 uncovered a 900-kb inversion polymorphism. Chromosomes with the inverted segment in different orientations represent two distinct lineages, H1 and H2, that have diverged for as much as 3 million years and show no evidence of having recombined. The H2 lineage is rare in Africans, almost absent in East Asians but found at a frequency of 20% in Europeans, in whom the haplotype structure is indicative of a history of positive selection. Here we show that the H2 lineage is undergoing positive selection in the Icelandic population, such that carrier females have more children and have higher recombination rates than noncarriers.
Link
October 15, 2004
2004 World Sex Survey
- Age of first sex: Iceland 15.7, Greece 17.8, Vietnam 19.8 (years)
- Unprotected sex: India 20, Greece 45, Sweden 64 (%)
- Frequency of sex: Japan 46, Greece 133, France 137 (times per year)
- Frequency of orgasms: China 19, Greece 47, Italy 61 (%)
- Number of sexual partners: Vietnam 2.5, Greece 10.4, China 19.3
