Showing posts with label Endogamy. Show all posts

February 22, 2010

No anthropometric differences between children of endogamous vs. exogamous marriages in Sardinia

Am J Hum Biol. 2010 Feb 12.

Offspring from endogamic vs. exogamic matings: Absence of anthropometric differences among Sardinian children (Italy).

Sanna E, De Micco A, Palmas L, Soro MR, Vallascas E, Danubio ME.

This study evaluates possible differences in body dimensions among children from matings of different exogamy levels. The cross-sectional sample consisted of 867 children, 435 males, and 432 females, 6-10 years old, attending elementary schools in the metropolitan area of Cagliari, the capital of Sardinia (Italy). The children were divided into two groups according to the level of exogamy. The first group consisted of children of parents born in the same Sardinian municipality and was considered endogamous sensu stricto. The second group included children of parents born in municipalities from different Sardinian linguistic domains and was considered exogamous. The Mann-Whitney test did not reveal significant differences between the two groups of children in the mean rank values of the 36 anthropometric variables considered, with the exception of cephalic circumference in males and chest depth in females. In particular, there were no significant differences for anthropometric variables considered to be indirect indicators of nutritional status: sum of skinfolds, waist/hip ratio, body mass index, total upper arm area, upper arm muscle area, and upper arm fat area. The results indicate that Sardinian children from marriages of different exogamy levels do not differ in body dimensions if they grow up with similar nutritional and socioeconomic conditions.

Link

November 26, 2009

Τwo papers on Genetic structure of Han Chinese in AJHG

A couple of new papers on population structure in the Han Chinese have just appeared in the American Journal of Human Genetics. My comments will follow once I read the two papers.

UPDATE (on Chen et al.):

The PCA plot on the left from Chen et al. shows clearly the north-south cline of genetic variation in China. While there are no apparent barriers within the Han ethnic group, it is clear that subsets of Han Chinese can be perfectly distinguished from each other by just looking at the first two principal components.

From the paper:
The one-dimensional subpopulation structure of the Han Chinese population (along PC1) showed a close resemblance to their sampling location son a geographic map, and there is a very high correlation of 0.93 between the mean PC1 values of samples and the median latitudes of the provinces

The results of the STRUCTURE analysis are also very interesting as they show the expected clinality of variation within China rather than sharp distinctions, paralleling the situation in the landmass of Europe. However, at K=3 the major component of the Japanese (JPT) is shown to be a low-level component within the Chinese. It's hard to interpret this, but a first hypothesis could be that the Japanese are descended from an earlier Mongoloid genetic stratum that has since been admixed in the Asian mainland with other Mongoloid groups, but retained its "purity" in the Japanese islands.

The American Journal of Human Genetics, 25 November 2009
doi:10.1016/j.ajhg.2009.10.016

Genetic Structure of the Han Chinese Population Revealed by Genome-wide SNP Variation

Jieming Chen et al.

Abstract

Population stratification is a potential problem for genome-wide association studies (GWAS), confounding results and causing spurious associations. Hence, understanding how allele frequencies vary across geographic regions or among subpopulations is an important prelude to analyzing GWAS data. Using over 350,000 genome-wide autosomal SNPs in over 6000 Han Chinese samples from ten provinces of China, our study revealed a one-dimensional “north-south” population structure and a close correlation between geography and the genetic structure of the Han Chinese. The north-south population structure is consistent with the historical migration pattern of the Han Chinese population. Metropolitan cities in China were, however, more diffused “outliers,” probably because of the impact of modern migration of peoples. At a very local scale within the Guangdong province, we observed evidence of population structure among dialect groups, probably on account of endogamy within these dialects. Via simulation, we show that empirical levels of population structure observed across modern China can cause spurious associations in GWAS if not properly handled. In the Han Chinese, geographic matching is a good proxy for genetic matching, particularly in validation and candidate-gene studies in which population stratification cannot be directly accessed and accounted for because of the lack of genome-wide data, with the exception of the metropolitan cities, where geographical location is no longer a good indicator of ancestral origin. Our findings are important for designing GWAS in the Chinese population, an activity that is expected to intensify greatly in the near future.

Link

The American Journal of Human Genetics, 25 November 2009
doi:10.1016/j.ajhg.2009.10.015

Genomic Dissection of Population Substructure of Han Chinese and Its Implication in Association Studies

Shuhua Xu et al.

Abstract

To date, most genome-wide association studies (GWAS) and studies of fine-scale population structure have been conducted primarily on Europeans. Han Chinese, the largest ethnic group in the world, composing 20% of the entire global human population, is largely underrepresented in such studies. A well-recognized challenge is the fact that population structure can cause spurious associations in GWAS. In this study, we examined population substructures in a diverse set of over 1700 Han Chinese samples collected from 26 regions across China, each genotyped at ∼160K single-nucleotide polymorphisms (SNPs). Our results showed that the Han Chinese population is intricately substructured, with the main observed clusters corresponding roughly to northern Han, central Han, and southern Han. However, simulated case-control studies showed that genetic differentiation among these clusters, although very small (FST = 0.0002 ∼0.0009), is sufficient to lead to an inflated rate of false-positive results even when the sample size is moderate. The top two SNPs with the greatest frequency differences between the northern Han and southern Han clusters (FST > 0.06) were found in the FADS2 gene, which associates with the fatty acid composition in phospholipids, and in the HLA complex P5 gene (HCP5), which associates with HIV infection, psoriasis, and psoriatic arthritis. Ingenuity Pathway Analysis (IPA) showed that most differentiated genes among clusters are involved in cardiac arteriopathy (p less than 10−101). These signals indicating significant differences among Han Chinese subpopulations should be carefully explained in case they are also detected in association studies, especially when sample sources are diverse.

November 09, 2009

Population affinities of Parsis

International Journal of Osteoarchaeology doi:10.1002/oa.1123

Population affinities of Parsis in the Indian subcontinent

Manjari Jonnalagadda et al.

Abstract

The present study was an attempt to document changes in frequencies of dental morphology traits and understand phenetic affinities of Parsis, who migrated to the Indian subcontinent around the 8th century. Despite successfully integrating themselves into the Indian society, they have retained their ethnicity and distinct cultural practices. This study was conceived as a result of an excavation at the site of Sanjan, Gujarat which, as per historical records, is believed to be the first town in the Indian subcontinent with a large Parsi settlement thereby facilitating a diachronic comparison between the ancestral and extant Parsi groups. We compared and analysed dental traits between the two groups expecting a very close relationship between them owing to their ancestor-descendent relationship. Eleven discrete dental traits were selected and scored using the Arizona State University Dental Anthropology System (ASUDAS). Frequency changes were assessed by comparing trait frequencies; whereas phenetic affinity between Parsis was assessed by statistically comparing them with 13 populations using Smith's mean measure of divergence (MMD) statistic. Comparison of dental trait frequencies between Sanjan and extant Parsi samples show significant differences in incisor morphology, Carabelli cusp and Hypocone development. Trait frequencies, MMD values and 2D multidimensional scaling (MDS) plot indicate that extant Parsis and Sanjan samples are distantly separated from each other. Extant Parsis show closer affinity to low caste Mahars and tribal Madia Gonds than South and Central Asian groups. Sanjan is distant from all other groups including extant Parsis. It is likely that genetic drift accentuated by their small numbers and strict endogamy has resulted in divergence of Parsi groups. Similarly, their convergence with Maharashtran groups indicates admixture of Parsis with local groups, which supports earlier conducted mtDNA studies.

Link

September 24, 2009

560K SNP study reveals dual rigin of Indian populations (Reich et al. 2009)

In lieu of a prologue, Herodotus and Arrian on the two groups inhabiting ancient India:

The Indians wore cotton dresses, and carried bows of cane, and arrows also of cane with iron at the point. Such was the equipment of the Indians, and they marched under the command of Pharnazathres the son of Artabates. [...] The eastern Ethiopians- for two nations of this name served in the army- were marshalled with the Indians. They differed in nothing from the other Ethiopians, save in their language, and the character of their hair. For the eastern Ethiopians have straight hair, while they of Libya are more woolly-haired than any other people in the world.


The appearance of the inhabitants, too, is not so far different in India and Ethiopia; the southern Indians resemble the Ethiopians a good deal, and, are black of countenance, and their hair black also, only they are not as snub-nosed or so woolly-haired as the Ethiopians; but the northern Indians are most like the Egyptians in appearance.
The paper establishes a number of different facts, that have been hinted at in previous autosomal studies, and studies based on Y chromosomes and mtDNA:
  1. Modern Indians are derived from two ancestral populations. The first one, termed Ancestral North Indians (ANI) were Caucasoids, the other, Ancestral South Indians (ASI) were distinct from both Caucasoids and Mongoloids in a Eurasian context.
  2. The ASI no longer exist in non-admixed form, but in various degrees of admixtures with ANI; the closest living population to the ASI are the Andaman Islanders.
  3. Upper castes are higher in ANI ancestry than middle and lower castes. ANI percentages of ancestry are correlated with Western Eurasian Y chromosomes (P=0.04) and mtDNA (P=0.08).
  4. Indo-European speakers are higher in ANI ancestry than Dravidian speakers.
This paper does seem to imply that Indians are a mixture of Western Eurasians and indigenous Indians. However, we should not conclude that they are a simple 2-way mix of invading Indo-Aryans and indigenous Dravidians: for example, the ANI component could be a palimpsest of different Caucasoid populations who came to the subcontinent over time. For example, we do know that South Americans are composed of Amerindians, Caucasoids, and Negroids in different proportions of admixture, but this does not mean that there was a simple mix between the three, but rather a continuous process of migration that brought (and continues to bring) people into the New World. It remains to be seen which groups participated in the diffusion of the ANI component in India.

However, the fact that ANI is correlated with caste status and language does suggest that the Indo-Aryan migration who brought Indo-European languages to India has not been totally wiped out genetically. Indo-European populations have maintained a higher degree of ancestry from the ANI component, and upper caste Indo-Europeans have maintained an even higher degree of such ancestry.

The beauty of this study is that it does not consider either a simple mixture model (like STRUCTURE does) in which populations are derived from 2 or more ancestral ones, or a simple branching model, in which populations are derived tree-like from a common root with no admixture between them. Rather, they consider both tree-like divergence of populations followed by admixture. The following figure from the paper illustrates this:
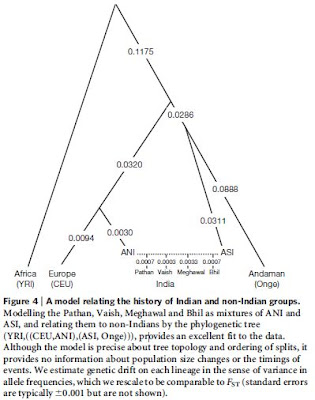
We can see that (i) the relationship between Andaman Islanders and ASI is not particularly close, although they do form a clade in relation to the other populations, (ii) the relationship between CEU and ANI is fairly close (in this context). The authors further determine (in the supplement) that CEU and ANI do form a clade separate from the non-IE speaking Adygei from the Caucasus.

What is now needed is to calculate the genetic distances between ANI and a wide assortment of Western Eurasian populations. Indeed, as these populations have undergone their own processes of admixture (e.g., Near Eastern populations with Arabs, Turks with Central Asians, Russians with Finns, Central Asian Iranians with Turks and Mongols, and so on), we cannot generally infer that the source population(s) of the ANI component are extant in non-admixed form. Nonetheless, the discovery of a strong relationship of ANI with a West Eurasian population may help us pinpoint the geographical origin of ANI outside India.

The paper does demolish some theories that have been popular in some circles:

There is no evidence of caste as simply social division of labor. This thesis is inconsistent with differential ANI admixture (and distance from Western Eurasians) across the caste hierarchy.

There is no evidence that Indo-Aryan and Dravidian speakers differ only in language. It is now clear that they are different from each other genetically as well, and this difference is not an "internal affair" of India, but is related to populations outside it. Indo-Aryan speakers differ precisely in having a larger ANI component.

There is no evidence that Indo-European languages originated in India. Let us consider what this would entail:
  1. Suppose postulated ancient Indian PIE speakers had a similar genetic makeup as modern Indians (i.e., a mix of ANI and ASI). Then, the absence of the ASI component outside South Asia cannot be explained.
  2. If ancient Indian PIE speakers had a purely ANI makeup, then the absence of the ASI component outside South Asia -as in (1)- can be explained. However, this would entail that sharply differentiated populations (ANI and ASI) co-existed in India without mixing for thousands of years; ANI-like PIEs spread from India with their languages; ANI and ASI admixed afterwards. To say that this scenario is not parsimonious would be charitable.
  3. The only way in which PIE languages may have originated in India would be if they spread without the spread of people. However, before the advent of writing and modern means of transportation and communication, the only way to spread languages was by migration of people.
From a related Nature story:
The researchers also found that Indian populations were much more highly subdivided than European populations. But whereas European ancestry is mostly carved up by geography, Indian segregation was driven largely by caste. "There are populations that have lived in the same town and same village for thousands of years without exchanging genes," says Reich.
The paper has plentiful (and free) supplementary information.

Related posts by Gene Expression and John Hawks.

Nature 461, 489-494 doi:10.1038/nature08365

Reconstructing Indian population history

David Reich et al.

Abstract

India has been underrepresented in genome-wide surveys of human variation. We analyse 25 diverse groups in India to provide strong evidence for two ancient populations, genetically divergent, that are ancestral to most Indians today. One, the 'Ancestral North Indians' (ANI), is genetically close to Middle Easterners, Central Asians, and Europeans, whereas the other, the 'Ancestral South Indians' (ASI), is as distinct from ANI and East Asians as they are from each other. By introducing methods that can estimate ancestry without accurate ancestral populations, we show that ANI ancestry ranges from 39–71% in most Indian groups, and is higher in traditionally upper caste and Indo-European speakers. Groups with only ASI ancestry may no longer exist in mainland India. However, the indigenous Andaman Islanders are unique in being ASI-related groups without ANI ancestry. Allele frequency differences between groups in India are larger than in Europe, reflecting strong founder effects whose signatures have been maintained for thousands of years owing to endogamy. We therefore predict that there will be an excess of recessive diseases in India, which should be possible to screen and map genetically.

Link

May 25, 2009

MHC-dissimilar mating in Brazil

This seems to parallel previous findings on European Americans.

Opposites attract -- how genetics influences humans to choose their mates
Vienna, Austria: New light has been thrown on how humans choose their partners, a scientist will tell the annual conference of the European Society of Human Genetics today (Monday May 25). Professor Maria da Graça Bicalho, head of the Immunogenetics and Histocompatibility Laboratory at the University of Parana, Brazil, says that her research had shown that people with diverse major histocompatibility complexes (MHCs) were more likely to choose each other as mates than those whose MHCs were similar, and that this was likely to be an evolutionary strategy to ensure healthy reproduction.

Females' preference for MHC dissimilar mates has been shown in many vertebrate species, including humans, and it is also known that MHC influences mating selection by preferences for particular body odours. The Brazilian team has been working in this field since 1998, and decided to investigate mate selection in the Brazilian population, while trying to uncover the biological significance of MHC diversity.

The scientists studied MHC data from 90 married couples, and compared them with 152 randomly-generated control couples. They counted the number of MHC dissimilarities among those who were real couples, and compared them with those in the randomly-generated 'virtual couples'. "If MHC genes did not influence mate selection", says Professor Bicalho, "we would have expected to see similar results from both sets of couples. But we found that the real partners had significantly more MHC dissimilarities than we could have expected to find simply by chance."

Within MHC-dissimilar couples the partners will be genetically different, and such a pattern of mate choice decreases the danger of endogamy (mating among relatives) and increases the genetic variability of offspring. Genetic variability is known to be an advantage for offspring, and the MHC effect could be an evolutionary strategy underlying incest avoidance in humans and also improving the efficiency of the immune system, the scientists say.

The MHC is a large genetic region situated on chromosome 6, and found in most vertebrates. It plays an important role in the immune system and also in reproductive success. Apart from being a large region, it is also an extraordinarily diverse one.

"Although it may be tempting to think that humans choose their partners because of their similarities", says Professor Bicalho, "our research has shown clearly that it is differences that make for successful reproduction, and that the subconscious drive to have healthy children is important when choosing a mate."

The scientists believe that their findings will help understanding of conception, fertility, and gestational failures. Research has already shown that couples with similar MHC genes had longer intervals between births, which could imply early, unperceived miscarriages. "We intend to follow up this work by looking at social and cultural influences as well as biological ones in mate choice, and relating these to the genetic diversity of the extended MHC region", says Professor Bicalho.

"We expect to find that cultural aspects play an important role in mate choice, and certainly do not subscribe to the theory that if a person bears a particular genetic variant it will determine his or her behaviour. But we also think that the unconscious evolutionary aspect of partner choice should not be overlooked. We believe our research shows that this has an important role to play in ensuring healthy reproduction, by helping to ensure that children are born with a strong immune system better able to cope with infection."


I had previously posted some more abstracts from ESHG 2009. Here is the abstract from this study:

New evidences about MHC-based patterns of mate choice
M. Bicalho, J. da Silva, J. M. Magalhães, W. Silva;

Major Histocompatibility Complex (MHC) genes code for cell surface proteins, which plays an important role in immune recognition. In the late 1970s, Yamazaki observed that inbred mice were more likely to mate with partners having MHC dissimilar genes. Females’ preference for MHC dissimilar mates was also observed in other vertebrate species, including humans. It has been shown that MHC influences mating selection mediated by preferences based on body odor. What’s the functional significance of these findings, if some? It was assumed that through olfactory cues MHC-related evolved as a strategy to maximize the offspring MHC heterozygosity. Parents with dissimilar MHCs could provide their offspring with a better chance to ward infections off because their immune system genes are more diverse. MHC genotype might be used to signal relatedness and immune response genotypes through.

We investigated whether husband-wife couples (n=90) obtained from LIGH’s database were more MHC-similar/dissimilar in comparison to random couples generated from the same database (n=55 000) as to collect evidence of MHC influence in MHC-based patterns of mate choice.

The individuals HLA typing (Class I and Class II) was performed by PCR-SSP or PCR-rSSOP using a commercial kit ( One Lambda Inc., Canoga Park. CA, USA).

Our results and comparisons ( p= 0,014) suggest that couples seem to be formed by individuals with less HLA similarity, corroborating the hypothesis that HLA antigens, especially Class I, may influence mate selection and marriages in humans.

December 13, 2008

Y chromosomes. mtDNA, and autosomal DNA from Tamil Nadu and Andhra Pradesh

This paper is a winner in my book, if only for this statement:
In addition, the Y-chromosome and mtDNA may both have been affected by natural selection, [46, 47] which can further complicate the interpretation of population history. Coalescence dates based on these systems must also be viewed with appropriate caution, in part because of their large confidence intervals. More importantly, a coalescence date is not necessarily a reliable indicator of the founding date of a population [45] because these dates are affected by the size of the founder population and by subsequent gene flow patterns.
BMC Genetics doi:10.1186/1471-2156-9-86

Genetic variation in South Indian castes: evidence from Y-chromosome, mitochondrial, and autosomal polymorphisms

W. S. Watkins et al.

Abstract (provisional)

Background

Major population movements, social structure, and caste endogamy have influenced the genetic structure of Indian populations. An understanding of these influences is increasingly important as gene mapping and case-control studies are initiated in South Indian populations.

Results

We report new data on 155 individuals from four Tamil caste populations of South India and perform comparative analyses with caste populations from the neighboring state of Andhra Pradesh. Genetic differentiation among Tamil castes is low (RST = 0.96% for 45 autosomal short tandem repeat (STR) markers), reflecting a largely common origin. Nonetheless, caste- and continent-specific patterns are evident. For 32 lineage-defining Y-chromosome SNPs, Tamil castes show higher affinity to Europeans than to eastern Asians, and genetic distance estimates to the Europeans are ordered by caste rank. For 32 lineage-defining mitochondrial SNPs and hypervariable sequence (HVS) 1, Tamil castes have higher affinity to eastern Asians than to Europeans. For 45 autosomal STRs, upper and middle rank castes show higher affinity to Europeans than do lower rank castes from either Tamil Nadu or Andhra Pradesh. Local between-caste variation (Tamil Nadu RST = 0.96%, Andhra Pradesh RST = 0.77%) exceeds the estimate of variation between these geographically separated groups (RST = 0.12%). Low, but statistically significant, correlations between caste rank distance and genetic distance are demonstrated for Tamil castes using Y-chromosome, mtDNA, and autosomal data.

Conclusions

Genetic data from Y-chromosome, mtDNA, and autosomal STRs are in accord with historical accounts of northwest to southeast population movements in India. The influence of ancient and historical population movements and caste social structure can be detected and replicated in South Indian caste populations from two different geographic regions.

Link

September 14, 2008

Y chromosomes of Bayash Romani

Once again, the 0.00069/locus/generation rate is used in this paper, and hence its estimated ages are wrong. The given Y-STR variance for haplogroup H1a in Table 2 is 0.06, which corresponds to an age of ~800 years.

It's interesting though, that Zhivotovsky is a co-author of this paper which states that:
A recent refinement of E1b1b1a-M78 by novel biallelic markers indicates that its subhaplogroup E1b1b1a2-V13 is the most common in Europe (Cruciani et al., 2007). In fact, E1b1b1a2-V13 originated in Western Asia about 11 KYA and expanded in Southeastern Europe about 4.5 KYA, not in connection with the spread of agriculture as traditionally assumed, but rather at the beginning of the Balkan Bronze age, as a consequence of the in situ population increase in the already populated territory (Cruciani et al., 2007).
and he was a co-author of King et al. (2008) which stated that:
The calculated expansion time of haplogroup E3b1a2-V13 in mainland Greece is 8,600 y BP at Nea Nikomedeia and 9,200 y BP at Lerna/Franchthi Cave and is consistent with the late Mesolithic/initial Neolithic horizon. These dates exceed those reported previously for Europe (Cruciani et al., 2007) that date to the Bronze Age. This discrepancy arises mainly because of differences in the choice of mutation rate used.
Peter Underhill was also a co-author of the latter study, and also of the recent paper on Sicily which used germline mutation rates and:
The estimate of Time to Most Recent Common Ancestor is about 2380 years before present, which broadly agrees with the archaeological traces of the Greek classic era.
Mesolithic - Early Bronze Age - classical Greek. Three completely different ages using three different mutation rates: a mutation rate 3.6x slower than the germline rate => Mesolithic. A mutation rate 2.4 to 2.8x slower => Early Bronze Age. A germline mutation rate => classical Greek.

My most recent take. I'll be much surprised if E-V13 turns out to be anything other than 2nd millennium BC in the Balkans.

American Journal of Physical Anthropology doi: 10.1002/ajpa.20933

Dissecting the molecular architecture and origin of Bayash Romani patrilineages: Genetic influences from South-Asia and the Balkans

Irena Martinovi Klari et al.

Abstract

The Bayash are a branch of Romanian speaking Roma living dispersedly in Central, Eastern, and Southeastern Europe. To better understand the molecular architecture and origin of the Croatian Bayash paternal gene pool, 151 Bayash Y chromosomes were analyzed for 16 SNPs and 17 STRs and compared with European Romani and non-Romani majority populations from Europe, Turkey, and South Asia. Two main layers of Bayash paternal gene pool were identified: ancestral (Indian) and recent (European). The reduced diversity and expansion signals of H1a patrilineages imply descent from closely related paternal ancestors who could have settled in the Indian subcontinent, possibly as early as between the eighth and tenth centuries AD. The recent layer of the Bayash paternal pool is dominated by a specific subset of E1b1b1a lineages that are not found in the Balkan majority populations. At least two private mutational events occurred in the Bayash during their migrations from the southern Balkans toward Romania. Additional admixture, evident in the low frequencies of typical European haplogroups, J2, R1a, I1, R1b1b2, G, and I2a, took place primarily during the early Bayash settlement in the Balkans and the Romani bondage in Romania. Our results indicate two phenomena in the Bayash and analyzed Roma: a significant preservation of ancestral H1a haplotypes as a result of considerable, but variable level of endogamy and isolation and differential distribution of less frequent, but typical European lineages due to different patterns of the early demographic history in Europe marked by differential admixture and genetic drift.

Link

July 21, 2008

Y chromosomes and mtDNA of Daghestan groups

This is a free paper which establishes the difference between highland Northeast Caucasian speakers and lowland Altaic speakers in Daghestan. The lowland groups show evidence of Mongoloid haplogroups in both Y chromosomes and mtDNA, while the highland groups are dominated by haplogroup J:
The highland Avar, Dargin, and Kubachi exhibit high frequencies of haplogroup J (0.56, 1.00, and 0.67, respectively)
According to Table 2, the Avars possess 0.33 of J2, so, consistent with previous observations, the Northeast Caucasian groups are J1 (or at least J*(xJ2)) exclusive.

Interestingly, haplogroup G occurs in the Avars (0.06) but not in the other highland groups. Haplogroup G is common in the Southern Caucasus. The mountain groups also have little R1*(xR1a1) (0.06 in Avars, 0.08 in Kubachi) and no I, R1a1 or E.

It certainly seems to be the case that the highland Northeast Caucasian speakers are descended from a J1-dominated ancient Near Eastern population which was preserved due to patrilocal endogamy. The relationship -that I wrote about earlier- of these Caucasian J1's to the Arabian J1's, the second major region of J1 dominance remains to be seen.

BMC Genetics 2008, 9:47 doi:10.1186/1471-2156-9-47

Culture creates genetic structure in the Caucasus: Autosomal, mitochondrial, and Y-chromosomal variation in Daghestan

Elizabeth E Marchani 1, W Scott Watkins 2, Kazima Bulayeva 3, Henry C
Harpending 1, Lynn B Jorde 2§

Abstract

Background

Near the junction of three major continents, the Caucasus region has been an important thoroughfare for human migration. While the Caucasus Mountains have diverted human traffic to the few lowland regions that provide a gateway from north to south between the Caspian and Black Seas, highland populations have been isolated by their remote geographic location and their practice of patrilocal endogamy. We investigate how these cultural and historical differences between highland and lowland populations have affected patterns of genetic diversity. We test 1) whether the highland practice of patrilocal endogamy has generated sex-specific population relationships, and 2) whether the history of migration and military conquest associated with the lowland populations has left Central Asian genes in the Caucasus, by comparing genetic diversity and pairwise population relationships between Daghestani populations and reference populations throughout Europe and Asia for autosomal, mitochondrial, and Y-chromosomal markers.

Results

We found that the highland Daghestani populations had contrasting histories for the mitochondrial DNA and Y-chromosome data sets. Y-chromosomal haplogroup diversity was reduced among highland Daghestani populations when compared to other populations and to highland Daghestani mitochondrial DNA haplogroup diversity. Lowland Daghestani populations showed Turkish and Central Asian affinities for both mitochondrial and Y-chromosomal data sets. Autosomal population histories are strongly correlated to the pattern observed for the mitochondrial DNA data set, while the correlation between the mitochondrial DNA and Y-chromosome distance matrices was weak and not significant.

Conclusions

The reduced Y-chromosomal diversity exhibited by highland Daghestani populations is consistent with genetic drift caused by patrilocal endogamy. Mitochondrial and Ychromosomal phylogeographic comparisons indicate a common Near Eastern origin of highland populations. Lowland Daghestani populations show varying influence from Near Eastern and Central Asian populations.

Link (pdf)

April 10, 2007

Genetic affinities of Uttar Pradesh populations

BMC Genet. 2007 Apr 7;8(1):12 [Epub ahead of print]

Genetic affinities between endogamous and inbreeding populations of Uttar Pradesh.


Khan F, Pandey AK, Tripathi M, Talwar S, Bisen PS, Borkar M, Agrawal S.

ABSTRACT: BACKGROUND: India has experienced several waves of migration since the Middle Paleolithic. It is believed that the initial demic movement into India was from Africa along the southern coastal route, approximately 60,000-85,000 years before present (ybp). It has also been reported that there were two other major colonizations which included eastward diffusion of Neolithic farmers (Elamo Dravidians) from Middle East sometime between 10,000 and 7,000 ybp and a southern dispersal of Indo Europeans from Central Asia 3,000 ybp. Mongol entry during the thirteenth century A.D. as well as some possible minor incursions from South China 50,000 to 60,000 ybp may have also contributed to cultural, linguistic and genetic diversity in India. Therefore, the genetic affinity and relationship of Indians with other world populations and also within India are often contested. In the present study, we have attempted to offer a fresh and immaculate interpretation on the genetic relationships of different North Indian populations with other Indian and other world populations. RESULTS: We have first genotyped 20 tetra-nucleotide STR markers among 1800 north Indian samples of nine endogamous populations belonging to three different socio-cultural strata. Genetic distances (Neis DA and Reynolds Fst) were calculated among the nine studied populations, Caucasians and East Asians. This analysis was based upon the allelic profile of 20 STR markers to assess the genetic similarity and differences of the north Indian populations. North Indians showed a stronger genetic relationship with the Europeans (DA 0.0341 and Fst 0.0119) as compared to the Asians (DA 0.1694 and Fst - 0.0718). The upper caste Brahmins and Muslims were closest to Caucasians while middle caste populations were closer to Asians. Finally, three phylogenetic assessments based on two different NJ and ML phylogenetic methods and PC plot analysis were carried out using the same panel of 20 STR markers and 20 geo-ethnic populations. The three phylogenetic assessments revealed that north Indians are clustering with Caucasians. CONCLUSIONS: The genetic affinities of Indians and that of different caste groups towards Caucasians or East Asians is distributed in a cline where geographically north Indians and socially both upper caste and Muslim populations are genetically closer to the Caucasians.

Link

January 10, 2007

Reduced Y chromosome diversity of Central Asian pastoral populations

Curr Biol. 2007 Jan 9;17(1):43-8.

From social to genetic structures in central Asia.

Chaix R. et al.

Pastoral and farmer populations, who have coexisted in Central Asia since the fourth millennium B.C. , present not only different lifestyles and means of subsistence but also various types of social organization. Pastoral populations are organized into so-called descent groups (tribes, clans, and lineages) and practice exogamous marriages (a man chooses a bride in a different lineage or clan). In Central Asia, these descent groups are patrilineal: The children are systematically affiliated with the descent groups of the father. By contrast, farmer populations are organized into families (extended or nuclear) and often establish endogamous marriages with cousins . This study aims at better understanding the impact of these differences in lifestyle and social organization on the shaping of genetic diversity. We show that pastoral populations exhibit a substantial loss of Y chromosome diversity in comparison to farmers but that no such a difference is observed at the mitochondrial-DNA level. Our analyses indicate that the dynamics of patrilineal descent groups, which implies different male and female sociodemographic histories, is responsible for these sexually-asymmetric genetic patterns. This molecular signature of the pastoral social organization disappears over a few centuries only after conversion to an agricultural way of life.

Link

September 17, 2006

Gypsy Y chromosomes

Forensic Science International (Article in Press)

Searching for the origin of Romanies: Slovakian Romani, Jats of Haryana and Jat Sikhs Y-STR data in comparison with different Romani populations

Melinda Nagy et al.

Abstract

Haplotype frequencies for 11 Y-STR markers (DYS19, DYS389I, DYS389II, DYS390, DYS391, DYS392, DYS393, DYS385, DYS437, DYS438 and DYS439) in a Romani population (n = 63) from Slovakia, Jats of Haryana (n = 84) and Jat Sikhs (n = 80) from India were determined. The Slovakian Romani, the Haryana and Sikh populations were endogamous based on their unique haplotype ratio and haplotype diversity values, although the Sikh population appeared to be more diverse. AMOVA revealed non-significant differences between the Romanies and significant differences with non-Romani populations. The Macedonian Romani population differed from all Romani populations examined. Frequent haplotypes observed in Romani populations were sporadic in northwest Indian populations. Thirteen out of 316 populations worldwide were found to share the six most frequent haplotypes of the Slovakian Romanies when the screening conditions were narrowed based on the population size to be over 40, the occurrence of the haplotypes was more than one and the sum frequencies of the most frequent haplotypes was at least 0.02. The most common haplotypes were also observed in other Romani groups. When searching with two Indian (Malbar and Malaysian Indian) most frequent haplotypes under the same conditions matches could be detected in all Romani populations except for the Macedonian Romanies. The search with the Jat Sikhs and Jats of Haryana most frequent haplotypes resulted no matches in Romani populations.

Link

January 06, 2006

Y chromosomes of Golla subcastes


Image hosted by TinyPic.com
American Journal of Physical Anthropology (Early view)

Genetic diversity within a caste population of India as measured by Y-chromosome haplogroups and haplotypes: Subcastes of the Golla of Andhra Pradesh

R. John Mitchell et al.

Abstract

The extent of population subdivision based on 15 Y-chromosome polymorphisms was studied in seven subcastes of the Golla (Karnam, Pokanati, Erra, Doddi, Punugu, Puja, and Kurava), who inhabit the Chittoor district of southern Andhra Pradesh, India. These Golla subcastes are traditionally pastoralists, culturally homogeneous and endogamous. DNA samples from 146 Golla males were scored for seven unique event polymorphisms (UEPs) and eight microsatellites, permitting allocation of each into haplogroups and haplotypes, respectively. Genetic diversity (D) was high (range, 0.9048-0.9921), and most of the genetic variance (>91%) was explained by intrapopulation differences. Median-joining network analysis of microsatellite haplotypes demonstrated an absence of any structure according to subcaste affiliation. Superimposition of UEPs on this phylogeny, however, did create some distinct clusters, indicating congruence between haplotype and haplogroup phylogenies. Our results suggest many male ancestors for the Golla as well as for each of the subcastes. Genetic distances among the seven subcastes, based on autosomal markers (short tandem repeats and human leukocyte antigens) as well as those on the chromosome Y, indicate that the Kurava may not be a true subcaste of the Golla. Although this finding is based on a very small Kurava sample, it is in accordance with ethnohistorical accounts related by community elders. The Punugu was the first to hive off the main Golla group, and the most recently separated subcastes (Karnam, Erra, Doddi, and Pokanati) fissioned from the Puja. This phylogeny receives support from the analysis of autosomal microsatellites as well as HLA loci in the same samples. In particular, there is a significant correlation (r = 0.8569; P = 0.0097) between Y-chromosome- and autosomal STR-based distances.

Link

December 03, 2005

Differentiation of Indian Proto-Australoids

Am J Phys Anthropol. 2005 Dec 1; [Epub ahead of print]

Microsatellite diversity reveals the interplay of language and geography in shaping genetic differentiation of diverse Proto-Australoid populations of west-central India.

Gaikwad S, Vasulu TS, Kashyap VK.

Microsatellite diversity was analyzed in four Proto-Australoid tribes, including Indo-European (Marathi)-speaking Katkari, Pawara, Mahadeo-Koli, and Dravidian (Gondi)-speaking groups of Maharashtra, west-central India, to understand their genetic structure and to identify the congruence between language and gene pool. Allele frequency data at 15 short tandem repeat (STR) loci in studied tribes was compared with data of 22 Indo-European- and Dravidian-speaking caste and tribal populations using heterozygosity, allele size variance, analysis of molecular variance (AMOVA), G(ST) estimate, PC plot, and Mantel correlation test. Our results demonstrate that "Gondi" tribes comprising the Madia-Gond, a hunter-gatherer population, and the agriculturist Dheria-Gond harbor lower diversity than "Marathi" tribal groups, which are culturally and genetically distinct. Katkari, a hunter-gatherer tribe, showed greater diversity and the presence of a large number of unique alleles, genetically distinct from all others except the Pawara, supporting their old cultural links. The agriculturist Pawara tribe represents a splinter subgroup of the Bhil tribe and has experienced gene flow. The Mahadeo-Koli, an agriculturally oriented tribe, displayed significant heterozygote deficiency, attributable to the practice of high endogamy. The Proto-Australoid tribal populations were genetically differentiated from castes of similar morphology, suggesting different evolutionary mechanisms operating upon the populations. The populations showed genetic and linguistic similarity, barring a few groups with varied migratory histories. The microsatellite variation clearly demonstrates the interplay of sociocultural factors including linguistic, geographical contiguity, and microevolutionary processes in shaping the genetic diversity of populations in contemporary India. This study supports the ethno-historical relationships of Indian populations.

Link

August 26, 2005

The Indian Genome Variation database

Indian scientists have announced in Human Genetics the launch of a new program to understand genetic variation within the diverse and fragmented Indian population. This exciting new project should help us understand the origin of about 1/6 of modern humanity, in addition to important medical applications.

The following two maps of the distribution of morphological types and linguistic groups in India are a broad reflection of the cultural and biological diversity of the country.

Free Image Hosting at www.ImageShack.us Free Image Hosting at www.ImageShack.us


The Indian Genome Variation database (IGVdb): a project overview

The Indian Genome Variation Consortium

Abstract

Indian population, comprising of more than a billion people, consists of 4693 communities with several thousands of endogamous groups, 325 functioning languages and 25 scripts. To address the questions related to ethnic diversity, migrations, founder populations, predisposition to complex disorders or pharmacogenomics, one needs to understand the diversity and relatedness at the genetic level in such a diverse population. In this backdrop, six constituent laboratories of the Council of Scientific and Industrial Research (CSIR), with funding from the Government of India, initiated a network program on predictive medicine using repeats and single nucleotide polymorphisms. The Indian Genome Variation (IGV) consortium aims to provide data on validated SNPs and repeats, both novel and reported, along with gene duplications, in over a thousand genes, in 15,000 individuals drawn from Indian subpopulations. These genes have been selected on the basis of their relevance as functional and positional candidates in many common diseases including genes relevant to pharmacogenomics. This is the first large-scale comprehensive study of the structure of the Indian population with wide-reaching implications. A comprehensive platform for Indian Genome Variation (IGV) data management, analysis and creation of IGVdb portal has also been developed. The samples are being collected following ethical guidelines of Indian Council of Medical Research (ICMR) and Department of Biotechnology (DBT), India. This paper reveals the structure of the IGV project highlighting its various aspects like genesis, objectives, strategies for selection of genes, identification of the Indian subpopulations, collection of samples and discovery and validation of genetic markers, data analysis and monitoring as well as the project’s data release policy.

Link

March 21, 2005

Endogamy and consagunity in Northern Sweden

Annals of Human Genetics (OnlineEarly)

The Influence of Past Endogamy and Consanguinity on Genetic Disorders in Northern Sweden


A. H. Bittles 1 et al.

Summary

It has been widely believed that consanguineous marriage was infrequent in northern Europe. As part of ongoing studies into the population structure of northern Sweden, the Demographic DataBase of Umeå University has undertaken digitization of the parish record books of the Swedish Lutheran Church, which date back to the late 17th century. To examine the prevalence and patterns of consanguineous marriage, information from the DataBase was abstracted for the Skellefteå region during the period 1720-1899 and extended family pedigrees constructed. Of the 14,639 marriages recorded, 3,043 (20.8%) were between couples related as sixth cousins or closer. Following changes in the Swedish civil law in 1844 that removed the requirement of royal dispensation for first cousin unions, a significant increase in first cousin marriages occurred during the next two generations, even though the total population of the region grew significantly. There was also strong evidence that consanguineous marriages were favoured within particular families. The findings of the study are consistent with the patterns of single gene disorders reported in specific communities in the region, and they suggest that founder effect, drift and consanguinity all were important influences on population genetic structure in previous generations.

Link