Two new papers in Nature and Science add to the debate on Native American origins. The first study (in Nature) detects that some Amazonians have a few percent ancestry from a group related to Australasians, which suggests that early native Americans were not homogeneous but came in two flavors: the main one found all over the Americans and the Australasian-related one. The second study (in Science) looks at ancient "Paleoamerican"-postulated populations and finds that they don't have any particular relationship to Australasians. Thus, whatever population brought the "Paleoamerican" admixture into the Amazon, it remains to be found.
Nature (2015) doi:10.1038/nature14895
Genetic evidence for two founding populations of the Americas
Pontus Skoglund et al.
Genetic studies have consistently indicated a single common origin of Native American groups from Central and South America1, 2, 3, 4. However, some morphological studies have suggested a more complex picture, whereby the northeast Asian affinities of present-day Native Americans contrast with a distinctive morphology seen in some of the earliest American skeletons, which share traits with present-day Australasians (indigenous groups in Australia, Melanesia, and island Southeast Asia)5, 6, 7, 8. Here we analyse genome-wide data to show that some Amazonian Native Americans descend partly from a Native American founding population that carried ancestry more closely related to indigenous Australians, New Guineans and Andaman Islanders than to any present-day Eurasians or Native Americans. This signature is not present to the same extent, or at all, in present-day Northern and Central Americans or in a ~12,600-year-old Clovis-associated genome, suggesting a more diverse set of founding populations of the Americas than previously accepted.
Link
Science DOI: 10.1126/science.aab3884
Genomic evidence for the Pleistocene and recent population history of Native Americans
Maanasa Raghavan1,*, Matthias Steinrücken2,3,4,*, Kelley Harris5,*, Stephan Schiffels6,*, Simon Rasmussen7,*, Michael DeGiorgio8,*, Anders Albrechtsen9,*, Cristina Valdiosera1,10,*, María C. Ávila-Arcos1,11,*, Anna-Sapfo Malaspinas1* et al.
How and when the Americas were populated remains contentious. Using ancient and modern genome-wide data, we find that the ancestors of all present-day Native Americans, including Athabascans and Amerindians, entered the Americas as a single migration wave from Siberia no earlier than 23 thousand years ago (KYA), and after no more than 8,000-year isolation period in Beringia. Following their arrival to the Americas, ancestral Native Americans diversified into two basal genetic branches around 13 KYA, one that is now dispersed across North and South America and the other is restricted to North America. Subsequent gene flow resulted in some Native Americans sharing ancestry with present-day East Asians (including Siberians) and, more distantly, Australo-Melanesians. Putative ‘Paleoamerican’ relict populations, including the historical Mexican Pericúes and South American Fuego-Patagonians, are not directly related to modern Australo-Melanesians as suggested by the Paleoamerican Model.
Link

Showing posts with label Andaman. Show all posts
Showing posts with label Andaman. Show all posts
July 26, 2015
October 20, 2009
Stature evolution in Andaman Islanders
A good related Wired News story on Why Pygmies are Small
CURRENT ANTHROPOLOGY Volume 50, Number 5, October 2009
DOI: 10.1086/605429
CURRENT ANTHROPOLOGY Volume 50, Number 5, October 2009
DOI: 10.1086/605429
Stature, Mortality, and Life History among Indigenous Populations of the Andaman Islands, 1871–1986
J. T. Stock and A. B. Migliano
Despite considerable interest in the evolution of small body size, there is little evidence for changes in body size within small‐bodied human populations. This study combines anthropometric data from a number of studies of the body size of Andaman Islanders from 1871 to 1986. The colonial history of the Andaman Islands is characterized by high rates of mortality among the indigenous populations. However, long‐term conflicts between tribal groups of the Andaman Islands and British and Indian settlers led to some groups being relatively isolated and sheltered from infectious disease and the high rates of mortality that affected other groups. When temporal trends in stature are compared in this context, there is evidence for a reduction in stature among the Great Andamanese who had close contact with the British during the period of highest mortality. Adult stature among the Onge appears to have increased as government involvement diminished following Indian independence. The Jarawa, who had lower rates of mortality throughout the past century, have significantly higher stature than the other groups. These results are interpreted in the context of life‐history theory, adaptation, and plasticity. They provide the first long‐term diachronic evidence for a relationship between mortality and stature among small‐bodied humans.
Link
Link
September 24, 2009
560K SNP study reveals dual rigin of Indian populations (Reich et al. 2009)
In lieu of a prologue, Herodotus and Arrian on the two groups inhabiting ancient India:
The Indians wore cotton dresses, and carried bows of cane, and arrows also of cane with iron at the point. Such was the equipment of the Indians, and they marched under the command of Pharnazathres the son of Artabates. [...] The eastern Ethiopians- for two nations of this name served in the army- were marshalled with the Indians. They differed in nothing from the other Ethiopians, save in their language, and the character of their hair. For the eastern Ethiopians have straight hair, while they of Libya are more woolly-haired than any other people in the world.The appearance of the inhabitants, too, is not so far different in India and Ethiopia; the southern Indians resemble the Ethiopians a good deal, and, are black of countenance, and their hair black also, only they are not as snub-nosed or so woolly-haired as the Ethiopians; but the northern Indians are most like the Egyptians in appearance.
The paper establishes a number of different facts, that have been hinted at in previous autosomal studies, and studies based on Y chromosomes and mtDNA:
- Modern Indians are derived from two ancestral populations. The first one, termed Ancestral North Indians (ANI) were Caucasoids, the other, Ancestral South Indians (ASI) were distinct from both Caucasoids and Mongoloids in a Eurasian context.
- The ASI no longer exist in non-admixed form, but in various degrees of admixtures with ANI; the closest living population to the ASI are the Andaman Islanders.
- Upper castes are higher in ANI ancestry than middle and lower castes. ANI percentages of ancestry are correlated with Western Eurasian Y chromosomes (P=0.04) and mtDNA (P=0.08).
- Indo-European speakers are higher in ANI ancestry than Dravidian speakers.
However, the fact that ANI is correlated with caste status and language does suggest that the Indo-Aryan migration who brought Indo-European languages to India has not been totally wiped out genetically. Indo-European populations have maintained a higher degree of ancestry from the ANI component, and upper caste Indo-Europeans have maintained an even higher degree of such ancestry.
The beauty of this study is that it does not consider either a simple mixture model (like STRUCTURE does) in which populations are derived from 2 or more ancestral ones, or a simple branching model, in which populations are derived tree-like from a common root with no admixture between them. Rather, they consider both tree-like divergence of populations followed by admixture. The following figure from the paper illustrates this:
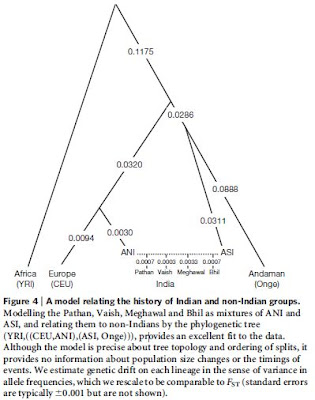 We can see that (i) the relationship between Andaman Islanders and ASI is not particularly close, although they do form a clade in relation to the other populations, (ii) the relationship between CEU and ANI is fairly close (in this context). The authors further determine (in the supplement) that CEU and ANI do form a clade separate from the non-IE speaking Adygei from the Caucasus.
 We can see that (i) the relationship between Andaman Islanders and ASI is not particularly close, although they do form a clade in relation to the other populations, (ii) the relationship between CEU and ANI is fairly close (in this context). The authors further determine (in the supplement) that CEU and ANI do form a clade separate from the non-IE speaking Adygei from the Caucasus.
What is now needed is to calculate the genetic distances between ANI and a wide assortment of Western Eurasian populations. Indeed, as these populations have undergone their own processes of admixture (e.g., Near Eastern populations with Arabs, Turks with Central Asians, Russians with Finns, Central Asian Iranians with Turks and Mongols, and so on), we cannot generally infer that the source population(s) of the ANI component are extant in non-admixed form. Nonetheless, the discovery of a strong relationship of ANI with a West Eurasian population may help us pinpoint the geographical origin of ANI outside India.
The paper does demolish some theories that have been popular in some circles:
There is no evidence of caste as simply social division of labor. This thesis is inconsistent with differential ANI admixture (and distance from Western Eurasians) across the caste hierarchy.
There is no evidence that Indo-Aryan and Dravidian speakers differ only in language. It is now clear that they are different from each other genetically as well, and this difference is not an "internal affair" of India, but is related to populations outside it. Indo-Aryan speakers differ precisely in having a larger ANI component.
There is no evidence that Indo-European languages originated in India. Let us consider what this would entail:
- Suppose postulated ancient Indian PIE speakers had a similar genetic makeup as modern Indians (i.e., a mix of ANI and ASI). Then, the absence of the ASI component outside South Asia cannot be explained.
- If ancient Indian PIE speakers had a purely ANI makeup, then the absence of the ASI component outside South Asia -as in (1)- can be explained. However, this would entail that sharply differentiated populations (ANI and ASI) co-existed in India without mixing for thousands of years; ANI-like PIEs spread from India with their languages; ANI and ASI admixed afterwards. To say that this scenario is not parsimonious would be charitable.
- The only way in which PIE languages may have originated in India would be if they spread without the spread of people. However, before the advent of writing and modern means of transportation and communication, the only way to spread languages was by migration of people.
From a related Nature story:
The researchers also found that Indian populations were much more highly subdivided than European populations. But whereas European ancestry is mostly carved up by geography, Indian segregation was driven largely by caste. "There are populations that have lived in the same town and same village for thousands of years without exchanging genes," says Reich.
The paper has plentiful (and free) supplementary information.
Related posts by Gene Expression and John Hawks.
Nature 461, 489-494 doi:10.1038/nature08365
Reconstructing Indian population history
David Reich et al.
Abstract
India has been underrepresented in genome-wide surveys of human variation. We analyse 25 diverse groups in India to provide strong evidence for two ancient populations, genetically divergent, that are ancestral to most Indians today. One, the 'Ancestral North Indians' (ANI), is genetically close to Middle Easterners, Central Asians, and Europeans, whereas the other, the 'Ancestral South Indians' (ASI), is as distinct from ANI and East Asians as they are from each other. By introducing methods that can estimate ancestry without accurate ancestral populations, we show that ANI ancestry ranges from 39–71% in most Indian groups, and is higher in traditionally upper caste and Indo-European speakers. Groups with only ASI ancestry may no longer exist in mainland India. However, the indigenous Andaman Islanders are unique in being ASI-related groups without ANI ancestry. Allele frequency differences between groups in India are larger than in Europe, reflecting strong founder effects whose signatures have been maintained for thousands of years owing to endogamy. We therefore predict that there will be an excess of recessive diseases in India, which should be possible to screen and map genetically.
Link
September 17, 2009
Balloux in Heredity on Mitochondrial Phylogeography
Francois Balloux has some scathing criticism on mitochondrial phylogeography as it is currently practiced (doi: 10.1038/hdy.2009.122). I recommend reading the whole thing. The beginning:
Let us assume I gave a seminar. I would tell the audience about my latest results on the population history of the pigmy shrew. My findings would be based on a stretch of DNA comprising several metabolic genes, showing no signs of genetic recombination. Armed with sequences from a large number of individuals sampled over a broad geographical area, I would make some inference on the colonization routes and times. To make life easier, I would restrict my analysis to the mutations I liked best, with nice names having been given to related sequences, rather than relying on dull mathematical quantities. As I reach one of the key conclusions of the lecture, which would go as follows: 'It is obvious from the distribution of haplotypes Amanda, Eugenie* and Hector_2that the Outer Hebrides were colonised about 50,000 years ago, this was followed by considerable population fluctuations, a bottleneck during the last Ice Age, a swift recovery and a dramatic recent expansion over the last 200 years and...'. Imagine that, at that climactic stage I was interrupted by someone in the audience. The impertinent would say, 'Sir, can I just ask you whether this confidence in your conclusions may not be misplaced; your analysis is based on a single genetic marker, which comprises genes with a central role in metabolism and is thus likely to have been affected by natural selection'. An awkward silence may ensue, as I would find it difficult to dismiss this criticism easily.
and the end:
Despite mitochondrial sequence variation covarying with climate in humans (Balloux et al., 2009), there are better ways to measure temperature. And, I would argue there are also better genetic markers than mtDNA to infer past population history. I fully appreciate that mtDNA has given us some of the most fundamental results on human evolution at a time when using mtDNA was the only realistic option at hand. I do not question the value of mtDNA in forensics and pedigree reconstruction. It is also likely to remain a valuable tool for inference at a localized geographical scale, particularly when testing specific hypotheses rather than making quantitative inferences on the age or size of the populations studied. It is convenient to type and analyse, and its use in humans raises no serious ethical or societal issue. But all these qualities do not counterbalance the fact that a single locus likely to be under selection is inappropriate for population inference at large geographical scales (or over long periods of time in the context of ancient DNA analysis). We have reached an era in which publicly available data sets of large numbers of complete human genomes are a tangible prospect, and I believe it is now time to move on from the excessive reliance on uniparental markers. Exploiting these new resources of autosomal variation will present significant challenges, but it will not help overcoming them if a large fraction of the community of human population biologists persists in sticking to mtDNA as the marker of choice.
The utility of mtDNA for studying modern populations is indeed limited now that we can study hundreds of thousands of markers per individual. However, it is still a very useful marker for ancient DNA, both because it is often the only game in town because of the relative ease with which it can be typed due to its large copy count, and also because it has proven itself to be capable of generating interesting results, as in the recently discovered discontinuity between Paleolithic and Neolithic Central Europeans, studying the mtDNA diversity of Neandertals compared to humans, or detecting sex-biased gene flow in relatively recently admixed populations.
See some of my previous criticisms on facile correlations between mtDNA time depth and archaeological-historical correlations:
UPDATE:
John Hawks also comments at length on the paper. An excerpt:
So what can we do? Fortunately we have lots of options. We can test the proposed demographic hypotheses against the historical record. When we make observations that show that people 1000 years ago had very different frequencies of common haplotypes, well, we know it was selection. There hasn't been any genetically significant bottleneck in the last 1000 years! When we see small Neolithic population samples dominated by haplotypes that are very rare today, again, no historically possible bottleneck could have caused that.I am fundamentally in agreement that bottlenecks, so often invoked in the mtDNA literature, are really a non-issue. Consider why this is the case: every mtDNA paper normally takes a random sample of a few tens or hundreds of people from a population that usually numbers in the thousands or millions. The assumption is that such a small random sample generally preserves -within confidence limits- the haplogroup frequencies in the population. But a bottleneck is exactly such a random sample. You can't, at the same time, use a sample of 100 people to infer haplogroup frequencies, and claim that a bottleneck that reduces the population to a 100 people will radically shift haplogroup frequencies. And, of course, there is absolutely no evidence that any major post-Neolithic human population, save for the Andaman Islanders, the Samaritans, or various such populations ever underwent a bottleneck anywhere near that severity.
However, I am in disagreement that a change of haplotype frequencies across 1,000 years is evidence of selection. A different explanation is that of migration, the introduction of a new population element.
Sometimes, migration is easy to infer. For example, we can be fairly certain that modern Europeans are different from Paleolithic Europeans because of Neolithic and post-Neolithic migration into Europe, because there is an introduction of new haplotypes that were absent in the Paleolithic population. One possible explanation is that instead of "absent" we should say "possibly present at very low frequencies". But, once we see that these haplotypes were present on the early Neolithic migrants, it doesn't take much to put 2+2 together and infer that migration is a likelier explanation.
The same process of migration could be inferred for the Neolithic populations of the Lake Baikal district, where a postulated hiatus in occupation, followed by recolonization by immigrants, proposed on archaeological grounds, coincides with the discovery of a sharp difference between pre- and post-hiatus populations in mtDNA haplotype frequencies. Similarly, the absence of Mongoloid mtDNA before the 7th c. BC in Central Asian samples, followed by its introduction after it, can be parsimoniously explained by admixture, since that admixture is evident also in anthropological and autosomal studies.
In other cases, selection may be a more plausible possibility. For example, the reduction in the frequency of haplogroup I in Denmark since the Viking and Iron Age, or changes of frequency in haplogroups in England since the 11th c. AD, such as the reduction of U5a1 and the increase in H may in fact be due to selection. H was present -although not very frequent- in Neolithic farmers from Central Europe, Corded Ware people from Eulau, and its very high present-day frequency in Europeans (roughly 50%) as there is no plausible source or mechanism that would have brought large numbers of it in Europe.
In conclusion, both migration and selection may help explain shifts in haplotype frequencies over time. As we plug in the holes in our knowledge of the mtDNA distribution across space and time, we will be able to decide between the two.
July 05, 2009
Y chromosomes and mtDNA of Tharus from Nepal
From the paper:

Estimates of Western Eurasian/East Asian/Indian area components is below. Note that some haplogroups such as R1a (considered here to be "Indian area") have contested origins, and were widely distributed in Western Eurasia even prehistorically. Thus, it is unclear what proportion of them represents a Western Eurasian vs. an Indian area origin.

The latest Y-STR diversity estimates (incl. this paper for Tharus from Eastern Terai and Indians) do suggest a substantially greater antiquity of R1a1 in the Indian subcontinent than in most of West Eurasia, but, as of yet, there is no sign that the R1a1 monolith will be broken by phylogeographically interesting downstream markers which would allow us to make a better sense of it.
UPDATE (July 6)
A reader points me to a fairly nuanced description of R1a1 in the paper.
The Tharus themselves are actually speakers of an Indo-Aryan language, and the presence in them of the J-M172/R-M17 combination as the major West Eurasian element in their gene pool is noteworthy. In my opinion it is precisely this combination that dominated early Indo-Aryans, although it may have met in India earlier J/R variants.
(Paper by Thanseem et al. referenced in the above quote; interestingly, according to that paper, J2 and R-related lineages occur at twice the frequency in upper than in lower castes, which seems consistent with my hypothesis, and other evidence.)
BMC Evolutionary Biology doi:10.1186/1471-2148-9-154
Mitochondrial and Y-chromosome diversity of the Tharus (Nepal): a reservoir of genetic variation
Simona Fornarino et al.
Abstract (provisional)
Background
Central Asia and the Indian subcontinent represent an area considered as a source and a reservoir for human genetic diversity, with many markers taking root here, most of which are the ancestral state of eastern and western haplogroups, while others are local. Between these two regions, Terai (Nepal) is a pivotal passageway allowing, in different times, multiple population interactions, although because of its highly malarial environment, it was scarcely inhabited until a few decades ago, when malaria was eradicated. One of the oldest and the largest indigenous people of Terai is represented by the malaria resistant Tharus, whose gene pool could still retain traces of ancient complex interactions. Until now, however, investigations on their genetic structure have been scarce mainly identifying East Asian signatures.
Results
High-resolution analyses of mitochondrial-DNA (including 34 complete sequences) and Y-chromosome (67 SNPs and 12 STRs) variations carried out in 173 Tharus (two groups from Central and one from Eastern Terai), and 104 Indians (Hindus from Terai and New Delhi and tribals from Andhra Pradesh) allowed the identification of three principal components: East Asian, West Eurasian and Indian, the last including both local and inter-regional sub-components, at least for the Y chromosome.
Conclusions
Although remarkable quantitative and qualitative differences appear among the various population groups and also between sexes within the same group, many mitochondrial-DNA and Y-chromosome lineages are shared or derived from ancient Indian haplogroups, thus revealing a deep shared ancestry between Tharus and Indians. Interestingly, the local Y-chromosome Indian component observed in the Andhra-Pradesh tribals is present in all Tharu groups, whereas the inter-regional component strongly prevails in the two Hindu samples and other Nepalese populations. The complete sequencing of mtDNAs from unresolved haplogroups also provided informative markers that greatly improved the mtDNA phylogeny and allowed the identification of ancient relationships between Tharus and Malaysia, the Andaman Islands and Japan as well as between India and North and East Africa. Overall, this study gives a paradigmatic example of the importance of genetic isolates in revealing variants not easily detectable in the general population.
Link
J-M410, which was associated with the first farmer dispersal in Europe [13, 82, 83, 84], shows variance values of 0.346 in the Tharus and 0.339 in Indian groups [15]. These values are lower than those (0.467 and 0.479) observed in Anatolia [13, 82] and (0.410) in Southeast Europe [83, 84] and therefore are compatible with a dispersal of this lineage from somewhere in the Middle East/Asia Minor.Y chromosome frequencies:

Estimates of Western Eurasian/East Asian/Indian area components is below. Note that some haplogroups such as R1a (considered here to be "Indian area") have contested origins, and were widely distributed in Western Eurasia even prehistorically. Thus, it is unclear what proportion of them represents a Western Eurasian vs. an Indian area origin.

The latest Y-STR diversity estimates (incl. this paper for Tharus from Eastern Terai and Indians) do suggest a substantially greater antiquity of R1a1 in the Indian subcontinent than in most of West Eurasia, but, as of yet, there is no sign that the R1a1 monolith will be broken by phylogeographically interesting downstream markers which would allow us to make a better sense of it.
UPDATE (July 6)
A reader points me to a fairly nuanced description of R1a1 in the paper.
Actually, the high frequency of the R1-M17 haplogroup found in the Central Eurasian territory, together with its gradient of diffusion that was associated with the Indo-European expansion [74, 75, 76], would leave some uncertainty about its geographic origin. However, the high microsatellite variation supports an ancient presence, dated in our samples over 14 ky [see Additional file 3] of the M17 marker in the Indian subcontinent, as suggested by Kivisild et al. [11], and sustained by Sengupta et al. [15] and Thanseem et al. [71], who consider the Indo-European M17 only a contribution to a local Early Holocene pre-existing Indian M17.This is also what I consider the most likely scenario (although I disagree on the date of 14ky, which was calculated with the "evolutionary mutation rate"): that the exogenous Indo-Aryans included R-M17 Y-chromosomes, but the totality of South Asian R-M17 Y-chromosomes cannot be ascribed to them.
The Tharus themselves are actually speakers of an Indo-Aryan language, and the presence in them of the J-M172/R-M17 combination as the major West Eurasian element in their gene pool is noteworthy. In my opinion it is precisely this combination that dominated early Indo-Aryans, although it may have met in India earlier J/R variants.
(Paper by Thanseem et al. referenced in the above quote; interestingly, according to that paper, J2 and R-related lineages occur at twice the frequency in upper than in lower castes, which seems consistent with my hypothesis, and other evidence.)
BMC Evolutionary Biology doi:10.1186/1471-2148-9-154
Mitochondrial and Y-chromosome diversity of the Tharus (Nepal): a reservoir of genetic variation
Simona Fornarino et al.
Abstract (provisional)
Background
Central Asia and the Indian subcontinent represent an area considered as a source and a reservoir for human genetic diversity, with many markers taking root here, most of which are the ancestral state of eastern and western haplogroups, while others are local. Between these two regions, Terai (Nepal) is a pivotal passageway allowing, in different times, multiple population interactions, although because of its highly malarial environment, it was scarcely inhabited until a few decades ago, when malaria was eradicated. One of the oldest and the largest indigenous people of Terai is represented by the malaria resistant Tharus, whose gene pool could still retain traces of ancient complex interactions. Until now, however, investigations on their genetic structure have been scarce mainly identifying East Asian signatures.
Results
High-resolution analyses of mitochondrial-DNA (including 34 complete sequences) and Y-chromosome (67 SNPs and 12 STRs) variations carried out in 173 Tharus (two groups from Central and one from Eastern Terai), and 104 Indians (Hindus from Terai and New Delhi and tribals from Andhra Pradesh) allowed the identification of three principal components: East Asian, West Eurasian and Indian, the last including both local and inter-regional sub-components, at least for the Y chromosome.
Conclusions
Although remarkable quantitative and qualitative differences appear among the various population groups and also between sexes within the same group, many mitochondrial-DNA and Y-chromosome lineages are shared or derived from ancient Indian haplogroups, thus revealing a deep shared ancestry between Tharus and Indians. Interestingly, the local Y-chromosome Indian component observed in the Andhra-Pradesh tribals is present in all Tharu groups, whereas the inter-regional component strongly prevails in the two Hindu samples and other Nepalese populations. The complete sequencing of mtDNAs from unresolved haplogroups also provided informative markers that greatly improved the mtDNA phylogeny and allowed the identification of ancient relationships between Tharus and Malaysia, the Andaman Islands and Japan as well as between India and North and East Africa. Overall, this study gives a paradigmatic example of the importance of genetic isolates in revealing variants not easily detectable in the general population.
Link
October 31, 2008
60,000-year-old Y-chromosome haplogroup D? Not really
I am probably sounding like a broken record, but here comes another study which uses the wholly inappropriate "evolutionary" mutation rate of 0.00069/locus/generation. This rate is suitable for a haplogroup that grows due to drift alone and which is expected in 60,000 years (or 2,400 generations) to have grown to the grand number of ~1,200 men.
Not only is this the case, but the authors give "confidence intervals" on their age estimates of 61-71kya which is almost certainly an underestimate of the truth based on an incomplete assessment of the factors affecting uncertainty about the haplogroup's age. This nice and tight estimate is accomplished using the grand total of eight STRs!
Based on using the wrong mutation rate, and artificially narrow confidence intervals, the authors joyously proclaim:
This paper and its supplementary data is a wonderful resource for Y-chromosome haplogroup D, but if you want to know more about the origins of this haplogroup, the sister clade of the common haplogroup E, you'll have to look elsewhere.
BMC Biology doi: 10.1186/1741-7007-6-45
Y chromosome evidence of earliest modern human settlement in East Asia and multiple origins of Tibetan and Japanese populations
Hong Shi et al.
Abstract
Background
Not only is this the case, but the authors give "confidence intervals" on their age estimates of 61-71kya which is almost certainly an underestimate of the truth based on an incomplete assessment of the factors affecting uncertainty about the haplogroup's age. This nice and tight estimate is accomplished using the grand total of eight STRs!
Based on using the wrong mutation rate, and artificially narrow confidence intervals, the authors joyously proclaim:
The estimated ages of the D-M174 lineages are older than those previously reportedStudy [5] by Underhill et al., which supposedly supports the origin of haplogroup D 50,000 years ago, actually doesn't derive this estimate on the basis of any genetic data, but rather from theory about the "Southern Coastal Route":
based on both Y chromosome and mtDNA variations in East Asia [8, 9, 21]. To see
whether it is over-estimated, using the same method, we calculated the divergence
time between DE* and E-M40. The estimated age is 27,176 years, which is much younger than the D-M174 lineage, but consistent with the previous estimation (27,800-37,000 years ago) [3]. Hence, the antiquity of D-M174 likely reflects the true prehistory of human populations in East Asia. The age estimation model developed by Zhivotovsky (2001) is not sensitive to effective population size and recent population expansion though the effect of population substructure cannot be totally ruled out. The antiquity of D-M174 was also supported by a previous study in which the origin of D-M174 was estimated more than 50,000 years ago [5].
The early human groups that used this route around 50000 years ago (taking the earliest occupation of Australia as the endpoint of this dispersal) were not restricted to coastal areas, and must have successfully colonized the Asian mainland, as shown by the distribution of surviving Group IV and V lineages.I am constantly amazed by how the tremendous amount of effort required to identify, sample, catalogue, process, and genotype great numbers of people from around the world is accompanied by an apparently complete lack of interest in checking the basic premises on which interpretation of this data is based.
This paper and its supplementary data is a wonderful resource for Y-chromosome haplogroup D, but if you want to know more about the origins of this haplogroup, the sister clade of the common haplogroup E, you'll have to look elsewhere.
BMC Biology doi: 10.1186/1741-7007-6-45
Y chromosome evidence of earliest modern human settlement in East Asia and multiple origins of Tibetan and Japanese populations
Hong Shi et al.
Abstract
Background
The phylogeography of the Y chromosome in Asia previously suggested that modern humans of African origin initially settled in mainland southern East Asia, and about 25,000-30,000 years ago, migrated northward, spreading throughout East Asia. However, the fragmented distribution of one East Asian specific Y chromosome lineage (D-M174), which is found at high frequencies only in Tibet, Japan and the Andaman Islands, is inconsistent with this scenario.
Results
In this study, we collected more than 5,000 male samples from 73 East Asian populations and reconstructed the phylogeography of the D-M174 lineage. Our results suggest that D-M174 represents an extremely ancient lineage of modern humans in East Asia, and a deep divergence was observed between northern and southern populations.
Conclusions
We proposed that D-M174 has a southern origin and its northward expansion occurred about 60,000 years ago, predating the northward migration of other major East Asian lineages. The Neolithic expansion of Han culture and the last glacial maximum are likely the key factors leading to the current relic distribution of D-M174 in East Asia. The Tibetan and Japanese populations are the admixture of two ancient populations represented by two major East Asian specific Y chromosome lineages, the O and D haplogroups.
September 02, 2008
YAP in 25 ethnic groups from Yunnan China
YAP defines haplogroup DE of the human Y-chromosome phylogeny, which joins together the haplogroup E, found in Negroids and Caucasoids, with haplogroup D, found mainly among Mongoloids, including the archaic Ainu, but also non-Mongoloid populations such as the Andaman Islanders.
The YAP frequencies listed here are, in all probability mostly of haplogroup D.
Sci China C Life Sci. 2003 Apr;46(2):135-140.
The geographic polymorphisms of Y chromosome at YAP locus among 25 ethnic groups in Yunnan, China.
Shi H, Dong Y, Li W, Yang J, Li K, Zan R, Xiao C.
The genetic polymorphisms of Y chromosome at YAP locus in 25 ethnic groups (33 populations) of China were analyzed in a total of 1294 samples. The average YAP+ frequency of the 33 populations was 9.2%, coinciding with published data of Chinese populations. Primi has the highest YAP+ frequency (72.3%), which is also the highest YAP+ among all the eastern Asian populations studied. The YAP+ occurred in 17 populations studied including Tibetan (36.0%), Naxi (37.5% and 25.5%), Zhuang (21.3%), Jingpo (12.5%), Miao (11.8%), Dai (11.4%, 10.0%, 3.3% and 2.0%), Yi (8.0%), Bai of Yunnan (6.7% and 6.0%), Mongol of Inner Mongolia (4.3%), Tujia of Hunan (2.6%), Yao (2.2%) and Nu (1.8%). The other 15 populations are YAP-including Lahu (2 populations), Hani, Achang, Drung, Lisu, Sui, Bouyei, Va, Bulang, Deang, Man and Hui and Mongol of Yunnan and Bai of Hunan. The YAP+ frequencies varied among the different ethnic groups studied, and even different among the same ethnic group living in different geographic locations. Using the genetic information, combined with the knowledge of ethnology, history and archaeology, the origin and prehistoric migrations of the ethnic groups in China, especially in Yunnan Province were discussed.
Link
The YAP frequencies listed here are, in all probability mostly of haplogroup D.
Sci China C Life Sci. 2003 Apr;46(2):135-140.
The geographic polymorphisms of Y chromosome at YAP locus among 25 ethnic groups in Yunnan, China.
Shi H, Dong Y, Li W, Yang J, Li K, Zan R, Xiao C.
The genetic polymorphisms of Y chromosome at YAP locus in 25 ethnic groups (33 populations) of China were analyzed in a total of 1294 samples. The average YAP+ frequency of the 33 populations was 9.2%, coinciding with published data of Chinese populations. Primi has the highest YAP+ frequency (72.3%), which is also the highest YAP+ among all the eastern Asian populations studied. The YAP+ occurred in 17 populations studied including Tibetan (36.0%), Naxi (37.5% and 25.5%), Zhuang (21.3%), Jingpo (12.5%), Miao (11.8%), Dai (11.4%, 10.0%, 3.3% and 2.0%), Yi (8.0%), Bai of Yunnan (6.7% and 6.0%), Mongol of Inner Mongolia (4.3%), Tujia of Hunan (2.6%), Yao (2.2%) and Nu (1.8%). The other 15 populations are YAP-including Lahu (2 populations), Hani, Achang, Drung, Lisu, Sui, Bouyei, Va, Bulang, Deang, Man and Hui and Mongol of Yunnan and Bai of Hunan. The YAP+ frequencies varied among the different ethnic groups studied, and even different among the same ethnic group living in different geographic locations. Using the genetic information, combined with the knowledge of ethnology, history and archaeology, the origin and prehistoric migrations of the ethnic groups in China, especially in Yunnan Province were discussed.
Link
January 13, 2008
Andaman islanders: relic of early Asians or more recent migrants?
Am J Phys Anthropol. 2008 Jan 10 [Epub ahead of print]
Detailed mtDNA genotypes permit a reassessment of the settlement and population structure of the Andaman Islands.
Barik SS, Sahani R, Prasad BV, Endicott P, Metspalu M, Sarkar BN, Bhattacharya S, Annapoorna PC, Sreenath J, Sun D, Sanchez JJ, Ho SY, Chandrasekar A, Rao VR.
Anthropological Survey of India, 27 Jawaharlal Nehru Road, Kolkata 700 016, India.
The population genetics of the Indian subcontinent is central to understanding early human prehistory due to its strategic location on the proposed corridor of human movement from Africa to Australia during the late Pleistocene. Previous genetic research using mtDNA has emphasized the relative isolation of the late Pleistocene colonizers, and the physically isolated Andaman Island populations of Island South-East Asia remain the source of claims supporting an early split between the populations that formed the patchy settlement pattern along the coast of the Indian Ocean. Using whole-genome sequencing, combined with multiplexed SNP typing, this study investigates the deep structure of mtDNA haplogroups M31 and M32 in India and the Andaman Islands. The identification of a so far unnoticed rare polymorphism shared between these two lineages suggests that they are actually sister groups within a single haplogroup, M31'32. The enhanced resolution of M31 allows for the inference of a more recent colonization of the Andaman Islands than previously suggested, but cannot reject the very early peopling scenario. We further demonstrate a widespread overlap of mtDNA and cultural markers between the two major language groups of the Andaman archipelago. Given the "completeness" of the genealogy based on whole genome sequences, and the multiple scenarios for the peopling of the Andaman Islands sustained by this inferred genealogy, our study hints that further mtDNA based phylogeographic studies are unlikely to unequivocally support any one of these possibilities.
Link
Detailed mtDNA genotypes permit a reassessment of the settlement and population structure of the Andaman Islands.
Barik SS, Sahani R, Prasad BV, Endicott P, Metspalu M, Sarkar BN, Bhattacharya S, Annapoorna PC, Sreenath J, Sun D, Sanchez JJ, Ho SY, Chandrasekar A, Rao VR.
Anthropological Survey of India, 27 Jawaharlal Nehru Road, Kolkata 700 016, India.
The population genetics of the Indian subcontinent is central to understanding early human prehistory due to its strategic location on the proposed corridor of human movement from Africa to Australia during the late Pleistocene. Previous genetic research using mtDNA has emphasized the relative isolation of the late Pleistocene colonizers, and the physically isolated Andaman Island populations of Island South-East Asia remain the source of claims supporting an early split between the populations that formed the patchy settlement pattern along the coast of the Indian Ocean. Using whole-genome sequencing, combined with multiplexed SNP typing, this study investigates the deep structure of mtDNA haplogroups M31 and M32 in India and the Andaman Islands. The identification of a so far unnoticed rare polymorphism shared between these two lineages suggests that they are actually sister groups within a single haplogroup, M31'32. The enhanced resolution of M31 allows for the inference of a more recent colonization of the Andaman Islands than previously suggested, but cannot reject the very early peopling scenario. We further demonstrate a widespread overlap of mtDNA and cultural markers between the two major language groups of the Andaman archipelago. Given the "completeness" of the genealogy based on whole genome sequences, and the multiple scenarios for the peopling of the Andaman Islands sustained by this inferred genealogy, our study hints that further mtDNA based phylogeographic studies are unlikely to unequivocally support any one of these possibilities.
Link
September 06, 2007
YAP+ in South Asia
YAP+ defines haplogroup DE in the human Y chromosome phylogeny. Haplogroup D seems confined to a few Asian populations whereas haplogroup E is found in Africans and West Eurasians. Previous studies had determined that D is found at high frequencies among the short-statured isolated populations from the Andaman and Nicobar islands, and this new study indicates that D is also found in mainland South Asia among tribal Indians, albeit at lower frequencies.
Ann Hum Biol. 2007 Sep-Oct;34(5):582-6
YAP insertion signature in South Asia.
Chandrasekar A et al.
A total of 2169 samples from 21 tribal populations from different regions of India were scanned for the Y-chromosome Alu polymorphism. This study reports, for the first time, high frequencies (8-65%) of Y Alu polymorphic (YAP) insertion in northeast Indian tribes. All seven Jarawa samples from the Andaman and Nicobar islands had the YAP insertion, in conformity with an earlier study of Andaman Islanders. One isolated case with haplotype E* was found in Dungri Bhill, a western Indian population, while YAP insertion in northeast India and Andaman tribes was found in association with haplotype D* (M168, M174). YAP insertion frequencies reported in the mainland Indian populations are negligible, according to previous studies. Genetic drift may be the causative factor for the variable frequency of the YAP insertion in the mainland populations, while the founder effect may have resulted in the highest incidence of haplotype D among the Andaman Islanders. The results of YAP insertion and the evidence of previous mtDNA studies indicate an early out of Africa migration to the Andaman and Nicobar Islands. The findings of YAP insertion in northeast Indian tribes are very significant for understanding the evolutionary history of the region.
Ann Hum Biol. 2007 Sep-Oct;34(5):582-6
YAP insertion signature in South Asia.
Chandrasekar A et al.
A total of 2169 samples from 21 tribal populations from different regions of India were scanned for the Y-chromosome Alu polymorphism. This study reports, for the first time, high frequencies (8-65%) of Y Alu polymorphic (YAP) insertion in northeast Indian tribes. All seven Jarawa samples from the Andaman and Nicobar islands had the YAP insertion, in conformity with an earlier study of Andaman Islanders. One isolated case with haplotype E* was found in Dungri Bhill, a western Indian population, while YAP insertion in northeast India and Andaman tribes was found in association with haplotype D* (M168, M174). YAP insertion frequencies reported in the mainland Indian populations are negligible, according to previous studies. Genetic drift may be the causative factor for the variable frequency of the YAP insertion in the mainland populations, while the founder effect may have resulted in the highest incidence of haplotype D among the Andaman Islanders. The results of YAP insertion and the evidence of previous mtDNA studies indicate an early out of Africa migration to the Andaman and Nicobar Islands. The findings of YAP insertion in northeast Indian tribes are very significant for understanding the evolutionary history of the region.
July 07, 2006
The Homo floresiensis debate rages on
Well, the saga of the hobbit continues in a new article on the Journal of Human Evolution. Some previous entries on the topic. The new paper comes in favor of the idea that the Flores hominid represents a new species.
Journal of Human Evolution
Homo floresiensis: Microcephalic, pygmoid, Australopithecus, or Homo? (In Press, Accepted Manuscript, Available online 5 July 2006)
Debbie Argue, Denise Donlon, Colin Groves and Richard Wright
Abstract
The remarkable partial adult skeleton (LB1) excavated from Liang Bua cave on the island of Flores, Indonesia, has been attributed to a new species, Homo floresiensis, based upon a unique mosaic of primitive and derived features compared to any other hominin. The announcement precipitated widespread interest, and attention quickly focused on its possible affinities. LB1 is a small-bodied hominin with an endocranial volume of 380–410 cm3, a stature of 1 m, and an approximate geological age of 18,000 years. The describers (Brown et al., 2004) originally proposed that H. floresiensis was the end product of a long period of isolation of H. erectus or early Homo on a small island, a process known as insular dwarfism. More recently, Morwood, Brown, and colleagues (2005) reviewed this assessment in light of new material from the site and concluded that H. floresiensis is not likely to be descended from H. erectus, with the genealogy of the species remaining uncertain. Other interpretations, namely that LB1 is a pygmy or afflicted with microcephaly, have also been put forward.
We explore the affinities of LB1 using cranial and postcranial metric and nonmetric analyses. LB1 is compared to early Homo, two microcephalic humans, a ‘pygmoid’ excavated from another cave on Flores, H. sapiens (including African pygmies and Andaman Islanders), Australopithecus, and Paranthropus. Based on these comparisons, we conclude that it is unlikely that LB1 is a microcephalic human, and it cannot be attributed to any known species. Its attribution to a new species, Homo floresiensis, is supported.
Journal of Human Evolution
Homo floresiensis: Microcephalic, pygmoid, Australopithecus, or Homo? (In Press, Accepted Manuscript, Available online 5 July 2006)
Debbie Argue, Denise Donlon, Colin Groves and Richard Wright
Abstract
The remarkable partial adult skeleton (LB1) excavated from Liang Bua cave on the island of Flores, Indonesia, has been attributed to a new species, Homo floresiensis, based upon a unique mosaic of primitive and derived features compared to any other hominin. The announcement precipitated widespread interest, and attention quickly focused on its possible affinities. LB1 is a small-bodied hominin with an endocranial volume of 380–410 cm3, a stature of 1 m, and an approximate geological age of 18,000 years. The describers (Brown et al., 2004) originally proposed that H. floresiensis was the end product of a long period of isolation of H. erectus or early Homo on a small island, a process known as insular dwarfism. More recently, Morwood, Brown, and colleagues (2005) reviewed this assessment in light of new material from the site and concluded that H. floresiensis is not likely to be descended from H. erectus, with the genealogy of the species remaining uncertain. Other interpretations, namely that LB1 is a pygmy or afflicted with microcephaly, have also been put forward.
We explore the affinities of LB1 using cranial and postcranial metric and nonmetric analyses. LB1 is compared to early Homo, two microcephalic humans, a ‘pygmoid’ excavated from another cave on Flores, H. sapiens (including African pygmies and Andaman Islanders), Australopithecus, and Paranthropus. Based on these comparisons, we conclude that it is unlikely that LB1 is a microcephalic human, and it cannot be attributed to any known species. Its attribution to a new species, Homo floresiensis, is supported.
April 06, 2006
The deep mitochondrial origin of Australian aboriginals
Am J Phys Anthropol. 2006 Apr 4; [Epub ahead of print]
Mitochondrial genomics identifies major haplogroups in Aboriginal Australians.
van Holst Pellekaan SM, Ingman M, Roberts-Thomson J, Harding RM.
We classified diversity in eight new complete mitochondrial genome sequences and 41 partial sequences from living Aboriginal Australians into five haplogroups. Haplogroup AuB belongs to global lineage M, and AuA, AuC, AuD, and AuE to N. Within N, we recognize subdivisions, assigning AuA to haplogroup S, AuD to haplogroup O, AuC to P4, and AuE to P8. On available evidence, (S)AuA and (M)AuB are widespread in Australia. (P4)AuC is found in the Riverine region of western New South Wales, and was identified by others in northern Australia. (O)AuD and (P8)AuE were clearly identified only from central Australia. Our eight Australian full mt genome sequences, combined with 20 others (Ingman and Gyllensten 2003 Genome Res. 13:1600-1606) and compared with full mt genome sequences from regions to the north that include Papua New Guinea, Malaya, and Andaman and Nicobar Islands, show that ancestral connections between regions are deep and limited to clustering at the level of the N and M macrohaplogroups. The Australian-specific distribution of the five haplogroups identified indicates genetic isolation over a long period. Ancestral connections within Australia are deeper than those reflected by known linguistic or culturally based affinities. Applying a coalescence analysis to a gene tree for the coding regions of the eight genomic sequences, we made estimates of time depth that support a continuity of presence for the descendants of a founding population already established by 40,000 years ago.
Link
Mitochondrial genomics identifies major haplogroups in Aboriginal Australians.
van Holst Pellekaan SM, Ingman M, Roberts-Thomson J, Harding RM.
We classified diversity in eight new complete mitochondrial genome sequences and 41 partial sequences from living Aboriginal Australians into five haplogroups. Haplogroup AuB belongs to global lineage M, and AuA, AuC, AuD, and AuE to N. Within N, we recognize subdivisions, assigning AuA to haplogroup S, AuD to haplogroup O, AuC to P4, and AuE to P8. On available evidence, (S)AuA and (M)AuB are widespread in Australia. (P4)AuC is found in the Riverine region of western New South Wales, and was identified by others in northern Australia. (O)AuD and (P8)AuE were clearly identified only from central Australia. Our eight Australian full mt genome sequences, combined with 20 others (Ingman and Gyllensten 2003 Genome Res. 13:1600-1606) and compared with full mt genome sequences from regions to the north that include Papua New Guinea, Malaya, and Andaman and Nicobar Islands, show that ancestral connections between regions are deep and limited to clustering at the level of the N and M macrohaplogroups. The Australian-specific distribution of the five haplogroups identified indicates genetic isolation over a long period. Ancestral connections within Australia are deeper than those reflected by known linguistic or culturally based affinities. Applying a coalescence analysis to a gene tree for the coding regions of the eight genomic sequences, we made estimates of time depth that support a continuity of presence for the descendants of a founding population already established by 40,000 years ago.
Link
December 18, 2005
Dazzling Indian mtDNA haplogroup M
Mmm, I don't think I've seen the word "dazzling" on a paper title yet. Of interest from the paper:
The Dazzling Array of Basal Branches in the mtDNA Macrohaplogroup M from India as Inferred from Complete Genomes
Chang Sun et al.
Abstract
Many efforts based on complete mitochondrial DNA (mtDNA) genomes have been made to depict the global mtDNA landscape, but the phylogeny of Indian macrohaplogroup M has not yet been resolved in detail. To fill this lacuna, we took the same strategy as in our recent analysis of Indian mtDNA macrohaplogroup N and selected 56 mtDNAs from over 1,200 samples across India for complete sequencing, with the intention to cover all Indian autochthonous M lineages. As a result, the phylogenetic status of previously identified haplogroups based on control-region and/or partial coding-region information, such as M2, M3, M4, M5, M6, M30, and M33, was solidified or redefined here. Moreover, seven novel basal M haplogroups (viz. M34-M40) were identified and yet another five singular branches of the M phylogeny were discovered in the present study. The comparison of matrilineal components among India, East Asia, Southeast Asia, and Oceania at the deepest level yielded a star-like and non-overlapping pattern, reflecting a rapid mode of modern human dispersal along the Asian coast after the initial "Out-of-Africa" event.
Link
A particular case in question is the origin of haplogroup M1, which is mainly found in Northeast Africa and the Near East (Quintana-Murci et al. 1999). Due to the fact that M1 bears variant nucleotides, for example, at site 16311 in common with haplogroup M4, at 16129 with M5, and at 16249 with haplogroup M34, it has been proposed that M1 might have some affinity with Indian M haplogroups (Roychoudhury et al. 2001). This inference, however, could not receive support from our complete sequencing information. Indeed, the reconstructed ancestral motifs of all Indian M haplogroups turned out to be devoid of those variations that characterized M1, i.e., 6446, 6680, 12403, and 14110 (Maca-Meyer et al. 2001; Herrnstadt et al. 2002). Therefore, those common mutations in the control region rather reflect random parallel mutations. There is no evidence whatsoever that M1 originated in India.and:
It was pointed out that macrohaplogroups M, N, and R are universally distributed in Eurasia but differentiated into distinct haplogroups in East Asia, Oceania, Southeast Asia, and theAndaman Islands in particular (Macaulay et al. 2005; Thangaraj et al. 2005). This finding is further strengthened by our newly obtained Indian M data since the mutations that characterize the basal M lineages in India are virtually unique and not shared by those of East Asian, Oceanian, and Southeast 16 Asian M lineages (Ingman et al. 2000; Ingman and Gyllensten 2003; Kong et al. 2003; Tanaka et al. 2004; Friedlaender et al. 2005; Macaulay et al. 2005). This star-like and non-overlapping pattern of the mtDNA phylogeny is in good agreement with the proposed scenario that the initial dispersal of modern human into Eurasia some 60 thousand years ago was rather rapid along the Asian coastline (Macaulay et al. 2005; Thangaraj et al. 2005; Forster and Matsumura 2005).Molecular Biology and Evolution (advance access)
The Dazzling Array of Basal Branches in the mtDNA Macrohaplogroup M from India as Inferred from Complete Genomes
Chang Sun et al.
Abstract
Many efforts based on complete mitochondrial DNA (mtDNA) genomes have been made to depict the global mtDNA landscape, but the phylogeny of Indian macrohaplogroup M has not yet been resolved in detail. To fill this lacuna, we took the same strategy as in our recent analysis of Indian mtDNA macrohaplogroup N and selected 56 mtDNAs from over 1,200 samples across India for complete sequencing, with the intention to cover all Indian autochthonous M lineages. As a result, the phylogenetic status of previously identified haplogroups based on control-region and/or partial coding-region information, such as M2, M3, M4, M5, M6, M30, and M33, was solidified or redefined here. Moreover, seven novel basal M haplogroups (viz. M34-M40) were identified and yet another five singular branches of the M phylogeny were discovered in the present study. The comparison of matrilineal components among India, East Asia, Southeast Asia, and Oceania at the deepest level yielded a star-like and non-overlapping pattern, reflecting a rapid mode of modern human dispersal along the Asian coast after the initial "Out-of-Africa" event.
Link
May 13, 2005
Coastal migration theory
Two new papers in the new issue of Science are in support of the coastal Out of Africa migration hypothesis. According to this theory, the earliest Out of Africa members of our species followed the coastline of Asia, eventually reaching Australia, rather than heading towards the interior of the Eurasian landmass.
In Single, Rapid Coastal Settlement of Asia Revealed by Analysis of Complete Mitochondrial Genomes, Vincent Macaulay and colleagues sampled mitochondrial DNA from the Orang Asli of Malaysia. They found that these peoples possess a certain degree of admixture from other Southeast Asians, which was introduced in Holocene and subsequent periods, but they mostly have their own highly-specific, and very old subclades of macrohaplogroups N, M, and R. These macrohaplogroups, taken together, account for almost all non-African mtDNA. So, apparently the ancestors of all non-Africans were apparently involved in the very early migration Out of Africa from which the aboriginal Malaysians and also the Australasians are descended, and there was not a separate "northern" and "southern" migration Out of Africa.
In Reconstructing the Origin of Andaman Islanders, Kumarasamy Thangaraj and his colleagues studied the mtDNA of Andaman and Nicobar islanders. The former are Negritos physically, while the latter are Mongoloid. The Andamanese belong only in Y-haplogroup D and mt-haplogroup M, and the authors attribute this to a founder effect, as they are a very small isolated population. In contrast, the Nicobarese seem to descend from southeast Asians in more recent times, as their mtDNA sequences match those of people from China, Malaysia and Thailand.
In Single, Rapid Coastal Settlement of Asia Revealed by Analysis of Complete Mitochondrial Genomes, Vincent Macaulay and colleagues sampled mitochondrial DNA from the Orang Asli of Malaysia. They found that these peoples possess a certain degree of admixture from other Southeast Asians, which was introduced in Holocene and subsequent periods, but they mostly have their own highly-specific, and very old subclades of macrohaplogroups N, M, and R. These macrohaplogroups, taken together, account for almost all non-African mtDNA. So, apparently the ancestors of all non-Africans were apparently involved in the very early migration Out of Africa from which the aboriginal Malaysians and also the Australasians are descended, and there was not a separate "northern" and "southern" migration Out of Africa.
In Reconstructing the Origin of Andaman Islanders, Kumarasamy Thangaraj and his colleagues studied the mtDNA of Andaman and Nicobar islanders. The former are Negritos physically, while the latter are Mongoloid. The Andamanese belong only in Y-haplogroup D and mt-haplogroup M, and the authors attribute this to a founder effect, as they are a very small isolated population. In contrast, the Nicobarese seem to descend from southeast Asians in more recent times, as their mtDNA sequences match those of people from China, Malaysia and Thailand.
April 19, 2005
Three phylogeographic anomalies
In the last few years, the phylogeography of many clades of the human mtDNA and Y-chromosome systems has been adequately resolved, but there still exist several big remaining puzzles.
The first one is that of mtDNA haplogroup X, which has been addressed in a recent paper. This is a very ancient clade, which is found at low frequencies almost everywhere, and is divided into two subclades: X1 is found mainly in eastern and northern Africa, whereas X2 is found in northern Africa and everywhere else, including Native Americans. It is interesting that the X2 seems to have spread after the Last Glacial Maximum, and the Native American clade, X2a was an "early split": today's Siberian X2 seem to be recently derived from Western Eurasia than those of the ancient trek which brought X2 into the New World. It is fascinating that X2 was brought into the New World by some ancient expansion that did not leave any traces in the genes of modern inhabitants of the likely routes.
The second great puzzle is mtDNA haplogroup M1 which occurs in East and North Africa, West Asia and Southern Europe, but not apparently anywhere else. M1 is a branch of the mainly Asian macrohaplogroup M, which is of great antiquity in Asia and likely originated there. According to a recent abstract, Holden et al. indicate that M1 is found at high frequencies in East and Northern Africa but not in Sub-Saharan Africa, and hint that it may be linked to the Afro-Asiatic language family. This suggestion is reasonable, and in my opinion the correspondence between M1 and Y-chromosome haplogroup E3b is quite remarkable throughout the broad peri-Mediterranean region, with E3b also reaching high frequencies in Afro-Asiatic speakers.
The third puzzle is that of Y-chromosome haplogroup DE defined by the YAP mutation. The E clade of YAP encompasses the great majority of African Y-chromosomes, and is clearly split into a subclade, E3b which has a peri-Mediterranean distribution similar to that of the aforementioned M1, and all the rest, almost exclusively limited to Sub-Saharan Africa. The "brother" of E, is haplogroup D, which is found in such peoples as the Andamanese, the Tibetans, and the Ainu. At present it seems reasonable that E originated somewhere in Africa, but the origin of D is far from certain, as it is now found in certain "fringe" populations, but also in low frequencies among many Asians. Perhaps, D had a much more prevalent distribution in the past, but the expansion of later successful lineages, such as O, the main haplogroup found in East Asians today overwhelmed those earlier Asian populations. What about YAP itself? Dit it originate in Asia, where its D descendants are located, or in Africa, where its E descendants are? As late as 2003, we don't know, and no new research has appeared to shed light on this problem.
The first one is that of mtDNA haplogroup X, which has been addressed in a recent paper. This is a very ancient clade, which is found at low frequencies almost everywhere, and is divided into two subclades: X1 is found mainly in eastern and northern Africa, whereas X2 is found in northern Africa and everywhere else, including Native Americans. It is interesting that the X2 seems to have spread after the Last Glacial Maximum, and the Native American clade, X2a was an "early split": today's Siberian X2 seem to be recently derived from Western Eurasia than those of the ancient trek which brought X2 into the New World. It is fascinating that X2 was brought into the New World by some ancient expansion that did not leave any traces in the genes of modern inhabitants of the likely routes.
The second great puzzle is mtDNA haplogroup M1 which occurs in East and North Africa, West Asia and Southern Europe, but not apparently anywhere else. M1 is a branch of the mainly Asian macrohaplogroup M, which is of great antiquity in Asia and likely originated there. According to a recent abstract, Holden et al. indicate that M1 is found at high frequencies in East and Northern Africa but not in Sub-Saharan Africa, and hint that it may be linked to the Afro-Asiatic language family. This suggestion is reasonable, and in my opinion the correspondence between M1 and Y-chromosome haplogroup E3b is quite remarkable throughout the broad peri-Mediterranean region, with E3b also reaching high frequencies in Afro-Asiatic speakers.
The third puzzle is that of Y-chromosome haplogroup DE defined by the YAP mutation. The E clade of YAP encompasses the great majority of African Y-chromosomes, and is clearly split into a subclade, E3b which has a peri-Mediterranean distribution similar to that of the aforementioned M1, and all the rest, almost exclusively limited to Sub-Saharan Africa. The "brother" of E, is haplogroup D, which is found in such peoples as the Andamanese, the Tibetans, and the Ainu. At present it seems reasonable that E originated somewhere in Africa, but the origin of D is far from certain, as it is now found in certain "fringe" populations, but also in low frequencies among many Asians. Perhaps, D had a much more prevalent distribution in the past, but the expansion of later successful lineages, such as O, the main haplogroup found in East Asians today overwhelmed those earlier Asian populations. What about YAP itself? Dit it originate in Asia, where its D descendants are located, or in Africa, where its E descendants are? As late as 2003, we don't know, and no new research has appeared to shed light on this problem.
April 03, 2005
mtDNA haplogroup M originated in Asia
The origin of mtDNA haplogroup M has been matter of some controversy. A reader alerts me to a new paper which conclusively demonstrates its Asian origin, by sequencing 24 full mitochondrial genomes, which allowed the researchers to reconstruct its phylogeny.
Haplogroup M is found mainly in Asia, and its various subclades make up the great majority of Mongoloid and Indian lineages. It is also found in the Near East, the Caucasus, Asia Minor and Southern Europe, in addition to Egypt, and Ethiopia. A particular clade of M, named M1 is the main one found in the "western" range of its range, and it was hypothesized that its high frequency and diversity in Ethiopia may indicate an East African origin for the entire M.
However, M1 is geographically limited in Africa, while it is very widespread in Asia. If M originated in Africa, then it must have done so at a very old time, because it would have to spread throughout Asia and the New World. However, it would be difficult to explain how M crossed such a vast distance and yet failed to reach other populations of Africa except Ethiopians, Egyptians and a few others.
The new study has dated the Indian clades of M and shown them to be very old. This clinches the argument in favor of the Asian origin.
Haplogroup M is one of those mtDNA lineages which does not correspond well to present-day racial groups, as it spans Mongoloid, Indian Caucasoid and Paleoindian, as well as Ethiopid and various Caucasoid groups in lesser frequency. This paper represents significant progress in our understanding of human prehistory.
Now, let's wait to see what the origin of other "peculiar" lineages turns out to be, such as the mysterious YAP (Y-chromosome haplogroup DE) clade which is found in peoples such as Greeks, East Africans, Andamanese, Tibetans and Ainu...
BMC Evolutionary Biology 2005, 5:26 doi:10.1186/1471-2148-5-26
Phylogeny and antiquity of M macrohaplogroup inferred from complete mt DNA sequence of Indian specific lineages
Revathi Rajkumar et al.
Abstract (provisional)
Background
Analysis of human complete mitochondrial DNA sequences has largely contributed to resolve phylogenies and antiquity of different lineages belonging to the majorhaplogroups L, N and M (East-Asian lineages). In the absence of whole mtDNA sequence information of M lineages reported in India that exhibits highest diversity within the sub-continent, the present study was undertaken to provide a detailed analysis of this macrohaplogroup to precisely characterize and unravel the intricate phylogeny of the lineages and to establish the antiquity of M lineages in India.
Results
The phylogenetic tree constructed from sequencing information of twenty-four whole mtDNA genome revealed novel substitutions in the previously defined M2a and M6 lineages. The most striking feature of this phylogenetic tree is the recognition of two new lineages, M30 and M31, distinguished by transitions at 12007 and 5319, respectively. M30 comprises of M18 and identifies a potential new sub-lineage possessing substitution at 16223 and 16300. It further branches into M30a sub-lineage, defined by 15431 and 195A substitution. The age of M30 lineage was estimated at 33,042 YBP, indicating a more recent expansion time than M2 (49,686 YBP). The M31 branch encompasses the M6 lineage along with the previously defined M3 and M4 lineages. Contradictory to earlier reports, the M5 lineage does not always include a 12477 substitution, and is more appropriately defined by a transversion at 10986A. The phylogenetic tree also identifies a potential new lineage in the M* branch with HVSI sequence as 16223,16325. Substitutions in M25 were in concordance with previous reports.
Conclusions
This study describes five new basal mutations and recognizes two new lineages, M30 and M31 that substantially contribute to the present understanding of macrohaplogroup M. These two newly erected lineages include the previously independent lineages M18 and M6 as sub-lineages within them, respectively, suggesting that most mt DNA genomes might arise as limited offshoots of M trunk. Furthermore, this study supports the non existence of lineages such as M3 and M4 that are solely defined on the basis of fast mutating control region motifs and hence, establishes the importance of coding region markers for an accurate understanding of the phylogeny. The deep roots of M phylogeny clearly establish the antiquity of Indian lineages, especially M2, as compared to Ethiopian M1 lineage and hence, support an Asian origin of M macrohaplogroup.
Link
Haplogroup M is found mainly in Asia, and its various subclades make up the great majority of Mongoloid and Indian lineages. It is also found in the Near East, the Caucasus, Asia Minor and Southern Europe, in addition to Egypt, and Ethiopia. A particular clade of M, named M1 is the main one found in the "western" range of its range, and it was hypothesized that its high frequency and diversity in Ethiopia may indicate an East African origin for the entire M.
However, M1 is geographically limited in Africa, while it is very widespread in Asia. If M originated in Africa, then it must have done so at a very old time, because it would have to spread throughout Asia and the New World. However, it would be difficult to explain how M crossed such a vast distance and yet failed to reach other populations of Africa except Ethiopians, Egyptians and a few others.
The new study has dated the Indian clades of M and shown them to be very old. This clinches the argument in favor of the Asian origin.
Haplogroup M is one of those mtDNA lineages which does not correspond well to present-day racial groups, as it spans Mongoloid, Indian Caucasoid and Paleoindian, as well as Ethiopid and various Caucasoid groups in lesser frequency. This paper represents significant progress in our understanding of human prehistory.
Now, let's wait to see what the origin of other "peculiar" lineages turns out to be, such as the mysterious YAP (Y-chromosome haplogroup DE) clade which is found in peoples such as Greeks, East Africans, Andamanese, Tibetans and Ainu...
BMC Evolutionary Biology 2005, 5:26 doi:10.1186/1471-2148-5-26
Phylogeny and antiquity of M macrohaplogroup inferred from complete mt DNA sequence of Indian specific lineages
Revathi Rajkumar et al.
Abstract (provisional)
Background
Analysis of human complete mitochondrial DNA sequences has largely contributed to resolve phylogenies and antiquity of different lineages belonging to the majorhaplogroups L, N and M (East-Asian lineages). In the absence of whole mtDNA sequence information of M lineages reported in India that exhibits highest diversity within the sub-continent, the present study was undertaken to provide a detailed analysis of this macrohaplogroup to precisely characterize and unravel the intricate phylogeny of the lineages and to establish the antiquity of M lineages in India.
Results
The phylogenetic tree constructed from sequencing information of twenty-four whole mtDNA genome revealed novel substitutions in the previously defined M2a and M6 lineages. The most striking feature of this phylogenetic tree is the recognition of two new lineages, M30 and M31, distinguished by transitions at 12007 and 5319, respectively. M30 comprises of M18 and identifies a potential new sub-lineage possessing substitution at 16223 and 16300. It further branches into M30a sub-lineage, defined by 15431 and 195A substitution. The age of M30 lineage was estimated at 33,042 YBP, indicating a more recent expansion time than M2 (49,686 YBP). The M31 branch encompasses the M6 lineage along with the previously defined M3 and M4 lineages. Contradictory to earlier reports, the M5 lineage does not always include a 12477 substitution, and is more appropriately defined by a transversion at 10986A. The phylogenetic tree also identifies a potential new lineage in the M* branch with HVSI sequence as 16223,16325. Substitutions in M25 were in concordance with previous reports.
Conclusions
This study describes five new basal mutations and recognizes two new lineages, M30 and M31 that substantially contribute to the present understanding of macrohaplogroup M. These two newly erected lineages include the previously independent lineages M18 and M6 as sub-lineages within them, respectively, suggesting that most mt DNA genomes might arise as limited offshoots of M trunk. Furthermore, this study supports the non existence of lineages such as M3 and M4 that are solely defined on the basis of fast mutating control region motifs and hence, establishes the importance of coding region markers for an accurate understanding of the phylogeny. The deep roots of M phylogeny clearly establish the antiquity of Indian lineages, especially M2, as compared to Ethiopian M1 lineage and hence, support an Asian origin of M macrohaplogroup.
Link
March 29, 2005
Sexual dimorphism in 26 populations
Using the same data as before, I calculate the sexual dimorphism in 26 craniometric samples from around the world.
There are many ways to express sexual dimorphism, i.e., differences between men and women, which extend to both size and shape. I will limit myself to the simple measure of the average (over all traits) ratio of the male to the female mean (over all individuals).
Zulu 1.06
Egypt 1.06
Atayal 1.06
Zalavar 1.06
San 1.07
Hainan 1.07
Tasmanian 1.07
Moriori 1.07
Norse 1.07
Lake Alexandrina 1.07
Tolai 1.07
Dogon 1.08
Berg 1.08
Philippine 1.08
Yauyos 1.08
Teita 1.08
Buriat 1.08
Santa Cruz Island 1.08
North Kyushu 1.08
Ainu 1.09
Andaman Islands 1.09
Arikara 1.09
Hokkaido 1.09
Mokapu 1.09
Easter Island 1.09
Guam 1.09
So, it appears that these populations do not differ by much from each other in terms of sexual dimorphism. But, if we look at individual traits, the situation is much different. Men and women are most dimorphic (in decreasing order) in terms of their glabella projection (1.52), supraorbital projection (1.25), simotic subtense (1.2), mastoid breadth (1.18), mastoid height (1.16). So, it turns out that men and women can be quite different in terms of some traits, but not in terms of others.
There are many ways to express sexual dimorphism, i.e., differences between men and women, which extend to both size and shape. I will limit myself to the simple measure of the average (over all traits) ratio of the male to the female mean (over all individuals).
Zulu 1.06
Egypt 1.06
Atayal 1.06
Zalavar 1.06
San 1.07
Hainan 1.07
Tasmanian 1.07
Moriori 1.07
Norse 1.07
Lake Alexandrina 1.07
Tolai 1.07
Dogon 1.08
Berg 1.08
Philippine 1.08
Yauyos 1.08
Teita 1.08
Buriat 1.08
Santa Cruz Island 1.08
North Kyushu 1.08
Ainu 1.09
Andaman Islands 1.09
Arikara 1.09
Hokkaido 1.09
Mokapu 1.09
Easter Island 1.09
Guam 1.09
So, it appears that these populations do not differ by much from each other in terms of sexual dimorphism. But, if we look at individual traits, the situation is much different. Men and women are most dimorphic (in decreasing order) in terms of their glabella projection (1.52), supraorbital projection (1.25), simotic subtense (1.2), mastoid breadth (1.18), mastoid height (1.16). So, it turns out that men and women can be quite different in terms of some traits, but not in terms of others.
March 28, 2005
Who is the most diverse of them all?
Here is the diversity ranking of Howells' 28 human populations based on 45 cranial measurements. The numbers are the average population standard deviation (for each population over all 45 measurements) as a percentage of the average human standard deviation (for all groups over all 45 measurements). In parentheses, the racial cluster of each population according to my previous analysis.
Guam 76.8 (Mongoloid)
Andaman Islands 76.8 (Andamanese)
Santa Cruz Island 76.9 (Americanoid)
Zalavar 77.0 (Caucasoid)
Yauyos 77.8 (Americanoid)
Easter Island 77.9 (Polynesoid)
Arikara 78.2 (Americanoid)
Moriori 78.2 (Polynesoid)
Tolai 78.3 (Australoid)
Lake Alexandrina 78.3 (Australoid)
Atayal 78.8 (Mongoloid)
Hainan 79.2 (Mongoloid)
Anyang 79.9 (Mongoloid)
Norse 80.1 (Caucasoid)
North Kyushu 80.6 (Mongoloid)
Mokapu 80.9 (Polynesoid)
Ainu 81.3 (Ainu)
Eskimo 81.6 (Eskimo)
Egypt 82.8 (Caucasoid)
Phillipine 84.2 (Mongoloid)
Dogon 84.5 (Negroid)
Teita 84.8 (Negroid)
Zulu 85.1 (Negroid)
Berg 85.3 (Caucasoid)
Tasmanian 85.3 (Australoid)
Hokkaido 85.5 (Mongoloid)
Buriat 87.0 (Mongoloid)
San 89.0 (Capoid)
Guam 76.8 (Mongoloid)
Andaman Islands 76.8 (Andamanese)
Santa Cruz Island 76.9 (Americanoid)
Zalavar 77.0 (Caucasoid)
Yauyos 77.8 (Americanoid)
Easter Island 77.9 (Polynesoid)
Arikara 78.2 (Americanoid)
Moriori 78.2 (Polynesoid)
Tolai 78.3 (Australoid)
Lake Alexandrina 78.3 (Australoid)
Atayal 78.8 (Mongoloid)
Hainan 79.2 (Mongoloid)
Anyang 79.9 (Mongoloid)
Norse 80.1 (Caucasoid)
North Kyushu 80.6 (Mongoloid)
Mokapu 80.9 (Polynesoid)
Ainu 81.3 (Ainu)
Eskimo 81.6 (Eskimo)
Egypt 82.8 (Caucasoid)
Phillipine 84.2 (Mongoloid)
Dogon 84.5 (Negroid)
Teita 84.8 (Negroid)
Zulu 85.1 (Negroid)
Berg 85.3 (Caucasoid)
Tasmanian 85.3 (Australoid)
Hokkaido 85.5 (Mongoloid)
Buriat 87.0 (Mongoloid)
San 89.0 (Capoid)
Subscribe to:
Posts (Atom)