November 05, 2006

Actual vs. Observable Criminality

Inspired from this Telegraph story:

Race watchdogs are to investigate the national DNA database over revelations that up to three quarters of young black men will soon have their profiles stored.

Trevor Phillips, the chairman of the Commission for Racial Equality (CRE), vowed to examine whether the database breached race relations laws following the findings by The Sunday Telegraph. "This is tantamount to criminalising a generation of young black men," he said.

An estimated 135,000 black males aged 15 to 34 will be entered in the crime-fighting- database by April, equivalent to as many as 77 per cent of the young black male population in England and Wales. By contrast, only 22 per cent of young white males, and six per cent of the general population, will be on the database.
We should remember that a group's observed criminality is a function of their propensity for criminality as well as the authorities' propensity to investigate members of the group. I suspect that differences in average criminality (perhaps related to personality differences between groups) result in a (correct) perception that an individual of group A has a higher probability of engaging in some type of criminal activity than an individual of group B. This perception then leads one to investigate more thoroughly persons of group A, thus leading to a greater observable criminality for group A.

Suppose that 60% of car thefts in a city are done by Blues. The police is then justified in thinking of Blues as more likely to steal cars than Greens. If a car theft takes place, and given two suspects, a Blue and a Green, and given a limited number of police resources, the smarter choice is to investigate the Blue individual.

Suppose that the police has enough resources to investigate 1 suspect 50% of the time, and both suspects 50% of the time. Then, 50% of the time they would investigate both suspects and catch the perpetrator (30% Blues and 20% Greens), but 50% of the time they will only investigate the Blue one leading to an arrest of a Blue one in 30% of the cases.

Thus, in total there will be 60% Blues and 20% Greens that were arrested, i.e., a difference in actual criminality of 1.5x was transformed into a 3x observed one. Moreover, 80% of the total criminals would be arrested with a race-conscious policy.

Suppose now that a race-blind policy is enacted. Now, for the 50% of the time where they can only investigate 1 suspect, they pick his race randomly and with equal probability. Now they will expect to catch a Blue criminal whenever a Blue committed the crime and they happened to investigate the Blue suspect (15%) and similarly a Green one (10%). So, with a race-blind policy 75% of the total criminals would be arrested.

This illustrates the problem: using the information encoded in the "race" variable leads to more efficient crime fighting: more criminals are caught. However, it also leads to a upwardly biased estimate of the criminality of the more criminal group.

In my opinion, society should not throw away information encoded in sex, race, ethnicity, etc. in fighting crime. That is the rational choice to maximize justice. However, it should also be aware that this rational group-conscious policy biases our perception.

PS: The relevant statistics for particular human group differences, including those cited by the Telegraph, are not important for the argument presented above. I am agnostic about both the magnitude in actual criminality between different groups (e.g., men vs. women, Muslims vs. Buddhists, blacks vs. Mongoloids, etc.) as well as the potential racial biases (above and beyond the rational group-conscious choice), or racial political correctness that may further inflate/deflate observable differences.

November 03, 2006

Y chromosomes of Czech Republic

From the paper:
The position of Czech samples in the genetic landscape of central Europe emerges in Correspondence Analysis (Fig. 2). In the first dimension the Czech samples are clustered and positioned in between the Polish and German samples. In fact Hg’s R1a and N3-Tat (more frequent in Poland) have the largest negative loadings on this dimension, whereas Hg’s K*-M9 and J2*-M172 (more frequent in Germany and Italy) have the largest positive ones. The second dimension is mainly contributed by Hg’s I-M170, E3b1-M78, and K*-M9 (negative loadings) vs. Hg P-DYS257*(xR1a). Thus, the position of the three Balkan populations in Figure 2 is in line with the focal distribution of Hg’s I and E3b1 in this area (Cruciani et al., 2004; Pericic et al., 2005).


These seem to agree with my observations regarding a recent study on Germans and Poles:
We see that Poles are differentiated by Germans on the basis of R1a1 and N3 (Finno-Ugrian admixture). The differentiation on the basis of I subgroups is not evident, because no downstream markers for this haplogroup were examined in this study.

Also of particular interest is that of the two Neolithic haplogroups, J2 is associated with Germans, whereas DE* is apparently not. So, this may hint at different patterns of arrival of the two haplogroups in this part of the world. This would agree with some recent results from Balkan Slavic populations, that typically found a higher-percentage of YAP (DE) lineages than J2 ones.
as well as the observational evidence.

American Journal of Physical Anthropology
(online early)

Y-chromosomal variation in the Czech Republic

F. Luca et al.

Abstract

To analyze the contribution of the Czech population to the Y-chromosome diversity landscape of Europe and to reconstruct past demographic events, we typed 257 males from five locations for 21 UEPs. Moreover, 141 carriers of the three most common haplogroups were typed for 10 microsatellites and coalescent analyses applied. Sixteen Hg's characterized by derived alleles were identified, the most common being R1a-SRY10831 and P-DYS257*(xR1a). The pool of haplogroups within I-M170 represented the third most common clade. Overall, the degree of population structure was low. The ages for Hg I-M170, P-DYS257*(xR1a), and R1a-SRY10831 ap peared to be comparable and compatible with their presence during or soon after the LGM. A signal of population growth beginning in the first millennium B.C. was detected. Its similarity among the three most common Hg's indicated that growth was characteristic for a gene pool that already contained all of them. The Czech population appears to be influenced, to a very moderate extent, by genetic inputs from outside Europe in the post-Neolithic and historical times. Population growth postdated the archaeologically documented introduction of Neolithic technology and the estimated central value coincides with a period of repeated changes driven by the development of metal technologies and the associated social and trade organization.

Link

November 01, 2006

Genetic impact of the caste system in India


This article has appeared in PubMed but not yet posted on the Human Genetics website.

Hum Genet. 2006 Oct 31; [Epub ahead of print]

Y-chromosomal insights into the genetic impact of the caste system in India.

Zerjal T, Pandya A, Thangaraj K, Ling EY, Kearley J, Bertoneri S, Paracchini S, Singh L, Tyler-Smith C.

The caste system has persisted in Indian Hindu society for around 3,500 years. Like the Y chromosome, caste is defined at birth, and males cannot change their caste. In order to investigate the genetic consequences of this system, we have analysed male-lineage variation in a sample of 227 Indian men of known caste, 141 from the Jaunpur district of Uttar Pradesh and 86 from the rest of India. We typed 131 Y-chromosomal binary markers and 16 microsatellites. We find striking evidence for male substructure: in particular, Brahmins and Kshatriyas (but not other castes) from Jaunpur each show low diversity and the predominance of a single distinct cluster of haplotypes. These findings confirm the genetic isolation and drift within the Jaunpur upper castes, which are likely to result from founder effects and social factors. In the other castes, there may be either larger effective population sizes, or less strict isolation, or both.

Link

Machiavellian intelligence hypothesis

Yann points me to a new PNAS article.

Proc. Natl. Acad. Sci. USA, 10.1073/pnas.0601428103

The dynamics of Machiavellian intelligence

Sergey Gavrilets and Aaron Vose

The "Machiavellian intelligence" hypothesis (or the "social brain" hypothesis) posits that large brains and distinctive cognitive abilities of humans have evolved via intense social competition in which social competitors developed increasingly sophisticated "Machiavellian" strategies as a means to achieve higher social and reproductive success. Here we build a mathematical model aiming to explore this hypothesis. In the model, genes control brains which invent and learn strategies (memes) which are used by males to gain advantage in competition for mates. We show that the dynamics of intelligence has three distinct phases. During the dormant phase only newly invented memes are present in the population. During the cognitive explosion phase the population’s meme count and the learning ability, cerebral capacity (controlling the number of different memes that the brain can learn and use), and Machiavellian fitness of individuals increase in a runaway fashion. During the saturation phase natural selection resulting from the costs of having large brains checks further increases in cognitive abilities. Overall, our results suggest that the mechanisms underlying the "Machiavellian intelligence" hypothesis can indeed result in the evolution of significant cognitive abilities on the time scale of 10 to 20 thousand generations. We show that cerebral capacity evolves faster and to a larger degree than learning ability. Our model suggests that there may be a tendency toward a reduction in cognitive abilities (driven by the costs of having a large brain) as the reproductive advantage of having a large brain decreases and the exposure to memes increases in modern societies.

Link

The Lancet publishes global sex survey

Scientific American reports:
Some of the primary findings of this meta-analysis are unsurprising: Monogamy is the dominant sexual pattern globally. Married individuals--which constitute most people studied--have the most sex. Men report having engaged in sex with more partners than women in a given year. Instances of males with multiple partners, however, were more frequent in industrialized nations, Wellings says, than in places such as Africa, where sexual health education is relatively unsophisticated. "We certainly expected to see that in African countries there would be an equal prevalence of multiple partnerships," she says. "I don't think we expected to see less reporting of them."

That is just one of many surprises found in the meta-analysis. Contrary to popular belief, there is no evidence that young people are engaging in sexual intercourse at earlier ages--the first instance of sexual activity for both genders generally occurs at between 15 and 19 years of age globally. "There's always a tendency to think that things are going to 'hell in a handbasket,'" remarks Richard Parker, the sociomedical sciences department chair at Columbia University's Mailman School of Public Health. "A lot of what we say we think about trends in sexual behavior are basically kind of knee-jerk, impressionistic conclusions that we make, rather than because we looked at the data." Another surprising finding is that married women are actually at greater risk of unhealthy sexual behavior-they find it harder than single women do to convince their partners to use condoms.

One optimistic finding is that condom use is up worldwide. From 1993 to 2001, in 19 African countries, the rate of condoms employed to prevent pregnancy increased from five to 19 percent of the time; at the last instance of intercourse, the increase was from 19 percent to 28 percent. Wellings explains, however, that "there are parts of this that are reassuring and parts that are not: If you look at the [cross-national] data on condom use, you then see a big difference between the richer and poorer countries." Although numbers have improved in less developed parts of the world, condom use still lags far behind industrialized nations. "The protection of risk behavior is less prevalent in the poorer countries," she says.

And from WebMD:
Some of the survey's major findings:

# While there is no major trend toward earlier sexual experience, a trend toward later marriage has led to an increase in premarital sex.
# Married people have more sex than unmarried people do.
# Sexual activity among single people is more common in industrialized countries than in developing countries.
# First sexual experience is often forced or sold.
# Monogamy is the dominant pattern in most parts of the world. Men report more multiple partnerships than do women. Such men are more likely to live in developed nations.
# Marriage is no safeguard of sexual health. It is more difficult for married women to negotiate safe sex and condom use than it is for single women.
# Among girls who marry at a very young age, "very early sexual experience within marriage can be coercive and traumatic."
# Condom use is increasing, but condom-use rates remain low in many developing countries.
# Public health measures to improve sexual health should focus not only on individual behaviors but also on broader issues such as gender, poverty, and mobility.
# Public-health messages intended to reduce sexual risk-taking "should respect diversity and preserve choice."
# School-based sexual education delays and does not hasten onset of sexual activity.

Chess and Intelligence

A casual reading of this abstract might give the wrong impression that intelligence is not necessary for achievement in chess. However, the actual results are that chess players, and even more, elite chess players have substantially higher intelligence than average. However, given that someone is a chess player, the researchers found that their ability, measured by a "chess test" or an international testing was not very significantly predicted by their general intelligence. Thus, we may say that intelligence seems to be a necessary pre-condition for chess achievement, but other factors tend to predict the chess ability of those who are intelligent enough to be good at chess.

Intelligence (online early)

Does chess need intelligence? — A study with young chess players

Merim Bilalić et al.

Abstract

Although it is widely acknowledged that chess is the best example of an intellectual activity among games, evidence showing the association between any kind of intellectual ability and chess skill has been remarkably sparse. One of the reasons is that most of the studies investigated only one factor (e.g., intelligence), neglecting other factors relevant for the acquisition of chess skill (e.g., amount of practice, years of experience). The present study investigated the chess skill of 57 young chess players using measures of intelligence (WISC III), practice, and experience. Although practice had the most influence on chess skill, intelligence explained some variance even after the inclusion of practice. When an elite subsample of 23 children was tested, it turned out that intelligence was not a significant factor in chess skill, and that, if anything, it tended to correlate negatively with chess skill. This unexpected result is explained by a negative correlation between intelligence and practice in the elite subsample. The study demonstrates the dangers of focusing on a single factor in complex real-world situations where a number of closely interconnected factors operate.

Link

October 28, 2006

mtDNA of island Southeast Asia

A new preprint has appeared in the American Journal of Human Genetics site about the mtDNA origins of island SE Asians.

American Journal of Human Genetics (preprint)

A mitochondrial stratigraphy for Island Southeast Asia

Catherine Hill et al.

Island Southeast Asia (ISEA) was first colonized by modern humans at least 45,000 years ago, but the extent to which the modern inhabitants trace their ancestry to the first settlers is a matter of debate. It is widely held in both archaeology and linguistics that they are largely descended from a second wave of dispersal, proto-Austronesian-speaking agriculturalists who originated in China and spread to Taiwan ~5,500 years ago. From there they are thought to have dispersed into Island Southeast Asia ~4,000 years ago, assimilating the indigenous populations. Here, we demonstrate that mtDNA diversity in the region is extremely high and includes a large number of indigenous clades. Only a fraction of these date back to the time of first settlement, and the majority appear to mark dispersals in the late Pleistocene or early
Holocene most likely triggered by post-glacial flooding. There are much closer genetic links to Taiwan than to the mainland, but most of these probably pre-dated the mid-Holocene ‘out of Taiwan’ event as traditionally envisioned. Only ~20% at most of modern mtDNAs in ISEA could be linked to such an event, suggesting that if an agriculturalist migration did take place it was demographically minor, at least as regards the involvement of women.

Link (pdf)

October 25, 2006

Blue-eyed men prefer blue-eyed women

Eye spy a cheat
BLUE-eyed men prefer blue-eyed women, apparently because eye colour can help reveal whether their partner has been faithful, researchers say.

"Before you request a paternity test, spend a few minutes looking at your child's eye colour," Bruno Laeng and colleagues at the University of Tromso in Norway said in the study.

Under the laws of genetics, two parents with blue eyes will always have blue-eyed children, it said. So a blue-eyed man can know his blue-eyed wife or partner has cheated on him if their child has brown eyes.

"Blue-eyed men may have unconsciously learned to value a physical trait that can facilitate recognition of own kin," the scientists said in the journal Behavioural Ecology and Sociobiology.

The scientists asked 88 students to rate the attractiveness of models based on pictures manipulated so that half of them had blue eyes and the other half had brown eyes.

The blue-eyed men in the group showed a preference for blue-eyed women.

But brown-eyed men, who cannot find any clues about paternity from a child's eye colour, had no preferences by eye colour.

Women showed no preference for brown or blue-eyed men, irrespective of their own eye colour.

A quarter of children born to two brown-eyed parents who have both brown and blue-eye genes among their ancestors will have blue eyes. The rest will be brown.

In a second study, 443 young adults of both sexes were asked about the eye colour of their partners – blue-eyed men were also the group with the highest proportion of partners with the same eye colour.
Behavioral Ecology and Sociobiology (online first)

Why do blue-eyed men prefer women with the same eye color?

Bruno Laeng et al.

Abstract The human eye color blue reflects a simple, predictable, and reliable genetic mechanism of inheritance. Blue-eyed individuals represent a unique condition, as in their case there is always direct concordance between the genotype and phenotype. On the other hand, heterozygous brown-eyed individuals carry an allele that is not concordant with the observed eye color. Hence, eye color can provide a highly visible and salient cue to the child’s heredity. If men choose women with characteristics that promote the assurance of paternity, then blue-eyed men should prefer and feel more attracted towards women with blue eyes. To test these predictions, close-up photos of young women and adult men with either blue or brown eyes were rated for their attractiveness by young women and men observers with either blue or brown eyes (N=88). The eye color in the photographs of each model was manipulated so that a same face would be shown with either the natural eye color (e.g., blue) or with the other color (e.g., brown). Both blue-eyed and brown-eyed female participants showed no difference in their attractiveness ratings for male models of either eye color. Similarly, brown-eyed men showed no preference for either blue-eyed or brown-eyed female models. However, blue-eyed men rated as more attractive the blue-eyed women than the brown-eyed ones. We interpret the latter preference in terms of specific mate selective choice of blue-eyed men, reflecting strategies for reducing paternity uncertainty. In a second study, a group of young adults (N=443) of both sexes and different eye colors (blue, brown, and green) were asked to report the eye and hair color of their romantic partners. Their responses indicated the presence of assortative mating by eye color as well as, to a less degree, for hair color. Most importantly, blue-eyed male respondents were the group with the largest proportion of partners of same eye color. These findings 1) indicate that blue-eyed men do prefer women with the same eye color and 2) specifically suggest the presence of a male adaptation for the detection of extra-pair paternity based on eye color, as a phenotypically based assurance of paternity (i.e., when the father’s and offspring’s phenotypes match) as well as a defense against cuckoldry (i.e., when the phenotypes do not match).

Link

Korean mtDNA

Electrophoresis. 2006 Oct 23; [Epub ahead of print]

East Asian mtDNA haplogroup determination in Koreans: Haplogroup-level coding region SNP analysis and subhaplogroup-level control region sequence analysis.

Lee HY et al.

The present study analyzed 21 coding region SNP markers and one deletion motif for the determination of East Asian mitochondrial DNA (mtDNA) haplogroups by designing three multiplex systems which apply single base extension methods. Using two multiplex systems, all 593 Korean mtDNAs were allocated into 15 haplogroups: M, D, D4, D5, G, M7, M8, M9, M10, M11, R, R9, B, A, and N9. As the D4 haplotypes occurred most frequently in Koreans, the third multiplex system was used to further define D4 subhaplogroups: D4a, D4b, D4e, D4g, D4h, and D4j. This method allowed the complementation of coding region information with control region mutation motifs and the resultant findings also suggest reliable control region mutation motifs for the assignment of East Asian mtDNA haplogroups. These three multiplex systems produce good results in degraded samples as they contain small PCR products (101-154 bp) for single base extension reactions. SNP scoring was performed in 101 old skeletal remains using these three systems to prove their utility in degraded samples. The sequence analysis of mtDNA control region with high incidence of haplogroup-specific mutations and the selective scoring of highly informative coding region SNPs using the three multiplex systems are useful tools for most applications involving East Asian mtDNA haplogroup determination and haplogroup-directed stringent quality control.

Link

Realistic bust of Aristotle discovered

Aristotle as he really looked
A bust of Aristotle found beneath the Acropolis in Athens is the first to show the Greek philosopher with a hooked nose.

Archaeologists said that the 46cm (18in) marble bust, which dates from the 1st century AD, about 400 years after Aristotle lived, was “the best-preserved likeness ever found”. Alkestis Horemi, who supervises digs at the Acropolis, said: “This is the only bust portraying the philosopher with a hooked nose in line with ancient descriptions.” (AFP)

October 24, 2006

Horse domestication news from Kazakhstan

See also Botai and Horse Domestication.

New evidence of early horse domestication

Soil from a Copper Age site in northern Kazakhstan has yielded new evidence for domesticated horses up to 5,600 years ago. The discovery, consisting of phosphorus-enriched soils inside what appear to be the remains of horse corrals beside pit houses, matches what would be expected from Earth once enriched by horse manure. The Krasnyi Yar site was inhabited by people of the Botai culture of the Eurasian Steppe, who relied heavily on horses for food, tools, and transport.

"There's very little direct evidence of horse domestication," says Sandra Olsen, an archaeologist and horse domestication researcher at the Carnegie Museum of Natural History in Pittsburgh, PA. That's because 5,600 years ago there were no saddles or metal bits to leave behind. Equipment like bridles, leads, and hobbles would have been made from thongs of horse hide, and would have rotted away long ago. Likewise horses themselves have not changed much physically as a result of domestication, unlike dogs or cattle. So ancient horse bones don't easily reveal the secrets of domestication.

With research funding from the National Science Foundation, Olsen's team took a different tack. They looked for circumstantial evidence that people were keeping horses. One approach was to survey the Krasnyi Yar site with instruments to map out subtle electrical and magnetic irregularities in the soils. With this they were able to identify the locations of 54 pit houses and dozens of post moulds where vertical posts once stood. Some of the post moulds were arranged circularly, as would be most practical for a corral.

Next, geologist Michael Rosenmeier from the University of Pittsburgh collected soil samples from inside the fenced area and outside the settlement. The samples were analyzed for nitrogen, phosphorus, potassium, and sodium concentrations by Rosemary Capo, University of Pittsburgh geochemist, and her students. Modern horse manure is rich in phosphorous, potassium, and especially nitrogen, compared to undisturbed soils. But because nitrogen is mobile in soils, it can be lost to groundwater or transferred to the atmosphere by organic and inorganic processes. Phosphorus, on the other hand, can be locked into place by calcium and iron and is more likely to be preserved in the soils for millennia.

As it turned out, the soil from inside the alleged corral had up to ten times the phosphorus concentration as the soils from outside the settlement. Lots of phosphorus can also indicate a hearth, said Capo, but that phosphorus is usually accompanied by a lot of potassium, which is not the case in the corral at Krasnyi Yar.

The corral soils also had low nitrogen concentrations, says Capo, reducing the likelihood that the phosphorus came from more recent manure. "That's good, actually," she said of the recently completed nitrogen analyses. "It suggests we've got old stuff."

Even more compelling will be if we find long-lived molecules of fat, or lipids, directly attributed to horse manure in the soils, says Olsen.

The latest results from Krasnyi Yar site will be on display Monday morning, 23 October, at the Annual Meeting of the Geological Society of America in Philadelphia.

Early as the Botai were, they were probably not the first to domesticate horses, says Olsen. "The very first horse domestication was probably a bit earlier in Ukraine or western Russia," she said. "Then some horse-herders migrated east to Kazakhstan."

Horses allowed the Botai to build large perennial villages with, in one case, hundreds of homes. They did so without the benefit of agriculture, Olsen explained, as theirs was a horse economy.

The Botai were able to stay put year-round because horses are very well adapted to cold winters, she said. "Horses can survive ice storms and don't need heated barns or winter fodder," Olsen said. They are, in fact, some of the last remaining large, Ice Age, Pleistocene mammals living in one of the last places on Earth where Pleistocene vegetation survives.

Because they were domesticated, the horses supplied meat year-round and vitamin-rich mare's milk from spring through fall. "No one in their right mind would try to milk a wild mare," said Olsen.

There is also evidence that the Botai were carrying a lot of heavy material, like rocks and large skulls, over long distances. That is a lot more practical and explicable if they used pack horses.

Later people of the same region adopted shepherding and cattle raising, said Olsen. That created a more nomadic culture, since sheep and cattle are not well suited for sub-zero climates and therefore needed to be taken south in winter. The tradeoff, she says, was that cows and sheep give far fattier milk year round, which can be made into yogurt and cheese. Sheep also provide wool.

Kazakh people today still eat horsemeat. They were forced to abandon their nomadic lifestyle during the Soviet era and have returned to small village pastoralism, Olsen says.

October 22, 2006

IQ of Serbian Gypsies

Intelligence (Article in Press)

General mental ability in South Asians: Data from three Roma (Gypsy) communities in Serbia

J. Philippe Rushton et al.

Abstract

To examine whether the Roma (Gypsy) population of Serbia, like other South Asian population groups, average lower than Europeans on g, the general factor of intelligence, we tested 323 16- to 66-year-olds (111 males; 212 females) in three different communities over a two-year-period on the Raven's Colored and/or Standard Progressive Matrices and four measures of executive function. Out of the total of 60 Matrices, the Roma solved an average of 29, placing them at the 3rd percentile on 1993 U.S. norms, yielding an IQ equivalent of 70. On the executive function tests, the Roma averaged at about the level of Serbian 10-year-olds. The Matrices showed a small mean sex difference favoring males. External validity was demonstrated by correlating the scores on Matrices with measures such as cranial capacity (r = 0.13, P < 0.01), spousal similarity (r = 0.17, P < 0.05), age at birth of first child (r = 0.26, P < 0.01), number of offspring (r = − 0.20, P < 0.01), and responsible social attitudes (r = 0.10, P < 0.05). Comparisons with extant data showed that items found difficult or easy by the Roma were those found difficult or easy by White, Indian, Colored, and Black South African 14- to 16-year-olds and by Black South African undergraduates (rs = 0.90). There was no evidence of any idiosyncratic cultural effect. Instead, Roma/non-Roma differences were found to be most pronounced on g. This was shown by item-total correlations (estimates of the item's g loading), which predicted the magnitude of Roma/non-Roma differences on those same items, regardless of from which sample the item-total correlations were calculated, and by confirmatory factor analysis. The results indicate the remarkable cross-cultural generalizability of item properties across South Asians, Europeans, and sub-Saharan Africans and that these reflect g more than culturally specific ways of thinking.

Link

October 20, 2006

Skin tone and attractiveness

This study seems to echo the results of a different German study which I posted a few years ago. According to the older study:
Additional surveys showed that attractive female faces are narrower than unattractive ones, and that they possess a brown skin and full, well looked-after lips.
According to the new study:
Results show an overall main effect of skin tone, suggesting that light brown skin color is perceived by both Caucasian and African American models as more credible and attractive than models who are pale and dark skinned, F(2,71) = 14.7, p < .0001. Consistent with earlier theorizing, images of light brown models yielded more favorable responses than images featuring dark skinned or pale models, F = 18.70, p < .01. Consistent with the proposed relationships stated in hypothesis 1, when the participants were asked to evaluate an individual on the basis of physical attractiveness and credibility, participants in this study found light brown models more credible and more attractive than their counterparts with darker skin.
Facial plast Surg 2006; 22: 175-179

“Shades of Beauty”: Examining the Relationship of Skin Color to Perceptions of Physical Attractiveness

Cynthia M. Frisby

ABSTRACT

The purpose of this research project was to investigate the relationship between skin color and level of perceived physical attractiveness. Previous research suggested that skin color plays an important role in how we perceive an individual's physical attractiveness. The current study was conducted to determine how influential the role of race is on perceptions of physical attractiveness. In this study, 79 subjects were asked to evaluate images of potential endorsers to be used in an upcoming advertising campaign. The images were those of females of varying skin tones. Data were then collected and analyzed to determine whether skin tone and level of skin color can in fact influence the physical attractiveness stereotype.

Link

October 19, 2006

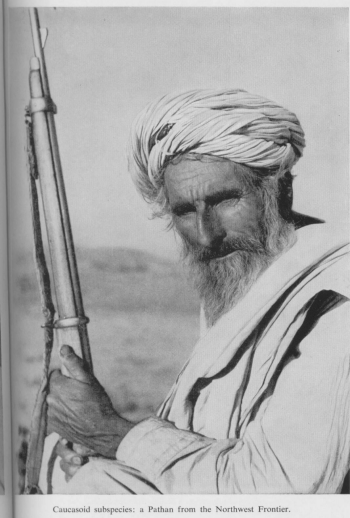
Greek origins of some Pathans but not other Pakistanis


A new article in European Journal of Human Genetics investigates the Greek ancestry of Pakistani populations that sometimes claim descent from Alexander the Great's troops. In previous studies (use search on the right) it was demonstrated that these claims are mostly false, since modern Pakistanis mostly lack haplogroup E3b chromosomes that are found often in Greece.

The new study shows that among the Pakistani populations, only the Pathans seem to be closer to the Greeks, and not the pagan Kalash and the Burusho. Unfortunately, claims about the Hellenicity of the Kalash seem to persist despite the genetic evidence that has accumulated over the years.

Moreover, the similarity between the Pathans and the Greeks is not accidental. An argument for the real contribution of Greeks to the Pathan population is the discovery of specific haplotypes within haplogroup E3b1 that seem to be of Greek-Balkan origin and which are found only in the Pathans among the Pakistani populations.
Compelling evidence in support of the genetic relationship between the Pathan and Greek E3b1 Y chromosomes was provided by the median-joining network (Figure 4). One Pathan shared a Y-STR haplotype, that included a duplication of 10 and 13 repeat units for the DYS425 locus, with three Greek individuals and the other was separated from this cluster by a single mutation, which enabled us to estimate the TMRCA (mean+/-SD) using the Network software as between 2000+/-400 and 5000+/-1200 YBP depending upon the observed26 or inferred mutation rates,27 respectively. This coincides with the period of Alexander's invasion during 327–323 BC. This haplotype was not observed in any other E3b1-derived Pakistani Y chromosome but was highly specific for the Balkans – the highest frequency being in Macedonia.
European Journal of Human Genetics (advance online publication)

Y-chromosomal evidence for a limited Greek contribution to the Pathan population of Pakistan

Sadaf Firasat et al.

Three Pakistani populations residing in northern Pakistan, the Burusho, Kalash and Pathan claim descent from Greek soldiers associated with Alexander's invasion of southwest Asia. Earlier studies have excluded a substantial Greek genetic input into these populations, but left open the question of a smaller contribution. We have now typed 90 binary polymorphisms and 16 multiallelic, short-tandem-repeat (STR) loci mapping to the male-specific portion of the human Y chromosome in 952 males, including 77 Greeks in order to re-investigate this question. In pairwise comparisons between the Greeks and the three Pakistani populations using genetic distance measures sensitive to recent events, the lowest distances were observed between the Greeks and the Pathans. Clade E3b1 lineages, which were frequent in the Greeks but not in Pakistan, were nevertheless observed in two Pathan individuals, one of whom shared a 16 Y-STR haplotype with the Greeks. The worldwide distribution of a shortened (9 Y-STR) version of this haplotype, determined from database information, was concentrated in Macedonia and Greece, suggesting an origin there. Although based on only a few unrelated descendants, this provides strong evidence for a European origin for a small proportion of the Pathan Y chromosomes.

Link

October 18, 2006

Human species 'may split in two'

BBC reports:
Humanity may split into two sub-species in 100,000 years' time as predicted by HG Wells, an expert has said.

Evolutionary theorist Oliver Curry of the London School of Economics expects a genetic upper class and a dim-witted underclass to emerge.

The human race would peak in the year 3000, he said - before a decline due to dependence on technology.

People would become choosier about their sexual partners, causing humanity to divide into sub-species, he added.
The idea that human evolution can be predicted across thousand-year time scales is pretty hard to swallow.

October 17, 2006

Hereditary facial expressions

Via the BBC and Scientific American and New Scientist. This idea makes sense:
Peleg speculates that genes might influence the muscle and nerve structure in the face. This, in turn, would create biological constraints that make facial expressions more similar among relatives.