- A set of Indonesian populations (ID prefix; Lamaholot, Lembata, Kambera, Manggarai) are mixed with Melanesians (AX-ME)
- A set of Indian populations appear admixed (IN prefix). It seems that the Okinawan sample acts as a surrogate for "Asian" ancestry
- Filipino populations PI-UI and PI-UN (listed as Visaya, Chabakano and Tagalog) are seen as mixtures of Okinawans and PI-UB (Ilocano)
- The three Singaporean populations (SG prefix) are seen as mixtures with Caucasoids (the SG-ID Tamil Indians with CEU), with Sunda Indonesians (SG-ML Malay with ID-SU), with Zhuang Chinese (SG-CH Singaporean Chinese with CN-CC Zhuang, northern)
- Tai Yuan from Thailand with Mlabri (TH-TU with TH-MA)
- Taiwanese (Hakka TW-HA and Minnan TW-HB) with CN-CC (Zhuang) and Jiamao (CN-JI)
- Cantonese CN-GA with Jiamao (CN-JI)
- Uygur CN-UG with West Eurasians (CEU)
November 08, 2012
Okinawans and admixture in East Asia
December 29, 2011
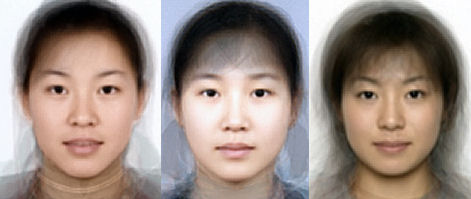
Chinese, Korean, Japanese (genetic edition)
As I was going through the list of the Dodecad populations, I realized that there are 5+ participants in each of the Korean, Japanese, and Chinese groups. So, it seemed like a simple exercise to see whether the relatively high success rate of people's guesses could be corroborated using the DNA data.
Below is the MDS plot; there are 9 Chinese, 5 Japanese, 5 Koreans in the Dodecad Project; I have also added 30 HapMap Chinese (CHB) and Japanese (JPT):
Only the first MDS dimension showed deviation from normality according to a Shapiro-Wilk test. Using MCLUST, that dimension was enough (as can be seen from the above figure) to infer the presence of 3 clusters which corresponded to the 3 groups, with 100% correct assignments.
Interestingly, when I did not use the extra HapMap individuals, MCLUST did not split Koreans from Chinese. This goes to show that the absence of apparent structure does not imply absence of structure. The extra Chinese and Japanese individuals helped flesh out the existing structure in these East Asian groups.
Below is the list of the Dodecad populations that are below the 5-individual limit:
| Algerian_D | 4 | East_African_Various_D | 3 | Greek_Italian_D | 2 | Belgian_D | 1 | |||
| North_African_Jews_D | 4 | Danish_D | 3 | Swiss_German_D | 2 | Latvian_D | 1 | |||
| Slovenian_D | 4 | Tunisian_D | 3 | Szekler_D | 2 | Estonian_D | 1 | |||
| Mixed_Scandinavian_D | 4 | Austrian_D | 3 | Mandaean_D | 2 | Bangladesh_D | 1 | |||
| Moroccan_D | 4 | Saudi_D | 3 | Azeri_D | 2 | Yemenese_D | 1 | |||
| Serb_D | 4 | Pakistani_D | 3 | Czech_D | 2 | Sri_Lanka_D | 1 | |||
| Tatar_Various_D | 3 | Georgian_D | 2 | Hungarian_D | 1 | |||||
| Palestinian_D | 3 | Kazakh_D | 2 | Basque_D | 1 | |||||
| Romanian_D | 3 | Udmurt_D | 1 | |||||||
| Ukrainian_D | 1 | |||||||||
| Egyptian_D | 1 |
If you belong to one of the above groups (all 4 grandparents) and have tested with either 23andMe or Family Finder, you are especially invited to contact me at dodecad@gmail.com (but do not send data right away!), about possible inclusion in the project.
For example, in the most recent Clusters Galore analysis, there was a generic "Balkan" cluster. Does this imply that Balkan ethnic groups cannot be distinguished from each other, or that sample sizes are simply not yet sufficient to make manifest the existing structure?
May 24, 2011
The reality of the Altaic language family
Personally I'm not surprised by this; my own look at genomic data has identified an "Altaic" component which peaks at the Turkic Yakut and Tungusic Evenk, and is shared by every Turkic, Mongolic, and Tungusic population available to me. The same component also occurs to some extent among all the Japanese (5) and Korean (4) members of the Dodecad Project, while it is lacking in all the Chinese ones (8).
Of particular interest is the degree of CCM between Indo-European and Semitic languages (Tables 2 and 3). In many of the most geographically distant languages these are less than 10; by comparison, among Semitic languages the are all greater than 20. This seems to be quite in agreement with the idea that Semitic is a Bronze Age language family, Indo-European a Neolithic one.
Journal of Language Relationship • Вопросы языкового родства • 3 (2010) • Pp. 117–126 • © Turchin P., Peiros I., Gell-Mann M., 2010
Ilia Peiros (Santa Fe Institute)
Murray Gell-Mann (Santa Fe Institute)
Link (pdf)
May 05, 2011
Dating the origin of Japanese languages with Bayesian phylogenetics
One more success story in the application of Bayesian phylogenetics to language studies. As Nicholas Wade reports:Researchers studying the various dialects of Japanese have concluded that all are descended from a founding language taken to the Japanese islands about 2,200 years ago. The finding sheds new light on the origin of the Japanese people, suggesting that their language is descended from that of the rice-growing farmers who arrived in Japan from the Korean Peninsula, and not from the hunter-gatherers who first inhabited the islands some 30,000 years ago.
I think it's absolutely fascinating how closely the authors' date for Japonic languages corresponds to the Yayoi period. The Quentin & Atkinson way of doing language age estimation was initially met with derision by the linguistic establishment: part of it was that they did not understand it, part of it that it was introduced with a very controversial topic (Indo-European), and part of it that it triggered a deep-seated skepticism against the application of biologically-inspired methods to the study of culture.
Fortunately, recent progresses in phylogenetic methods and their application in studying languages were found to provide adequate solutions for these problems [6]. Accumulating empirical evidence suggests that languages have, astonishingly, gene-like properties in numerous aspects and they also evolve by a process of descent with modification (for review, see [7]). This implies that once the shared innovations among languages are revealed by converting linguistic signals (i.e. presence or absence of homologous words) into discrete binary characters, various stochastic phylogenetic techniques for modelling biological evolution can be used to adequately reconstruct the history of language evolution. During the last decade, therefore, these techniques were quickly adopted to critically examine, and subsequently corroborate, instances of farming/language co-dispersal for Bantu [8], Indo-European [9] and Austronesian speakers [10].

What I find fascinating is the widely different manifestations of the farming/language dispersal phenomenon: the earliest attested one is the expansion of Indo-European languages from Asia Minor ~9,000 years ago, and the latest one the expansion of Japonic languages from mainland Asia ~2,400 years ago. Bantu, Austronesian, Semitic languages fill the void between these two dates. The law-like regularity with which farmers fill lands, transform the landscape, grow in numbers, and start diverging linguistically as they do so is a rare instance of mathematical regularity manifesting itself in the recent history of our species.

But, lest we get too much carried away by admiration for the farming phenomenon, let's tip our sugegasa to the Jomon hunter-gatherers of Japan, who were the partial ancestors of the modern Japanese people, and whose genetic legacy is best preserved among the Ainu (left). Again, from the paper:
If our results are correct, one surprising aspect of prehistoric Japan becomes apparent; the hunter–gatherer population, which settled in Japan around 12 000–30 000 YBP, managed to fend off the farmers for thousands of years until being abolished suddenly and dramatically with the arrival of proto-Japonic-speaking farmers around 2400 YBP. To place this in perspective, it should be noted that the hunter–gatherer societies and their languages in Europe began to be abolished by those of the farmers as early as 8500 YBP [9]. Even some of Japan's closest neighbours such as China had started agriculture since 9000 YBP [1], which progressively brought about fully fledged kingdoms equipped with metal tools fighting each other for political unification. During all this transition outside, the hunter–gatherers of Japan continued to prosper by using simple stone tools and without adopting full-scale agriculture, despite knowledge of cultivation of many crops [12]. There are probably two reasons that explain their unusually long survival. First, the population size of the hunter–gatherers may have been too large to be invaded by nearby farmers. The hunter–gatherer of Japan was perhaps one of the most affluent hunter–gatherers known to humankind, endowed with a large range of plants, animals and sea foods [46]. This vast availability of food resources is probably related to the fact that the world's oldest known pottery was made by the hunter–gatherers of Japan [47]. The development of pottery meant that unlike other hunter–gatherers around the world, they had a means to cook and store the foods that were available abundantly in their environment, and such could have triggered a population explosion to the extent that it prevented the farmers asserting any force over the hunter–gatherers for a long time. The second reason behind their long survival could be that it probably took a few thousand years for the farmers to modify rice, one of their main food sources, to grow in cold climate [48]. The archaeological evidence suggest it was not until around 3500 YBP that rice farming of warm southern China spread to the much colder Korean Peninsular [49], which is thought to be the most recent homeland of proto-Japonic-speaking farmers. A combination of these two factors might have contributed to the unusually long occupation of the hunter–gatherers in Japan.
Proceedings of the Royal Society B doi: 10.1098/rspb.2011.0518
Bayesian phylogenetic analysis supports an agricultural origin of Japonic languages
Sean Lee and Toshikazu Hasegawa
Languages, like genes, evolve by a process of descent with modification. This striking similarity between biological and linguistic evolution allows us to apply phylogenetic methods to explore how languages, as well as the people who speak them, are related to one another through evolutionary history. Language phylogenies constructed with lexical data have so far revealed population expansions of Austronesian, Indo-European and Bantu speakers. However, how robustly a phylogenetic approach can chart the history of language evolution and what language phylogenies reveal about human prehistory must be investigated more thoroughly on a global scale. Here we report a phylogeny of 59 Japonic languages and dialects. We used this phylogeny to estimate time depth of its root and compared it with the time suggested by an agricultural expansion scenario for Japanese origin. In agreement with the scenario, our results indicate that Japonic languages descended from a common ancestor approximately 2182 years ago. Together with archaeological and biological evidence, our results suggest that the first farmers of Japan had a profound impact on the origins of both people and languages. On a broader level, our results are consistent with a theory that agricultural expansion is the principal factor for shaping global linguistic diversity.
Link
July 31, 2010
Koreans in genomic context (Jung et al. 2010)
A total of 320 subjects from 24 regional groups were analyzed in this study. They include Yoruba (YRI), European (CEU), Japanese (JPT), Chinese (CHB), Amerindians (AI), and several population groups from Southern and Northern Asia comprising Chinese from the Jilin area (JL), Vietnamese (VN), Cambodians (CB), Mongolians (MH), and Koreans from ten cities in South Korea
Table 1 has complete sample codes, including those for different Korean cities.

The MDS plot is shown on the left. Of interest is the Asian-specific one (right), which shows Vietnamese-Cambodians on the bottom, Mongolians on the top-left, Koreans-Japanese on top and Chinese close to them but towards the Vietnamese-Cambodian direction. Not very surprising as Koreans are basically north Mongoloid, Japanese have origins in the Korean peninsula, while Chinese are both north and south in origin.
The STRUCTURE analysis is also quite interesting: see top row which is the Korean-Chinese-Japanese only admixture analysis: clear Chinese- (green), Japanese- (red), and Korean- (yellow) centered clusters emerge, paralleling what our eyes tell us about the distinctiveness of these three ethnic groups. Notice, however, sample JJ (Jeju island) which lacks Korean yellow (K=4).In addition, genetic structure analysis using the STRUCTURE method revealed the existence of five major populations, African, Caucasian, Amerindian, North-East Asian, and Southern Asian. Therefore, in between, there were significant admixtures such as Mongolian with Caucasian, Vietnamese (or Cambodian) with unknown Southern original settlers, and Amerindians with both North-East Asians and Caucasians (Fig. 2).I have commented before on all these admixtures, so let's summarize: Mongolia represents the eastern limit of the Caucasoid expansion, where a small Caucasoid component exists in a predominantly Mongoloid population; Southeast Asians represent a fusion of Mongoloids with "Australoid"-like indigenous populations of the tropical belt from South Asia to Micronesia; Amerindians are partially admixed with Europeans, and partially admixed with NE Asians; the latter component is marked, perhaps, by Y-chromosome haplogroup C3, and may correspondto the second wave of expansion into the Americas.
Gene Flow between the Korean Peninsula and Its Neighboring Countries
Jongsun Jung et al.
SNP markers provide the primary data for population structure analysis. In this study, we employed whole-genome autosomal SNPs as a marker set (54,836 SNP markers) and tested their possible effects on genetic ancestry using 320 subjects covering 24 regional groups including Northern ( = 16) and Southern ( = 3) Asians, Amerindians ( = 1), and four HapMap populations (YRI, CEU, JPT, and CHB). Additionally, we evaluated the effectiveness and robustness of 50K autosomal SNPs with various clustering methods, along with their dependencies on recombination hotspots (RH), linkage disequilibrium (LD), missing calls and regional specific markers. The RH- and LD-free multi-dimensional scaling (MDS) method showed a broad picture of human migration from Africa to North-East Asia on our genome map, supporting results from previous haploid DNA studies. Of the Asian groups, the East Asian group showed greater differentiation than the Northern and Southern Asian groups with respect to Fst statistics. By extension, the analysis of monomorphic markers implied that nine out of ten historical regions in South Korea, and Tokyo in Japan, showed signs of genetic drift caused by the later settlement of East Asia (South Korea, Japan and China), while Gyeongju in South East Korea showed signs of the earliest settlement in East Asia. In the genome map, the gene flow to the Korean Peninsula from its neighboring countries indicated that some genetic signals from Northern populations such as the Siberians and Mongolians still remain in the South East and West regions, while few signals remain from the early Southern lineages.
Link
March 26, 2010
Ancient DNA from Korean mummies
A genetic investigation of Korean mummies from the Joseon Dynasty.
Kim NY, Lee HY, Park MJ, Yang WI, Shin KJ.
Two Korean mummies (Danwoong-mirra and Yoon-mirra) found in medieval tombs in the central region of the Korean peninsula were genetically investigated by analysis of mitochondrial DNA (mtDNA), Y-chromosomal short tandem repeat (Y-STR) and the ABO gene. Danwoong-mirra is a male child mummy and Yoon-mirra is a pregnant female mummy, dating back about 550 and 450 years, respectively. DNA was extracted from soft tissues or bones. mtDNA, Y-STR and the ABO gene were amplified using a small size amplicon strategy and were analyzed according to the criteria of ancient DNA analysis to ensure that authentic DNA typing results were obtained from these ancient samples. Analysis of mtDNA hypervariable region sequence and coding region single nucleotide polymorphism (SNP) information revealed that Danwoong-mirra and Yoon-mirra belong to the East Asian mtDNA haplogroups D4 and M7c, respectively. The Y-STRs were analyzed in the male child mummy (Danwoong-mirra) using the AmpFlSTR((R)) Yfiler(TM) PCR Amplification Kit and an in-house Y-miniplex plus system, and could be characterized in 4 loci with small amplicon size. The analysis of ABO gene SNPs using multiplex single base extension methods revealed that the ABO blood types of Danwoong-mirra and Yoon-mirra are AO01 and AB, respectively. The small size amplicon strategy and the authentication process in the present study will be effectively applicable to future genetic analyses of various forensic and ancient samples.
Link
March 08, 2010
Genome-Wide Genotyping of Pooled Samples to assess genetic ancestry (Chiang et al. 2010)
On the left: genetic differentiation between Chinese and Japanese using 420 Ancestry Informative Markers vs. 420 random SNPs. Note that the "fuzzy" picture on B would be better resolved if a larger number of SNPs had been used.PLoS Genetics doi:10.1371/journal.pgen.1000866
Rapid Assessment of Genetic Ancestry in Populations of Unknown Origin by Genome-Wide Genotyping of Pooled Samples
Charleston W. K. Chiang et al.
Abstract
As we move forward from the current generation of genome-wide association (GWA) studies, additional cohorts of different ancestries will be studied to increase power, fine map association signals, and generalize association results to additional populations. Knowledge of genetic ancestry as well as population substructure will become increasingly important for GWA studies in populations of unknown ancestry. Here we propose genotyping pooled DNA samples using genome-wide SNP arrays as a viable option to efficiently and inexpensively estimate admixture proportion and identify ancestry informative markers (AIMs) in populations of unknown origin. We constructed DNA pools from African American, Native Hawaiian, Latina, and Jamaican samples and genotyped them using the Affymetrix 6.0 array. Aided by individual genotype data from the African American cohort, we established quality control filters to remove poorly performing SNPs and estimated allele frequencies for the remaining SNPs in each panel. We then applied a regression-based method to estimate the proportion of admixture in each cohort using the allele frequencies estimated from pooling and populations from the International HapMap Consortium as reference panels, and identified AIMs unique to each population. In this study, we demonstrated that genotyping pooled DNA samples yields estimates of admixture proportion that are both consistent with our knowledge of population history and similar to those obtained by genotyping known AIMs. Furthermore, through validation by individual genotyping, we demonstrated that pooling is quite effective for identifying SNPs with large allele frequency differences (i.e., AIMs) and that these AIMs are able to differentiate two closely related populations (HapMap JPT and CHB).
Link
August 20, 2009
Male-female differences in craniofacial dimensions of Koreans
Female-to-male proportions of the head and face in Koreans.
Song WC, Kim JI, Kim SH, Shin DH, Hu KS, Kim HJ, Lee JY, Koh KS.
It is well known that the head and face are smaller in female subjects than in male subjects. However, almost all previous studies have quantified the size difference between female and male subjects as simple numerical values, which might not clarify the difference. The present study evaluated the female-to-male proportions of the head and face so as to clarify the sex-related differences. A total of 1939 female subjects and 1398 male subjects were divided into 3 age groups: young (20-39 y), middle-aged (40-59 y), and elderly (60-79 y). The dimensions were classified into 3 categories: 5 cephalic, 3 frontal facial, and 6 lateral facial. The female-to-male proportions of individual dimensions were compared in the 3 age groups using the following formula: female measurement value x 100/(mean of male measurement value). The female-to-male proportions of the cephalic dimension increased with age, with the female cephalic dimensions overall being about 96% of the male cephalic dimensions. The female-to-male proportions of the frontal facial dimension were constant across the age groups, with the female frontal facial dimensions overall being 95% of the male frontal facial dimensions. The female lateral facial dimension increased markedly from the young to middle-aged group and was constant or decreased slightly from the middle-aged to the elderly group. Overall, the female lateral facial dimensions were approximately 97% of the male lateral facial dimensions. The present study will suggest a new approach to elucidate those sex-related dimensional differences that are characteristic of female and male subjects.
Link
July 10, 2009
Annotated Korean genomic sequence
Nature doi:10.1038/nature08211
A highly annotated whole-genome sequence of a Korean individual
Jong-Il Kim et al.
Abstract
Recent advances in sequencing technologies have initiated an era of personal genome sequences. To date, human genome sequences have been reported for individuals with ancestry in three distinct geographical regions: a Yoruba African, two individuals of northwest European origin, and a person from China1, 2, 3, 4. Here we provide a highly annotated, whole-genome sequence for a Korean individual, known as AK1. The genome of AK1 was determined by an exacting, combined approach that included whole-genome shotgun sequencing (27.8times coverage), targeted bacterial artificial chromosome sequencing, and high-resolution comparative genomic hybridization using custom microarrays featuring more than 24 million probes. Alignment to the NCBI reference, a composite of several ethnic clades5, 6, disclosed nearly 3.45 million single nucleotide polymorphisms (SNPs), including 10,162 non-synonymous SNPs, and 170,202 deletion or insertion polymorphisms (indels). SNP and indel densities were strongly correlated genome-wide. Applying very conservative criteria yielded highly reliable copy number variants for clinical considerations. Potential medical phenotypes were annotated for non-synonymous SNPs, coding domain indels, and structural variants. The integration of several human whole-genome sequences derived from several ethnic groups will assist in understanding genetic ancestry, migration patterns and population bottlenecks.
Link
May 27, 2009
The first Korean genome
In addition, the comparison of indels between SJK and YH (Table 4) showed that the two genomes shared the same type of indels by 99.5% on the same genomic loci (SJK and HuRef shared 86.2%, SJK and Watson shared 87.8%, SJK and NA18507 shared 93.6%).
So -based on indels- the Korean and Chinese individuals are ~24 times less distant to each other than the Korean is to James Watson (a European descendant) and ~13 times less distant to each other than the Korean was to NA18507 (a Nigerian). Table 4 in the paper has all the detailed numbers.
Figure 2 shows the overlap -number of SNPs- between various full genomes available.

Consider (E): 1.2 million SNPs are shared by the Korean and Venter/Watson; ~0.5 million are shared by the Korean and Venter (but not Watson) and the Korean and Watson (but not Venter), i.e., they transcend racial lines.
But, another ~0.5 million is shared by Venter and Watson, but not the Korean. A subset of these may be shared by accident for these three individuals (i.e., another Korean might also possess some of them). Another subset may be shared by Venter and Watson and most other Caucasoids; another subset may be shared by Venter and Watson, presumably due to their common Western European ancestry (or shared other minor ancestry), and so on.
As we sample more full genomes, we will be able to zero in on the pan-human SNPs, which represent shared human genetic diversity, as well as SNPs limited to races, subraces, ethnic groups, regions, ..., individuals.
This is an open access paper, so you can read it for yourselves.
Genome Research doi:10.1101/gr.092197.109
The first Korean genome sequence and analysis: Full genome sequencing for a socio-ethnic group
Sung-Min Ahn et al.
Abstract
We present the first Korean individual genome sequence (SJK) and analysis results. The diploid genome of a Korean male was sequenced to 28.95-fold redundancy using the Illumina paired-end sequencing method. SJK covered 99.9% of the NCBI human reference genome. We identified 420,083 novel SNPs that are not in the dbSNP database. Despite a close similarity, significant differences were observed between the Chinese genome (YH), the only other Asian genome available, and SJK: 1) 39.87% (1,371,239 out of 3,439,107) SNPs were SJK-specific (49.51% against Venter's, 46.94% against Watson's, and 44.17% against the Yoruba genomes), 2) 99.5% (22,495 out of 22,605) of short indels (less than 4 bp) discovered on the same loci had the same size and type as YH, and 3) 11.3% (331 out of 2920) deletion structural variants were SJK-specific. Even after attempting to map unmapped reads of SJK to unanchored NCBI scaffolds, HGSV, and available personal genomes, there were still 5.77% SJK reads that could not be mapped. All these findings indicate that the overall genetic differences among individuals from closely related ethnic groups may be significant. Hence, constructing reference genomes for minor socio-ethnic groups will be useful for massive individual genome sequencing.
January 16, 2009
Y chromosomes and mtDNA of Koreans
Table 5 has admixture estimates of NE and SE Asians in Korean populations; notice the gender asymmetry, with males of more southern origin than females.
Table S3 (Excel) has Y-chromosome haplogroup frequencies.
From the paper:
What could be the origin of the male-biased southern contribution to Korean gene pool illustrated, for example, by haplogroups O-M122 (42.2%) and O-SRY465 (20.1%) [29]. Recent molecular genetic analyses and the geographical distribution of haplogroup O-M122 lineages, found widely throughout East Asia at high frequencies (especially in southern populations and China), have suggested a link between these Y-chromosome expansions and the spread of rice agriculture in East Asia [62]–[64]. In general, Y-chromosomes might be spread via a process of demic diffusion during the early agricultural expansion period [65], [66]. If this interpretation were substantiated, the spatial pattern of Y-haplogroup O would imply a genetic contribution to Korea through the spread of male-mediated agriculture.
PLoS ONE 10.1371/journal.pone.0004210
The Peopling of Korea Revealed by Analyses of Mitochondrial DNA and Y-Chromosomal Markers
Han-Jun Jin, Chris Tyler-Smith, Wook Kim
Abstract
Background
The Koreans are generally considered a northeast Asian group because of their geographical location. However, recent findings from Y chromosome studies showed that the Korean population contains lineages from both southern and northern parts of East Asia. To understand the genetic history and relationships of Korea more fully, additional data and analyses are necessary.
Methodology and Results
We analyzed mitochondrial DNA (mtDNA) sequence variation in the hypervariable segments I and II (HVS-I and HVS-II) and haplogroup-specific mutations in coding regions in 445 individuals from seven east Asian populations (Korean, Korean-Chinese, Mongolian, Manchurian, Han (Beijing), Vietnamese and Thais). In addition, published mtDNA haplogroup data (N = 3307), mtDNA HVS-I sequences (N = 2313), Y chromosome haplogroup data (N = 1697) and Y chromosome STR data (N = 2713) were analyzed to elucidate the genetic structure of East Asian populations. All the mtDNA profiles studied here were classified into subsets of haplogroups common in East Asia, with just two exceptions. In general, the Korean mtDNA profiles revealed similarities to other northeastern Asian populations through analysis of individual haplogroup distributions, genetic distances between populations or an analysis of molecular variance, although a minor southern contribution was also suggested. Reanalysis of Y-chromosomal data confirmed both the overall similarity to other northeastern populations, and also a larger paternal contribution from southeastern populations.
Conclusion
The present work provides evidence that peopling of Korea can be seen as a complex process, interpreted as an early northern Asian settlement with at least one subsequent male-biased southern-to-northern migration, possibly associated with the spread of rice agriculture.
Link
November 27, 2008
Korean-Japanese anthropometric differences

We are able to show that average Korean head and face shapes differ significantly from Japanese head and face shapes. Koreans have higher BMI than Japanese, and Korean males and females have the same BMI, but the BMI has higher coefficients for males than for females in Japanese.
...
Japanese have a longer head and a larger head length. Nose breadth and mouth breadth of Japanese are larger than those for Koreans, and Japanese have a wider distance between the pupils of the eyes.
...Only ORT, OLT and BMI for Korean male subjects were larger than those for Japanese male subjects; the other Japanese items (weight, TH, RTV, LTV, REV, LEV, SVH, MFH, HL, ORE, OLE, OS, HB, BB, BA, NH, NB, MB, and ID) were higher than those for Koreans. The MB values, in particular, showed the largest difference between Korean and Japanese male subjects.
In the comparison of Korean and Japanese female head and face dimensions, almost all item values show statistically significant differences between the Korean [End Page 325] and Japanese groups, except in the categories of height, HC, ORE, and OLE. HC did not show statistically significant differences between the two female subject groups. Weight, BMI, OS, ORT, OLT, BB, HC, SA, and BIGB for Korean females were larger than those values for Japanese females.
Human Biology Volume 80, Number 3
Comparison of Korean and Japanese Head and Face Anthropometric Characteristics
Hyun-Ja Lee, Se-Jin Park
Abstract
The primary purpose of this research is to collate, compare, and discuss the presently available data for head and face dimensions among Korean and Japanese ethnic groups. Classification of Korean male and female head and face types is simpler than classification of Japanese subjects. Male groups have more statistically significant morphological differences than females, and Japanese subjects display larger values for head and face measurement categories than Korean subjects. Japanese item values for head and face dimensions show distinct differences between male and female subjects compared to Korean subjects. Japanese male subjects have distinct differences from Korean male subjects and relatively lower values for head and face dimensions as age increases compared to Korean male subjects. Generally, female subjects have no regular tendency according to age compared to male subjects.
Link
mtDNA of Ancient Koreans
Genetic Characterization and Assessment of Authenticity of Ancient Korean Skeletal Remains
Hwan Young Lee et al.
Abstract
To study the maternal lineage history of Korea, we extracted DNA from the skeletal remains of 35 museum samples (some dating back to the Paleolithic Age) excavated from 11 local burial sites scattered throughout southern Korea. Mitochondrial DNA (mtDNA) control region sequences (HV1, HV2, and HV3) were successfully determined for 11 samples with no sharing of the control region polymorphisms with individuals involved in the laboratory analyses. Each of the 11 mtDNAs was assigned to the appropriate East Asian mtDNA haplogroup according to the haplogroup-specific control region mutation motif and diagnostic coding region single nucleotide polymorphism. The successful mtDNA haplogroup determination for each ancient Korean mtDNA and the confirmation of the absence of abnormal mutations based on the haplogroup-directed database comparisons indicates that there is no mosaic structure from cross-contamination or sample mix-up or other errors in our mtDNA sequences. The presence of haplogroups B, D, and G in the prehistoric age is consistent with the hypothesis that the early Korean population has a common origin in the northern regions of the Altai Mountains and Lake Baikal of southeastern Siberia. In addition, the modern Korean population, which possesses lineages from both southern and northern haplogroups, suggests additional gene flow from southern Asian haplogroups in recent times, but many more ancient samples need to be analyzed to directly tell whether there was regional continuity or replacement of early lineages by other lineages in ancient Korea.
Link
July 02, 2008
Waist-to-hip ratio of Miss Koreas
Anthropometric Analysis of Waist-to-Hip Ratio in Asian Women.
Hong YJ, Park HS, Lee ES, Suh YJ.
BACKGROUND: The universally accepted attractive female figure has a waist-to-hip ratio (WHR) of 0.7 or 0.68 (WHR of the Venus de Milo). Using WHR and other parameters, the authors attempted to investigate chronologic changes in perceptions of the attractive female figure in Korean society, differences between Asian and Western societies in this respect, and changes in attractiveness with respect to body mass index (BMI) and age in the general female Korean population. METHODS: The authors analyzed the anthropometric measurements of 227 Miss Korea winners between 1971 and 2007, 60 candidates of the 2007 Miss Korea contest, 36 candidates of the 2007 Miss France contest, and 1785 normal women in the general population. RESULTS: In the Miss Korea winners' group, the WHR tended toward 0.7. The WHR of the 2007 Miss Korea candidates was statistically smaller than the WHR of the 2007 Miss France candidates. The WHR of normal women was statistically larger than WHR of the 2000s Miss Korea winners. In all age groups of normal women, subjects with a low BMI were not significantly different from the 2000s Miss Koreas in terms of waist circumference, but they had a relatively larger hip circumference. Moreover, subjects with a normal BMI had waist circumferences that were similar to those of the 2000s Miss Koreas but relatively larger hip circumferences, and subjects with high BMI had larger waist and hip circumferences than the 2000s Miss Koreas. CONCLUSION: The perceived attractive female figure in Asia has moved toward the universally accepted ideal WHR. However, there were still some differences between Asian and Western societies in the concept of ideal body figure. Also, a significant difference in body contour was observed between normal women and the ideal figure. This is because hip volume decreases and waist volume increases with age, although waist and hip volumes increase with BMI.
Link
August 11, 2004
Korean-American Woman's Face
The Korean American Woman's Face : Anthropometric Measurements and Quantitative Analysis of Facial Aesthetics
Kyle S. Choe et al.
ABSTRACT
Objectives To assess the differences in facial proportions between Korean American (KA) women and North American white (NAW) women and to quantitatively describe aesthetic facial features in the KA women.
Design Anthropometric survey and facial aesthetic evaluation.
Participants Volunteer sample of KA women (n = 72) who served as models for part 1 of the study and a different sample of KA women (n = 5) and men (n = 5) who served as judges for part 2 of the study. All subjects were between ages 18 and 35 years and had Korean parents and no previous facial surgery or trauma.
Intervention For part 1 of the study, standardized and referenced frontal and lateral photographs were taken of the models, and 26 standard anthropometric measurements were determined. Results were compared with published NAW standards. For part 2 of the study, 10 judges evaluated frontal views of the models for facial aesthetics using a visual analog scale. Quantitative analysis was done of the faces of attractive KA women (>90th percentile in aesthetic scores) and comparisons were made with the faces of NAW women and average KA women.
Results The KA woman's face did not fit the neoclassical facial canons. Compared with NAW women, 24 of the 26 facial measurements in KA women were significantly different. Only 9 of the 26 facial measurements were significantly different when the attractive KA women were compared with the NAW women. Nine of the 17 nonsignificant facial measurements were very similar to those of the NAW women; many of these facial features centered around the midface.
Conclusions Although the average KA woman's facial anthropometric measurements were very different from those of the NAW woman, attractive KA women reflected many of the facial features of NAW women. These findings support the need for ethnically sensitive facial canons and further research into transcultural aesthetics.

Figure 1. Frontal (A), lateral (B), and basal (C) views of the average Korean American woman's face. ac indicates alar curvature point; al, alare; al', alar rim; c, highest point of the columella; ch, cheillion; en, endocanthion; ex, exocanthion; g, glabella; gn, gnathion; mf, maxillofrontale; n, nasion; prn, pronasale; sa, superaurale; sba, subaurale; sn, subnasale; tr, trichion; and zy, zygion.

Table 1. Comparison of Anthropometric Facial Measurements in Korean American and North American White Women