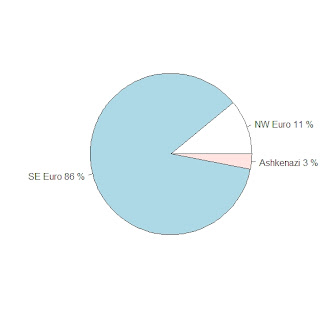
My first test was on the 8 Tuscan individuals of the Stanford dataset. Here are their individual admixture estimates (NW Euro, SE Euro, Ashkenazi Jewish)
| 9 | 72 | 19 |
| 24 | 70 | 6 |
| 25 | 75 | 0 |
| 3 | 97 | 0 |
| 0 | 100 | 0 |
| 0 | 100 | 0 |
| 16 | 84 | 0 |
| 13 | 87 | 0 |
The average results for the Tuscans are in the pie graph:

These results seem reasonable; at least we can conclude that EURO-DNA-CALC correctly guessed the Tuscans as Southeastern European individuals.

3 comments:
Thanks as usual for the useful info (and for using the Tuscan sample). Some NW admixture in Tuscany is to be expected. I have not read Price carefully, but I think he's using Italian Americans. If so, most Italian Americans are from the South (with perhaps only a few from the NE) but little from NW or Tuscany. As such, that sample should be closer to the Mediterranean. But the N was invaded by several celtic and germanic populations populations, and Tuscany too, so I would expect a positive NW.
The people were from Tuscany, which was never a source for Celts. They were limited to the extreme North Italy and for a limited time before the Roman's swept them away. The Celtic language is actually close to Italic besides, and likeliest source for the language came from the Southern Europe before moving into Central Europe and France and such.
Dienekes, what markers are they using for NW, SE and Jewish in this thing?
I was actually making a mistake when running the program. I am 23% NW and 77 SE. This is probably even more expected, as N Tuscany is at the border with N Italy.
Post a Comment