March 31, 2006

Cerebral cortex and IQ

A new Nature paper reports that intelligent children and adolescents exhibit a particular kind of development of their cerebral cortex. In early childhood their cortex tends to be thicker, but becomes thinner in late childhood and thereafter.

Nature 440, 676-679 (30 March 2006)

Intellectual ability and cortical development in children and adolescents

P. Shaw et al.

Children who are adept at any one of the three academic 'R's (reading, writing and arithmetic) tend to be good at the others, and grow into adults who are similarly skilled at diverse intellectually demanding activities1, 2, 3. Determining the neuroanatomical correlates of this relatively stable individual trait of general intelligence has proved difficult, particularly in the rapidly developing brains of children and adolescents. Here we demonstrate that the trajectory of change in the thickness of the cerebral cortex, rather than cortical thickness itself, is most closely related to level of intelligence. Using a longitudinal design, we find a marked developmental shift from a predominantly negative correlation between intelligence and cortical thickness in early childhood to a positive correlation in late childhood and beyond. Additionally, level of intelligence is associated with the trajectory of cortical development, primarily in frontal regions implicated in the maturation of intelligent activity4, 5. More intelligent children demonstrate a particularly plastic cortex, with an initial accelerated and prolonged phase of cortical increase, which yields to equally vigorous cortical thinning by early adolescence. This study indicates that the neuroanatomical expression of intelligence in children is dynamic.

Link

March 30, 2006

The FHM Top-16 composite woman

FHM US magazine has recently announced the results of its 100 sexiest women in the world 2006 poll. Below is an average of the top-16 women according to the readers of the magazine.


March 29, 2006

Palace of Telamonian Aias found in Salamis


Palace of Homer's hero rises out of the myths (The Times)

ARCHAEOLOGISTS claim to have unearthed the remains of the 3,500-year-old palace of Ajax, the warrior-king who according to Homer’s Iliad was one of the most revered fighters in the Trojan War.
Classicists hailed the discovery, made on a small Greek island, as evidence that the myths recounted by Homer in his epic poem were based on historical fact.

The ruins include a large palace, measuring about 750sq m (8,000sq ft), and believed to have been at least four storeys high with more than thirty rooms.


Yannos Lolos, the Greek archaeologist who made the discovery, said he was certain that he had come across the home of the Aiacid dynasty, a legendary line of kings mentioned in the Iliad and the Classical Greek tragedies. One of the kings, Ajax (or Aias), was described by Homer as a formidable fighter who, at one point in the Trojan campaign, held off the Trojans almost singlehandedly while his fellow Greek Achilles sulked in his tent because his slave-girl had been taken away from him.

The city of Troy is believed to have fallen about 1180BC — at about the same time, according to Mr Lolos, that the palace he has discovered was abandoned and left to crumble. Ajax, therefore, would have been the last king to have lived there before setting off on the ten-year Trojan expedition.

“This is one of the few cases in which a Mycenaean-era palace can be almost certainly attributed to a Homeric hero,” Mr Lolos said.

Fellow archaeologists said that they believed that the ruins were indeed those of a Mycenaean palace. Curtis Runnels, Professor of Archaeology at Boston University, said: “Mr Lolos has really delivered the goods.”

The Mycenaean ruins appear to be at the site where Homer records a fleet of ships setting out to take part in the war on Troy. The Iliad is believed to portray conditions at the close of the dominance of Mycenae, the prime Greek power of the second millennium BC.

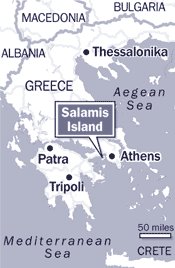
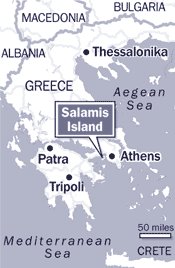
The ruins have been excavated over the past five years at a site near the village of Kanakia on the island of Salamis, a few miles off the coast of Athens.

The palace was built in the style of those of the period, including the vast acropolis at Mycenae.

“The complex was found beneath a virgin tract of pine woods on two heights by the coast,” Mr Lolos said. “All the finds so far corroborate what we see in the Homeric epics.”

Homer compares Ajax to a wall and describes him carrying a shield made of seven layers of thick oxhide. Unlike other heroes, he fights without the aid of deities or the supernatural. According to Sophocles, who wrote 800 years after the Trojan War, Ajax committed suicide after the fall of Troy without seeing his homeland again.

Several relics of oriental and Cypriot origin were found at the site at Kanakia, such as bronze armour strips stamped with the emblem of Pharaoh Rameses II of Egypt, indicating trade or possible war in the 13th century BC.

Salamis became famous as the site of a sea battle in 480BC in which the Greek navies destroyed the invasion fleet of the Persian king Xerxes and put paid to the Persian threat.

The other main site where archaeologists claim to have discovered relics of places recounted in the Iliad is at the castle of Pylos in southeastern Greece, believed to be the home of King Nestor.

March 28, 2006

Richard Lynn's speculations

Richard Lynn is back with more speculation about the origin of racial IQ differences. I will not dwell on his data, which should be taken with a heavy grain of salt. Rather, I will deal with his suggestions that racial IQ differences have something to do with cold winters during human evolution.

Lynn's speculations implicitly assume that IQ differences are of deep evolutionary origin. In other words, he assumes that Caucasoid-Mongoloid-Negroid aptitudes, as well as subracial cognitive distinctions (e.g., between Northcentral Europeans and Southeastern Europeans and Arctic vs. Far Eastern Mongoloids) date to the prehistoric period and accompanied racial differentiation.

Of course, this assumption is entirely unfounded. Indeed, increasingly, we are realizing that recent human evolutionary change, in post-Neolithic times was rapid, and the characteristics of populations were not already fixed (as the evolutionary psychologists hold) at the onset of the Neolithic, when racial differentiation was already in place.

But, the real problem is that there are only about 100 years of IQ data for some human populations and data of good quality (e.g., measured with culture-fair instruments) are at most 1-2 generations old. At the same time, it has been amply demonstrated that human IQ has been rising rapidly in several human populations even over the short time span for which IQ data exist, the so-called Flynn effect.

We thus know that (a) IQ is volatile, and can change rapidly, and (b) we have data that spans only perhaps 2% of human history.

The combination of these two factors renders any extrapolations from recent IQ data into the Stone Age or even a few centuries ago entirely unusable and untrustworthy. A good analogy would be someone's attempt to estimate the price of the IBM stock in 1935 by taking into account its value in the last year.

Richard Lynn must be commended for collecting and compiling such a volume of IQ data, but it's time to move beyond an early-20th century statistical understanding of human cognitive differences based on the reification of g and tackle the really hard problems of (a) figuring out whether individual racial ancestry predicts IQ, and (b) identifying some of the genes contributing to intelligence.

As I explain here, I see little hope of (b) occurring to any significant degree any time soon, but determining the racial (ancestral) contribution to IQ is wholly feasible. Let's hope that the race/IQ enthusiasts take up the challenge.

The changing shape of infant heads

Excerpt:

The normal head shape of American infants has changed from mildly dolichocephalic to mildly brachycephalic. Although normalcy is redefined, societal or parental expectations do not change immediately. Some parents become concerned, perceiving their infant’s head shape as abnormal. Although some parents may respond to reassurance, others search for solutions, such as head-molding helmets or more invasive options such as surgery.
Advances in Neonatal Care
Volume 5, Issue 6 , December 2005, Pages 329-340

Impacting Infant Head Shapes

Pat Hummel RNC, MA, NNP, PNP et al.

Abstract

Infant sleep position impacts the development of head shape. Changes in infant sleep position, specifically the movement toward supine sleep, have led to a redefinition of normal head shape for infants in the United States. Historically, a dolichocephalic (elongated) head shape was the norm. Currently the norm has changed to a more brachycephalic (shorter and broader) shape. Since the American Academy of Pediatrics’ Back to Sleep Campaign, the incidence of positional plagiocephaly has increased dramatically with a concurrent rise in the incidence of torticollis.

Infants who require newborn intensive care, particularly premature infants, are more prone to positional plagiocephaly and dolichocephaly. Both can be prevented or minimized by proper positioning. The infant with an abnormal head shape requires careful evaluation; treatment varies according to the etiology. Craniosynostosis, a less common but pathological etiology for plagiocephaly, should be considered in the diagnostic process. Successful treatment of positional plagiocephaly and dolichocephaly includes systematic positioning changes to overcome the mechanical forces of repetitive positioning, physical and/or occupational therapy to treat underlying muscle or developmental challenges, and in some cases, molding helmet therapy.

Link

Excerpt:
With the continued success of the “Back to Sleep Campaign,” infants will have a
more rounded head shape than cultures that previously put their infants to sleep
on their stomachs. The current normative CI is 86% to 88%, and it is relatively
rare to encounter a dolichocephalic infant in cultures whose infants sleep
supine.
The Journal of Pediatrics
Volume 146, Issue 2 , February 2005, Pages 253-257

Deformational brachycephaly in supine-sleeping infants
John M. Graham, Jr. MD, ScD

Objectives

Medical dictionaries and anthropologic sources define brachycephaly as a cranial index (CI = width divided by length × 100%) greater than 81%. We examine the impact of supine sleeping on CI and compare orthotic treatment with repositioning.

Study design

We compared the effect of repositioning versus helmet therapy on CI in 193 infants referred for abnormal head shape.

Results

Eighty percent of the infants had a pretreatment CI > 81%. Their initial mean CI at mean age 5.3 months was 89%, and after treatment, their mean CI was 87% (±2 SE = 0.9%) at mean age 9.0 months. For 92 infants with an initial CI at or above 90%, their initial mean CI of 96.1% was reduced to a mean of 91.9%.

Conclusions

Post-treatment CI was 86% to 88%, CI in neonates delivered by cesarean section was 80%, and CI in supine-sleeping Asian children was 85% to 91%, versus 78% to 83% for prone-sleeping American children. Repositioning was less effective than cranial orthotic therapy in correcting severe brachycephaly. We recommend varying the head position when putting infants to sleep.

Link

March 26, 2006

Heritability of human craniometric traits

An interesting new paper on the heritability of craniometric traits. Such studies are important, because they help distinguish between traits that are highly heritable, and hence useful for determining genetic relationships between populations and individuals, and those that are affected more by environmental factors, and are thus less useful. Of course, as the table below shows, heritabilities are not trait specific but differ across samples. (See here for definitions of the standard variable codes used in the table).


Am J Phys Anthropol. 2006 Mar 21; [Epub ahead of print]

Maximum likelihood estimation of human craniometric heritabilities.

Carson EA.

This study presents univariate narrow-sense heritability estimates for 33 common craniometric dimensions, calculated using the maximum likelihood variance components method on a skeletal sample of 298 pedigreed individuals from Hallstatt, Austria. Quantitative genetic studies that use skeletal cranial measurements as a basis for inferring microevolutionary processes in human populations usually employ heritability estimates to represent the genetic variance of the population. The heritabilities used are often problematic: most come from studies of living humans, and/or they were calculated using statistical techniques or assumptions violated by human groups. Most bilateral breadth measures in the current study show low heritability estimates, while cranial length and height measures have heritability values ranging between 0.102-0.729. There appear to be differences between the heritabilities calculated from crania and those from anthropometric studies of living humans, suggesting that the use of the latter in quantitative genetic models of skeletal data may be inappropriate. The univariate skeletal heritability estimates seem to group into distinct regions of the cranium, based on their relative values. The most salient group of measurements is for the midfacial/orbital region, with a number of measures showing heritabilities less than 0.30. Several possible reasons behind this pattern are examined. Given the fact that heritabilities calculated on one population should not be applied to others, suggestions are made for the use of the data presented.

Link

Harvard working paper on Israeli lobby

A paper in the Harvard University John F. Kennedy School of Management has sparked quite a few posts in the blogosphere. (hat tip Steve Sailer). The beginning of the first endnote (p. 43) makes a good point:
Indeed, the mere existence of the Lobby suggests that unconditional support for Israel is not in the American national interest. If it was, one would not need an organized special interest group to bring it about. But because Israel is a strategic and moral liability, it takes relentless political pressure to keep U.S. support intact.


Faculty Working Paper
The Israel Lobby and U.S. Foreign Policy
By John J. Mearsheimer and Stephen Walt
Working Paper Number:RWP06-011

Abstract

In this paper, John J. Mearsheimer of the University of Chicago's Department of Political Science and Stephen M.Walt of Harvard University's Kennedy School of Government contend that the centerpiece of U.S. Middle East policy is its intimate relationship with Israel. The authors argue that although often justified as reflecting shared strategic interests or compelling moral imperatives, the U.S. commitment to Israel is due primarily to the activities of the “Israel Lobby." This paper goes on to describe the various activities that pro-Israel groups have undertaken in order to shift U.S. foreign policy in a pro-Israel direction.

Link (free access)

March 23, 2006

Body size and proportions of Tyrolean Ice Man

J Hum Evol. 2006 Mar 17; [Epub ahead of print]

Body size, body proportions, and mobility in the Tyrolean "Iceman"

Ruff CB et al.

Body mass and structural properties of the femoral and tibial midshafts of the "Iceman," a late Neolithic (5200BP) mummy found in the Tyrolean Alps, are determined from computed tomographic scans of his body, and compared with those of a sample of 139 males spanning the European early Upper Paleolithic through the Bronze Age. Two methods, based on femoral head breadth and estimated stature/bi-iliac (pelvic) breath, yield identical body-mass estimates of 61kg for the Iceman. In combination with his estimated stature of 158cm, this indicates a short but relatively wide or stocky body compared to our total sample. His femur is about average in strength compared to our late Neolithic (Eneolithic) males, but his tibia is well above average. His femur also shows adaptations for his relatively broad body (mediolateral strengthening), while his tibia shows adaptations for high mobility over rough terrain (anteroposterior strengthening). In many respects, his tibia more closely resembles those of European Mesolithic rather than Neolithic males, which may reflect a more mobile lifestyle than was characteristic of most Neolithic males, perhaps related to a pastoral subsistence strategy. There are indications that mobility in general declined between the European Mesolithic and late Neolithic, and that body size and shape may have become more variable throughout the continent following the Upper Paleolithic.

Link

March 22, 2006

Personal ornaments reveal ethno-linguistic diversity of Aurignacian Europe

Journal of Archaeological Science (Article in Press)

Aurignacian ethno-linguistic geography of Europe revealed by personal ornaments

Marian Vanhaeren et al.

Abstract

Our knowledge of the migration routes of the first anatomically modern populations colonising the European territory at the beginning of the Upper Palaeolithic, of their degree of biological, linguistic, and cultural diversity, and of the nature of their contacts with local Neanderthals, is still vague. Ethnographic studies indicate that of the different components of the material culture that survive in the archaeological record, personal ornaments are among those that best reflect the ethno-linguistic diversity of human groups. The ethnic dimension of beadwork is conveyed through the use of distinct bead types as well as by particular combinations and arrangements on the body of bead types shared with one or more neighbouring groups. One would expect these variants to leave detectable traces in the archaeological record. To explore the potential of this approach, we recorded the occurrence of 157 bead types at 98 European Aurignacian sites. Seriation, correspondence, and GIS analyses of this database identify a definite cline sweeping counter-clockwise from the Northern Plains to the Eastern Alps via Western and Southern Europe through fourteen geographically cohesive sets of sites. The sets most distant from each other include Aurignacian sites from the Rhône valley, Italy, Greece and Austria on the one hand, and sites from Northern Europe, on the other. These two macro-sets do not share any bead types. Both are characterised by particular bead types and share personal ornaments with the intermediate macro-set, composed of sites from Western France, Spain, and Southern France. We argue that this pattern, which is not explained by chronological differences between sites or by differences in raw material availability, reflects the ethnolinguistic diversity of the earliest Upper Palaeolithic populations of Europe.

Link

March 21, 2006

The geography of European phenotypical variation

29 composite pictures of male athletes.


If your country is not listed here, and you know of a good source of facial athlete pictures, e.g., the website of soccer team(s), drop me a line. I won't promise to do all countries, but I will return from time to time to this map to fill in some of the gaps. Also, note that 10 pictures is the bare minimum, although I would prefer a source of pictures with at lesat 16 native athletes, which is the number used for most of the composites in the map.

March 20, 2006

A few good sperm

Wanted: A few good sperm is a very informative New York Times article into the phenomenon of single women choosing to become single mothers using artificial insemination. I wonder which of these men or these would female readers of this blog choose as the fathers of their children.

Update: A reader alerts me that 60 minutes has also done a story on the same subject which you can watch online here.

See also the DonorSiblingRegistry.com registry list with descriptions.

March 18, 2006

Speculate or Comment

29 composites and counting


Skeletofacial morphology and facial attractiveness

Somewhat unrelated, but don't foget to vote in the attractiveness poll.

The Angle Orthodontist
: Vol. 76, No. 2, pp. 204–210.

Skeletofacial Morphology of Attractive and Nonattractive Faces

Stamatia Matoula Hans Pancherz

ABSTRACT

The aim of this study was to answer the question: Is facial beauty related to specific skeletofacial morphology? Thirty attractive (25 females, 5 males) and 32 nonattractive (11 females, 21 males) subjects were compared. Facial attractiveness was assessed by the aid of en-face facial photographs. Skeletofacial morphology was determined using lateral head films. The radiographs were analyzed with respect to sagittal and vertical jaw relationships, facial height, profile convexity, and lip position. The relationship between the skeletofacial variables and “divine” facial proportions was evaluated with a facial disproportion index in the transverse and vertical plane. When comparing attractive with nonattractive females, the attractive females had a larger ANB angle and Wits-appraisal (P < .05 and P < .001, respectively), the soft tissue profile was more convex (P < .01), and the distances of the upper and lower lips to the “Esthetic Line” (E-line) were smaller (P < .01). When comparing nonattractive females with nonattractive males, the males had a larger Wits-appraisal (P < .01), the soft tissue profile was more convex (P < .01), and the distances of the upper and lower lips to the E-line were smaller (P < .01). A significant correlation (P < .05) between the skeletofacial variables and the transverse and vertical facial disproportion indices was found only for the ML/NL angle (transverse: r = −0.73, and vertical: r = 0.68) and for the posterior facial height (transverse: r = 0.80). It could be concluded that facial beauty in frontal view is related only to a minor degree to specific skeletofacial morphology in lateral view. Link

March 16, 2006

mtDNA distribution in European Russian populations

Very interesting article:
Russians, who occupy an immense area comparable by its size with the whole Western Europe, are characterized by substantial anthropological and dialectic diversity. Development of the independent Russian nation began in the 9th century A.D., as a result of the integration of Eastern Slavic tribes within the frames of the Old Russian State, and assimilation of Finno-Ugric, Baltic, and Turkic ethnic groups [1]. Subsequent integration and migration processes, as well as an enlargement of the territory of residence, introduced new ethnic elements into the Ancient Russian ethnic group. Numerous investigations of anthropological traits and classical genetic markers provided the idea on the complex genetic structure of Russians, and described the regional differences between different groups, caused by the interaction of newly arrived Slavic tribes with aboriginal populations. Until recently, mitochondrial DNA (mtDNA) diversity of Russians was studied only in some individual populations. At present, this problem attracts growing attention.

...

Most part of these mitotypes (from 80 to 85%) mark the main European haplogroups, H, I, J, K, T, U, V, W, and X (Table 2). Five of these haplogroups, H, U, J, T, and K, which are most prevalent among the European populations, account for 70 to 78% of the total diversity. In general, haplogroup frequency distribution patterns described in Russian populations were similar to those in European populations [5, 10–14, 16]. However, it should be noted that rather high frequencies (14 to 19.5%) of the mitotypes, not attributed to the haplogoups mentioned, were observed in the Russian populations examined (in Table 2, these mitotypes are defined as “others”). This mitotype group may contain Asian and some minor European haplogroups, the members of macrohaplogroup N.

...

Finally, the most “specific” Tambov oblast is located at the border between the Eastern European and the steppe complex, the anthropological specificity of which was repeatedly mentioned in a number of studies [1, 20].


...

Thus, our results point to closeness of the populations from three oblasts (Ivanovo, Ryazan’, and Vologda) to the average regional type, as well as to a substantial difference of the representatives of the two southern oblasts, Orel and Tambov, from this average type. It seems likely that this pattern reflects subdivision of the Russian ethnic area into zones determined by the patterns of the relationships between the Slavs and the local ethnic groups. This subdivision was first described by Rychkov et al. in their study of anthropological and classical genetic markers [8, 21]. According to the view of these authors, this subdivision reflected the movements of the annalistic Slavs from the west eastward. Ivanovo, Ryzan, and Vologda oblasts, defined in the present study as “middle Russian,” are located within the most typical of Russian population “zone of panmixia,” i.e., the region where the forward movement of ancient Slavs proper was replaced by intensive assimilation of the local (in this case, probably, Finno-Ugric) population [8, 21]. At the same time, “genetically specific” populations (Orlov and Tambov) are territorially close to the “cores” of the greatest anthropological specificity of the Russian population, which, according to Rychkov et al., traces back to the annalistic Slavic tribes [8]. Inclusion of more Russian populations in further analysis will probably enable more precise characterization of the observed patterns.
Characteristics of the eastern European complex:
Characteristics: Darkening of the color of the hair and eyes distinguishes this from the White Sea-Baltic group. In the territory of the eastern European plain have been isolated several local combinations, that are differentiated, in essence, by variations in the cephalic index, and by the width and proportions of the face.

Description of the steppe complex:
Steppe Complex. Unfortunately, the population of the Steppe zone has been rather poorly studied by anthropologists. Therefore, the description of the Steppe complex is based only on scanty data regarding some Russian groups inhabiting the midflows of the Dona and Khoper rivers, and a few Turkic-speaking groups dwelling on the right banks of the Volga, most importantly the Mishars. The populations which form this complex are distinguished by mesocephaly, relatively small absolute dimensions of the head and face, partial depigmentation, intermediate development of tretiarry hair cover, intermediate horizontal facial profile and relatively strong nasal protrusion.
See also Hair-color of the Proto-Slavs, Hair-color of the Proto-Slavs (revisited).

Russian Journal of Genetics
Volume 41, Number 9

Mitochondrial DNA Polymorphism in Russian Population form Five Oblasts of the European Part of Russia

I. Yu. Morozova et al.

Abstract New data on mitochondrial DNA polymorphism among Russian population from five oblasts, located within the main ethnic area of Russians, specifically, Ryazan' oblast, Ivanovo oblast, Vologda oblast, Orel oblast, and Tambov oblast (N = 177) are presented. RFLP analysis of the mtDNA coding region showed that most of the mtDNA diversity in the populations examined could be described by main European haplogroups H, U, T, J, K, I, V, W, and X. Haplogroup frequency distribution patterns in the populations of interest were analyzed in comparison with the European and Uralic populations. Based on the haplogroup frequencies, the indices of intraethnic population diversity, Wright's F st statistics, and the values of squared deviation from the mean, as well as genetic distances between Russians and European and Uralic populations were estimated. Analysis of these indices along with the anthropological data provided identification of a number of regional groups within the populations examined, which could either result from the interaction of ancient Slavs with different non-Slavic tribes, or could be caused by the ethnic heterogeneity of the ancient Slavs themselves.

Link

Chinese, Korean, Japanese

but who is who?


Answer: just as in the title.

March 15, 2006

Who is the most attractive? (result)


Feel free to invite your friends or to promote this in your blog. The greater the sample size, the better. And, don't ask me for the answers soon, I want to see a really big sample before giving out the answer! You can of course use the comments section to speculate as to the identity of the contestants.

Click on the picture for the original at a higher resolution.


With this post, I want to study (a) what type is considered most attractive by readers of the blog, and (b) to see whether there is agreement in male vs. female ratings of attractiveness.

Results: