This relation between the number of people who aren’t of working age and the number of people who are is captured in the dependency ratio. In Ireland during the sixties, when contraception was illegal, there were ten people who were too old or too young to work for every fourteen people in a position to earn a paycheck. That meant that the country was spending a large percentage of its resources on caring for the young and the old. Last year, Ireland’s dependency ratio hit an all-time low: for every ten dependents, it had twenty-two people of working age. That change coincides precisely with the country’s extraordinary economic surge.
...
Economists have long paid attention to population growth, making the argument that the number of people in a country is either a good thing (spurring innovation) or a bad thing (depleting scarce resources). But an analysis of dependency ratios tells us that what’s critical is not just the growth of a population but its structure. “The introduction of demographics has reduced the need for the argument that there was something exceptional about East Asia or idiosyncratic to Africa,” Bloom and Canning write, in their study of the Irish economic miracle. “Once age-structure dynamics are introduced into an economic growth model, these regions are much closer to obeying common principles of economic growth.”
I was extremely pleased to see this point being argued. I had made a similar observation back in 2003 in Fishing in the Pond of Correlation.
Let's take factor #1: Demographic Structure. I used % of population under age 15 as a proxy for this factor. The intuition goes that since children don't have the capacity (muscle or intellectual) to produce as much as adults, a nation with a large number of children will have a lower per capita income.Indeed, there is a -0.71 correlation between % of population under 15 and per capita PPP, accounting for 50% of the variance of the dependent variable.
Roughly half the population in the world is women. Women get pregnant and while pregnant or rearing young children can't be as productive as men. So, we expect that nations where women have lots of children will have a lower per capita income, simply because half their population spends quite a lot of time being pregnant, breastfeeding or changing diapers. This is factor #2, which also relates to Demographic Structure.
Steve brings the example of Ukraine as an argument against the idea that population structure affects prosperity. I had actually observed this discrepancy in my original post:
Finally, I list the 10 countries whose per capita PPP is most overestimated by the model: Ukraine, Georgia, Bulgaria, Croatia, Cuba, Romania, Bosnia and Herzegovina, Moldova, Rep. of, Sri Lanka, Russian Federation
It is clear that adding "democracy" as a value, would help eliminate these residual errors. The 10 countries whose income is most underestimated are: Australia, Brunei Darussalam, Switzerland, Denmark, Canada, Equatorial Guinea, Norway, Iceland, Ireland, United States
It is notable that many of these countries have abundant natural resources (e.g., Iceland, Norway, Brunei), special financial status (Switzerland), or a large territory with respect to their population (Canada, Australia).
So, yes, demographic age structure is indeed a major determinant of economic prosperity as measured by per capita PPP, more so, once we control for factors such as recent history or natural resources.
Update (Aug 28): I have re-uploaded the data file in the old entry; it was missing from the old blog archive in 50webs. The link to the UNDP report from 2003 is also outdated. Here is a link to the latest 2006 report.
Here are the statistics on population under age 15. and PPP per capita from the UNDP website.
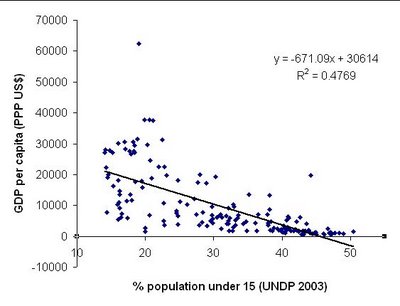
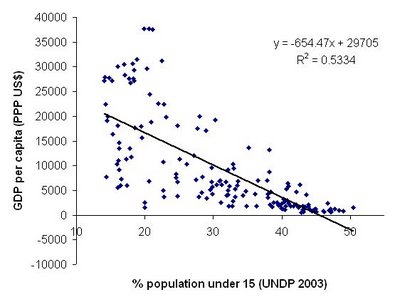
After repeating the calculations, I have found a correlation of -0.69 between population under age 15 and GDP per capita (US$ PPP). The scatterplot is even more informative.

It is clear that countries with large populations of dependents (on the right of the figure) all have small per capita income. Other factors may play a bigger role in countries with moderate and small populations of dependents.
The outliners in the graph are Equatorial Guinea and Luxembourg. If they are removed, the correlation becomes even more pronounced (-0.73)

I have often tried tried to show (e.g., for disease or hair dye sales) that we do not need to postulate elaborate explanations for phenomena when simpler ones suffice.
In this case, the lower per-capita GDP is a logical consequence of a high population of children: Per-capita GDP can be expressed as (Number of productive individuals)*(Average Individual Production)/(Total Population). Countries with a great number of children are expected to have a low (Number of productive individuals)/(Total Population Ratio), or conversely a high dependency ratio, and hence we expect them to have a low per capita GDP! This is a logical consequence and requires no assumptions about, say, the relative ability of different populations.
So, why should we bother with Lynn-ian speculations about intelligence and prosperity which depend on the unsubstantiated assumption of substantial genetic differences in cognitive ability among major races when a simpler model, which makes no such assumptions is able to capture the data as well, or even better?
Update II: A reader makes the interesting point that children, rather than dependents are the critical parameter. I have calculated the correlation between GDP per capita (US$ PPP) and population over 65 (without the outliers mentioned above) and obtained a value of +0.7, consistent with the idea that people in prosperous societies live longer.
Then I added up the fraction of people age less than 15 with that more than 65, to obtain a total fraction of the population that is expected to be "dependent" on the productive population between ages 15 and 65. The new correlation is -0.66. Thus, both the fraction of the productive population (aged 15 to 65) as well as the fraction of the adult population (aged 15+) both have roughly the same explanatory power.
 Update III (Aug 29): Here is a comment I left in Jane Galt's topic on the subject:
Observable GDP/capita is not caused by any single factor. However, it is partially caused by demographic structure. By "caused" I mean that if we change the variable "dependency ratio" then we expect to immediately and predictably change the variable "GDP per capita".Incidentally, as I have mentioned in my blog, the reduction in per capita income is not caused only directly from the smaller fraction of active individuals: an even smaller fraction of individuals can really be active, since a substantial part of them, especially young mothers, spend a lot of time in activities of little economic value.
For example, imagine a toy society in which active individuals produce 100 units. If one society has 50% dependents, and another 25% dependents, then we expect the per capita income of the first one to be 50 and of the second one to be 75. But, the first society also has lots of individuals who do not produce a lot because they take care of the dependent population. If, say, 2 dependents use up the resources of an active individual, then the "real" active fraction in the first population will be 25%, and 62.5% in the second one, and the corresponding per capita income will of course be 25 and 62.5. Thus, even though individuals produce exactly the same in both societies, demographic factors cause one to exhibit 2.5 more per capita GDP than the other.

No comments:
Post a Comment