ADDENDUM:
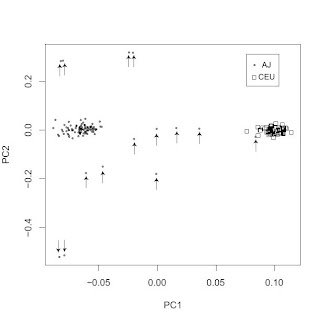
A common misconception, which I hear about often when people are exposed to PC plots such as the above is that it is taken as evidence for a lack or shortage of gene exchange between the clearly separated populations.
This is not, however, the case. What the plot shows is that you can score a person's genome on two variables (the first two principal components) giving you an (x, y) pair. Using this pair, you can guess confidently that they are much more likely to be of AJ rather than CEU origin or vice versa.
This does not mean that there has been limited gene flow between AJs and CEUs. It just means that historically intermarriage did not win out against intramarriage, and hence AJs and CEUs could develop distinctive gene pools.
BMC Genetics
Analysis of genetic variation in Ashkenazi Jews by high density SNP genotyping
Adam B Olshen et al.
Abstract (provisional)
Background
Genetic isolates such as the Ashkenazi Jews (AJ) potentially offer advantages in mapping novel loci in whole genome disease association studies. To analyze patterns of genetic variation in AJ, genotypes of 101 healthy individuals were determined using the Affymetrix EAv3 500K SNP array and compared to 60 CEPH-derived HapMap (CEU) individuals. 435,632 SNPs overlapped and met annotation criteria in the two groups.
Results
A small but significant global difference in allele frequencies between AJ and CEU was demonstrated by a mean FST of 0.009 (P < style="font-weight: bold;">
Conclusions
LD in the AJ versus CEU was lower than expected by some measures and higher by others. Any putative advantage in whole genome association mapping using the AJ population will be highly dependent on regional LD structure.
Link (provisional pdf)

No comments:
Post a Comment
Stay on topic. Be polite. Use facts and arguments. Be Brief. Do not post back to back comments in the same thread, unless you absolutely have to. Don't quote excessively. Google before you ask.