
Am J Phys Anthropol. 2006 Mar 21; [Epub ahead of print]
Maximum likelihood estimation of human craniometric heritabilities.
Carson EA.
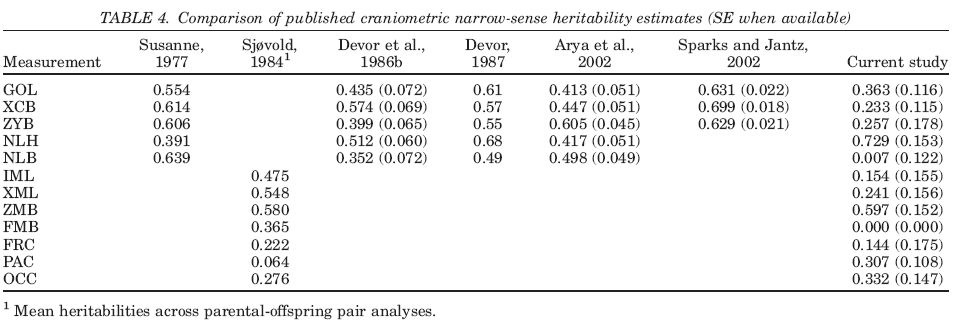
This study presents univariate narrow-sense heritability estimates for 33 common craniometric dimensions, calculated using the maximum likelihood variance components method on a skeletal sample of 298 pedigreed individuals from Hallstatt, Austria. Quantitative genetic studies that use skeletal cranial measurements as a basis for inferring microevolutionary processes in human populations usually employ heritability estimates to represent the genetic variance of the population. The heritabilities used are often problematic: most come from studies of living humans, and/or they were calculated using statistical techniques or assumptions violated by human groups. Most bilateral breadth measures in the current study show low heritability estimates, while cranial length and height measures have heritability values ranging between 0.102-0.729. There appear to be differences between the heritabilities calculated from crania and those from anthropometric studies of living humans, suggesting that the use of the latter in quantitative genetic models of skeletal data may be inappropriate. The univariate skeletal heritability estimates seem to group into distinct regions of the cranium, based on their relative values. The most salient group of measurements is for the midfacial/orbital region, with a number of measures showing heritabilities less than 0.30. Several possible reasons behind this pattern are examined. Given the fact that heritabilities calculated on one population should not be applied to others, suggestions are made for the use of the data presented.
Link
No comments:
Post a Comment
Stay on topic. Be polite. Use facts and arguments. Be Brief. Do not post back to back comments in the same thread, unless you absolutely have to. Don't quote excessively. Google before you ask.